
Designing Tableau Executive Dashboards for Smarter Decisions
Last updated on Nov 21, 2026
Data is rarely in limited supply in today’s organisations. The average business creates millions of rows of transactional records, customer interactions, supply chain logs and financial metrics each and every day. But even with large investments in business intelligence infrastructure, senior leaders often struggle to get clear and timely answers from their reporting systems. The lack of data is rarely the bottleneck, but the failure to translate. Executives receive operational reports with little thought that make leaders wade through dense grids, conflicting metrics and visual clutter just to know if the business is healthy or off track.
In order to have a strong executive dashboard in Tableau, there will be a need to change the paradigm—a basic principle that is learned during any structured tableau online training on business intelligence strategy. The operational dashboards help the analysts, the management, and other departments keep track of their work. Executive Dashboards, in contrast, are designed to support strategic alignment, resource allocation, and quick decision making. An executive dashboard is not a data dump. It is not a complete archive of every metric a department tracks. It’s an editorial product that gives you the answers to the most critical leadership questions in seconds.
The Executive Mindset and Decision Making Needs
Before you launch Tableau Desktop or connect to one data source, the dashboard designer must understand how senior leaders consume information. Chief Executive Officers, Chief Financial Officers, Chief Operating Officers and Vise Presidents work under extreme time pressure and cognitive load. An executive who attends board meetings, investor calls, strategy planning sessions and cross-functional escalations has little time to spend twenty minutes diving into an interactive workbook, playing with dozens of filter combinations or deciphering ambiguous axis labels.
Executives arrive at a dashboard with three fundamental questions:

So, where are we? Leaders need to see how they are tracking against targets, budgets or historic performance – and they need to see it clearly and in real time.
"Why is performance going this way? When one of the key metrics goes awry – whether that’s in a good or bad direction – executives need high-level diagnostic context that points to the underlying causes, like a specific region, product line or customer segment.
So what now? Businesses only benefit from data when it informs a decision. A good dashboard will tell you which risks need intervention and which opportunities deserve more investment.
If designers don’t answer those three questions and build dashboards around what data is available in the warehouse, the product does not get traction.” Senior leaders quickly abandon confusing dashboards and ask analysts for static slide decks or spreadsheet summaries. To be trusted and become part of the executive rhythm, a Tableau dashboard must respect the reader’s time, eliminate ambiguity, and prioritise strategic signal over operational noise.
Scope Definition through Stakeholder Discovery
The best Tableau implementations begin with structured discovery conversations, not technical prototyping. But too often, when you ask an executive what they want to see on a dashboard, the answers can be counterproductive. Stakeholders ask for every metric they can think of, just in case they’re missing something important. Or they ask for copies of old spreadsheet reports they’ve been using for years.

Effective discovery is moving stakeholders toward outcomes, not outputs. Instead of asking them what charts they want, ask them what decisions they make each week, month or quarter and what information drives those decisions. Ask them what keeps them up at nite, what metrics they look at first when getting ready for a board mtg, what threshold of variance would cause them to pick up the phone and call a regional director or department head.
In these sessions, set clear limits on scope and definitions:
Define metrics standards early on: Two dashboards showing different numbers for revenue, gross margin or customer churn is all it takes to kill executive trust. Only calculate once you have captured the specific business logic, currency conversion rules, fiscal calendar aligns and exclusion criteria.
Identify the audience and frequency: The granularity and refresh cadence of a dashboard that’s checked daily for a morning standup is different than that of a dashboard for a quarterly board review. Design for the primary decision cadence, not to please every possible time frame on one screen.
Restrict core Key Performance Indicators: “Top-level metrics for stakeholders should be limited to four to seven key indicators.” When everything is important, nothing is important. Other metrics can be stored in supporting drill-down views or separate operational workbooks.
Reaching an agreement upfront on business questions, metric definitions and scope avoids endless revision cycles and guarantees that all visual elements on the final canvas have earned their place.
Information Hierarchy and Visual Design Structure
We see in predictable ways and good dashboard design makes use of that to guide attention without effort. In Western reading cultures, our eyes naturally move across a screen in a F or Z pattern from the top left corner, moving across and down. This natural hierarchy should be reflected in your Tableau layout architecture, with the most important summary information at the top and the supporting context revealed as the eye travels down.
A battle-tested architectural framework divides the executive dashboard into three distinct horizontal zones:
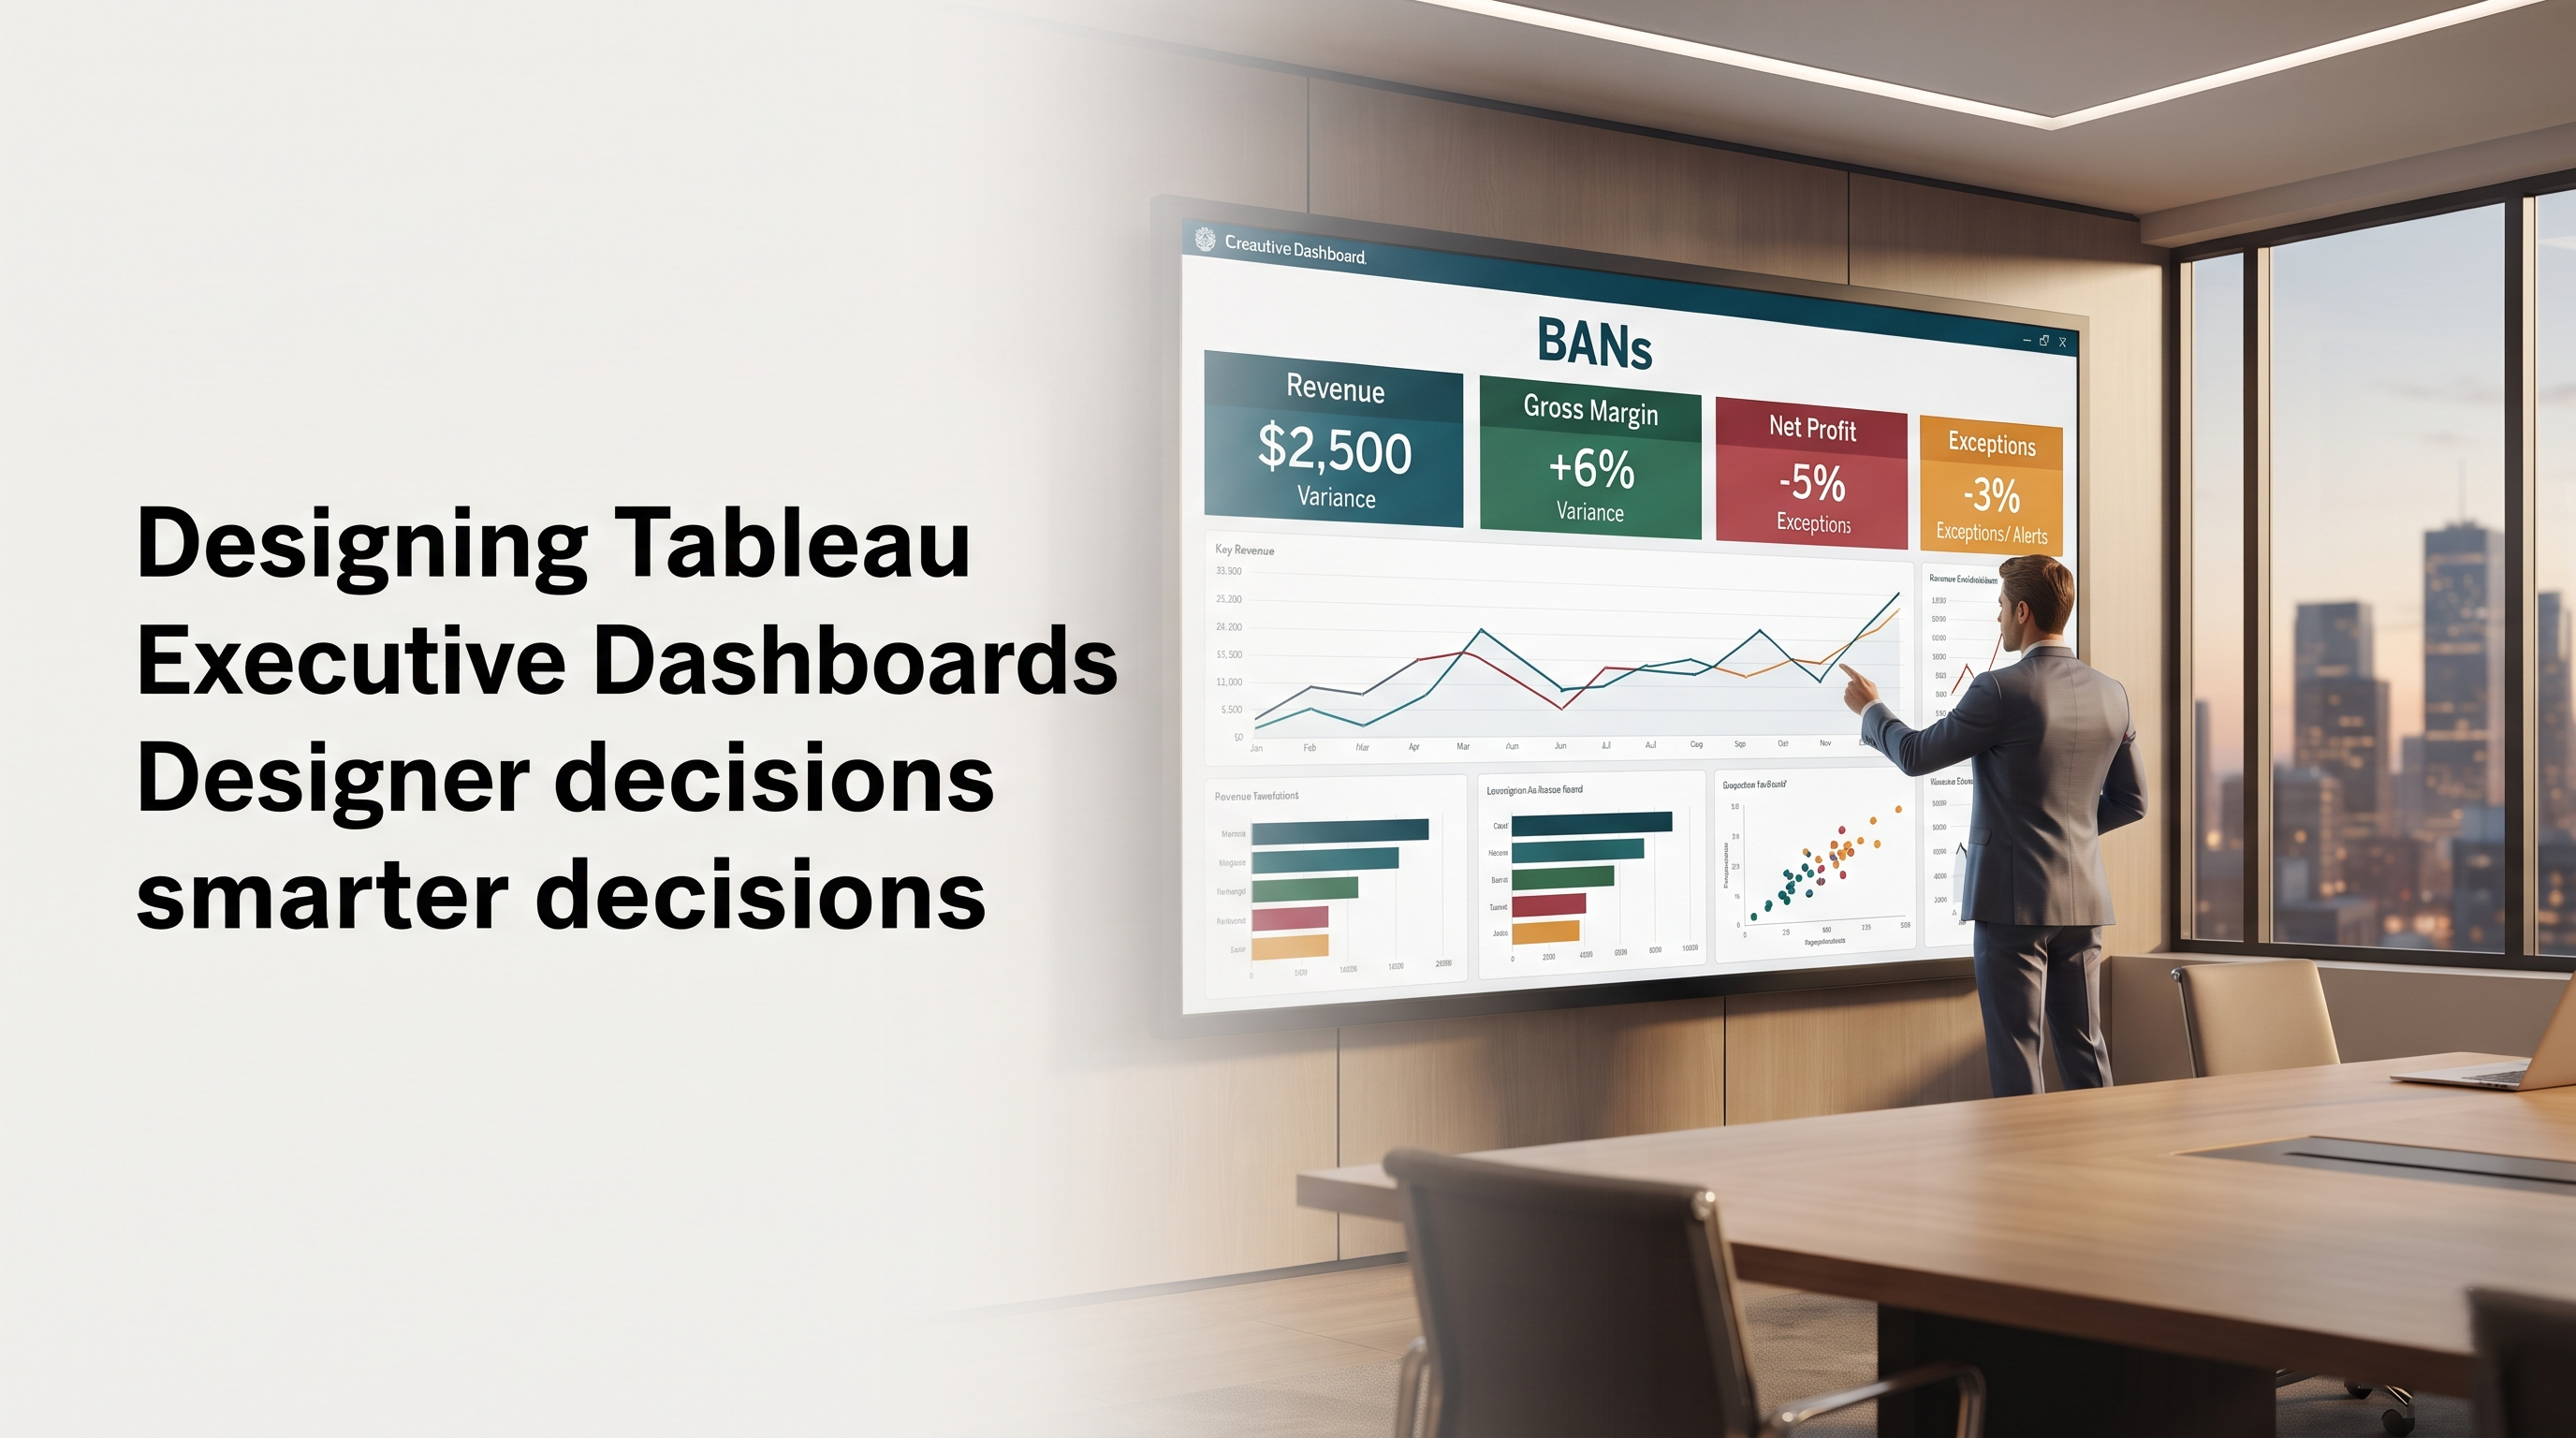
Executive Summary and Large Numbers: The Upper Zone. Display high level KPI cards at the top of the canvas. These are sometimes called BANs , or Big Ass Numbers . Each card should prominently display the value of the primary metric and should include a comparison indicator such as variance to target, percent change from prior year or trend direction. An executive should be able to glance at the top row for five seconds and tell you the health of the business.
Key Trends and Breakdowns: Middle Zone. Below the summary cards, display the main analytical visuals that explain the trajectory and composition. Line charts show performance over time and highlight momentum, seasonality and inflection points. You can use simple horizontal bar charts to see how you are doing across key business units, regions or product categories.
Bottom Zone: Diagnostic Detail & Exception Highlights. Use the bottom half of the dashboard to provide focused diagnostic context. This could be a ranked list of best performing accounts, a focused view of under-performing regions that need leadership attention, or a brief commentary block summarising the key takeaways.
Visual discipline should be maintained. The dashboard should be designed to fit comfortably on one screen without scrolling down or sideways. Scrolling disrupts context, hides important comparisons, and makes users rely on short-term memory as they jump back and forth between sections. Choose a standard dashboard size that is optimised for the devices your executives actually use. This is usually a standard widescreen desktop resolution to suit boardroom monitors and laptops, or a dedicated mobile layout if your leaders are often reviewing metrics on tablets and smartphones when they’re on the go.
The whitespace is just as intentional. Heavy shading, borders, gridlines and visuals crammed into every pixel cause cognitive fatigue. Padding generously around containers, consistent margins between cards, and clean alignment on an invisible grid give each chart room to breathe. The overall impression is of a calm, authoritative interface that simply feels easy to read.
Choosing the Right Visual Encodings in Tableau
Tableau offers great flexibility for creating visualizations from simple bar graphs and line graphs to scatter graphs, dual-axis graphs, and even geographical maps. While professionals normally learn the inner workings of these complex visualization tools through online tableau training sessions, executive dashboards require minimalistic visualizations. Chart types that are unorthodox or overly complex — such as radial bars, packed bubbles, multi-layered doughnut charts or dense heatmaps — force executives to burn brainpower deciphering the visual mechanics, instead of absorbing the business insight.
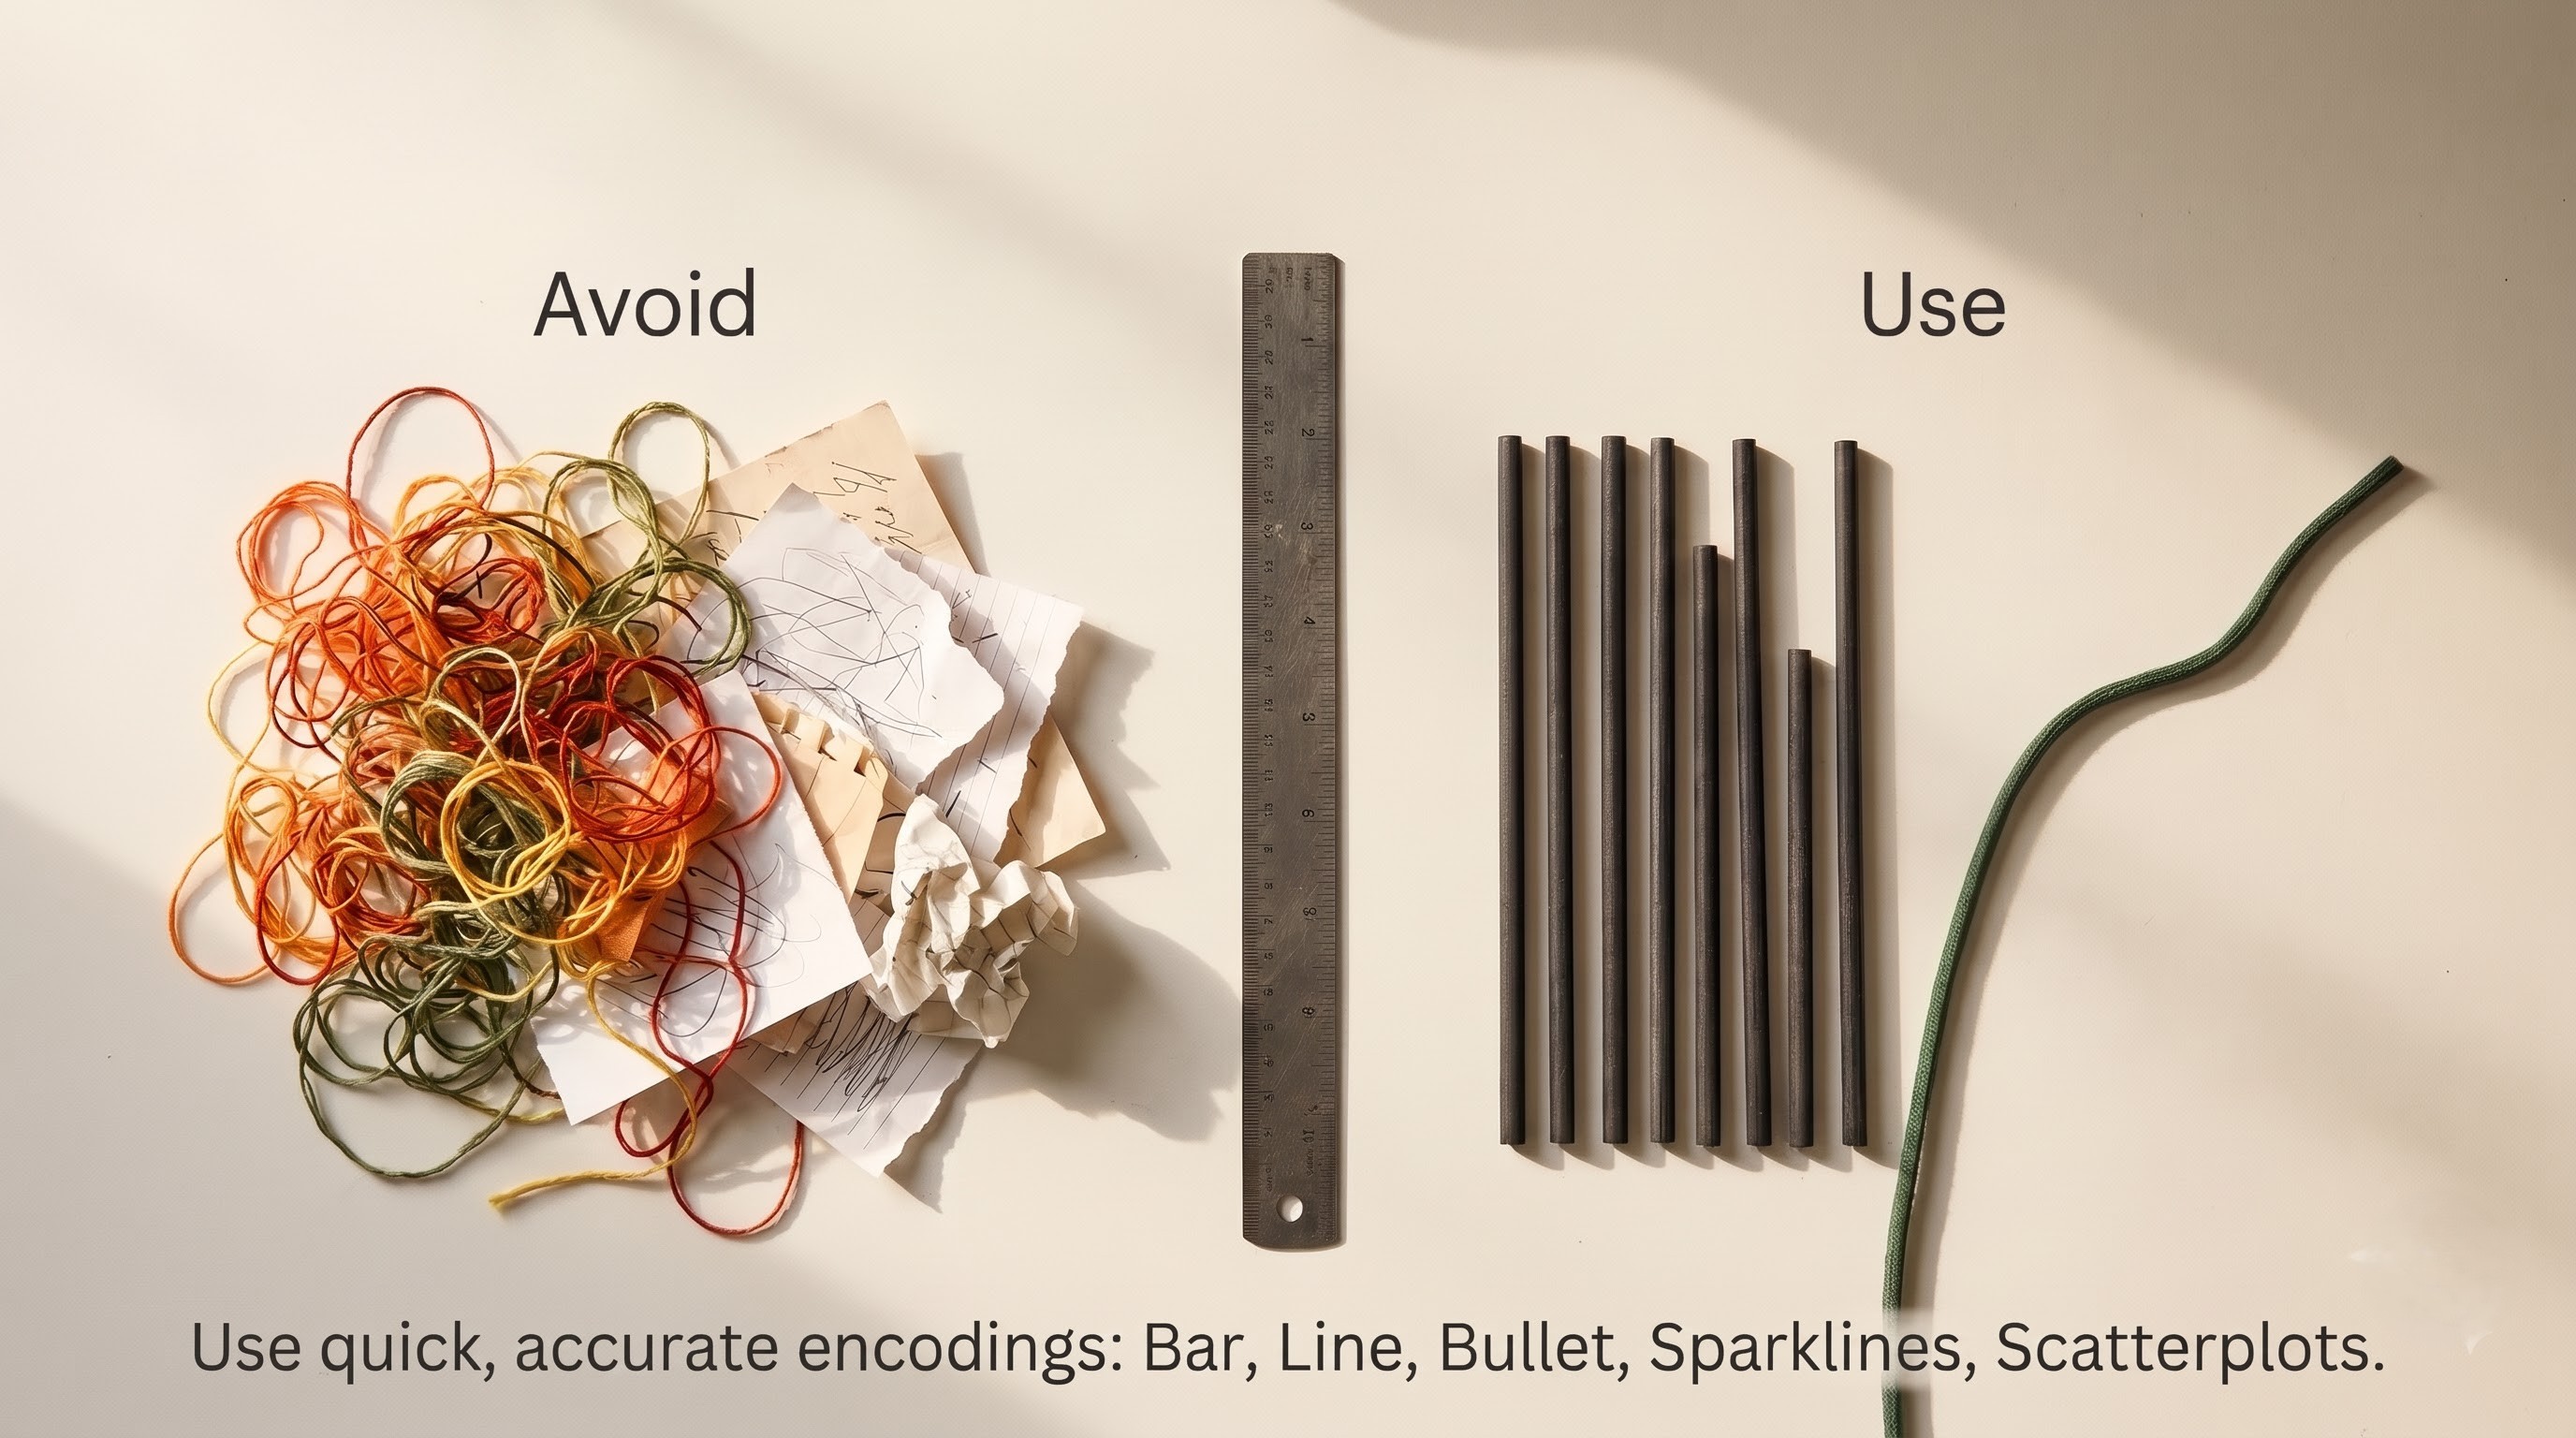
Use visual encodings that are quick and accurate to human perception:
Line charts for trend over time: Trajectory, velocity, cyclical patterns are best shown as a continuous line over time. Executive line charts need to pop and instantly show the current position. With a light reference line for budget or target and a unique marker or label on the latest data point, you can do just that.
Bar charts (horizontal) for comparing categories: If you’re looking at revenue by region, expenses by department or conversion rates by channel it’s easy to compare length and rank with horizontal bars sorted in descending order: The horizontal orientation also gives plenty of room for easy to read category labels, without any awkward slanted text.
Bullet charts for target performance: Bullet graphs are designed for executive reporting and provide a lot of context in a small space. One bar represents actual performance, a vertical marker represents target/budget and subtle background shading represents qualitative performance bands such as poor, satisfactory and good.
Sparklines for tight context trends: Embed small, no-frills line charts directly into KPI cards so that executives can get an instant sense of whether a headline number is on the rise, flat-lining or falling apart without taking up precious canvas real estate.
Portfolio and correlation analysis scatter plots: If leaders need to balance two dimensions at once – say, customer profitability versus revenue growth, or product margin versus sales volume – a tidy scatter plot with four quadrants will readily identify stars, cash cows and underperformers.
Do not use pie charts or stacked bars with more than two or three segments. Humans are notoriously bad at judging angles and areas . Stacked segments with no common baseline make accurate comparison near impossible . For every image that needs a long caption telling you how to read it, find a simpler, more direct image.”
Mastering Colour, Typography, and Pre-Attentive Features
Colour is the most powerful pre-attentive attribute available to a designer. That is, the human brain reacts to differences of colour in milliseconds, before conscious thought kicks in.
Unfortunately colour is also the most abused element in dashboard design: Default rainbow palettes, bright saturated backgrounds and arbitrary colour coding turn a strategic tool into visual chaos.
Never use colour in an executive Tableau dashboard for decoration: Each colour should have meaning. build on neutral platform Soft off-whites, light warm greys and deep charcoal Backgrounds, containers, axs and standard data marks. If eighty to ninety percent of the dashboard is visually quiet, any strategic splash of colour will command instant attention.
Exceptions only are alerted: Use high contrast semantic colours (e.g. muted crimson or amber for negative variance, deep teal or forest green for positive performance) only for status indicators, variance badges and threshold breaches. The visual urgency disappears when all the bars on a chart are bright green or red.
Think about accessibility and colour vision deficiency: The most common cause of colour blindness is red-green deficiency, which affects 8 percent of men and half of 1 percent of women. Use colour cues together with directional icons, up and down arrows or explicit text labels to make status obvious to anyone, regardless of how they see colour.
The palette is kept strictly consistent: If one chart uses a specific brand colour for actuals, use that exact shade of colour for actuals in all charts in the workbook. Target or prior year reference lines should be a neutral grey throughout.
Typography is also very important for hierarchy and polish: Select a clean, modern sans-serif typeface that looks good on all web browsers and operating systems. Create a disciplined typographic scale of no more than three or four sizes. Bold title in the dashboard header, medium-weight headers for each section, large prominent numerals for KPI values, and clear legible body text for axis labels and annotations. No italics, no fancy fonts, no all-caps paragraphs. These slow down reading speed and tire the eyes during long review sessions.
Intuitive Design of Interaction and Exploration
Interactivity is Tableau’s best feature, but too much can be overwhelming for executive users. Fifteen dropdown filters on your dashboard, cascading parameter controls, hidden hover tooltips — it all adds friction and uncertainty. Executives worry about clicking the wrong filter and ruining the view, or viewing an incomplete slice of the business without realising it.

Intentional, obvious and self-documenting behaviour:
Minimise and make obvious global filters: Keep the global filters to three or four key filters such as Date Range, Business Unit, Region or Currency and put these in a tidy horizontal band at the top of the dashboard. Always ensure that the current filter selection is clearly displayed in the subtitle of the dashboard or in dynamic headers so the user always knows the exact scope of the numbers on the screen.
Visual filtering on dropdown menus directly: Instead of making executives scroll through long dropdown lists, allow them to directly click-to-filter on the primary charts. In a regional summary chart, when a leader clicks the North America bar, the rest of the dashboard should smoothly filter down to North America, with a clear visual highlight and an easy reset.
Generate detailed conversation tooltips: Tooltips are great for secondary context that you don’t want to clutter up your main canvas with. Format tooltips using clear, natural language sentences that describe the exact data point, how it differs from the target, and the impact on the total, instead of using the default Tableau list of field names and raw values.
Navigate through the guide to progressively reveal structure: If executives want to drill into an anomaly, provide clean navigation buttons or subtle drill-through links that take them to a dedicated detail view filtered to their selection. Make sure you always have a prominent “Back to Executive Summary” button so they never feel lost in a complex workbook.
Action-oriented framing and narrative context
Numbers are not always the whole story, and especially for complex enterprises performance is heavily impacted by external market changes, supply chain issues or seasonal promotions. A manager who suddenly sees monthly margins drop needs to know whether this is a scary structural problem or a planned strategic discount. Raw metrics without context are misinterpreted and unproductive debate happens in leadership meetings.

With careful narrative framing, a Tableau dashboard can be changed from a passive reporting screen into an active decision support briefing:
Action-Oriented Chart Titles: Use dynamic, insight-driven titles that convey the takeaway or pose the business question. For example, instead of a generic title such as “Monthly Revenue by Region”, try “Revenue Growth Driven by Enterprise Expansion in EMEA” or “Regional Performance Against Q3 Targets”.
Use dynamic text and annotations: Call out major milestones, product launches, pricing changes or operational outages right on trend lines with Tableau's dynamic text and subtle point annotations. That explanation of a spike or drop is right there, saving executives the trouble of calling up analysts for background.
Add executive commentary in a structured format: They might have a card or pop-up panel for a brief, curated comment from the finance or business ops leads before the weekly or monthly review. This closes the loop between quantitative tracking and executive leadership with a short three bullet summary of key wins, main risks and recommended actions.
Contextualise each variance against a relevant benchmark: “$4 million in sales is not strategically meaningful in and of itself. Always link headline metrics to budget, forecast, prior period or prior year, so leaders can instantly understand if the number is a success or a shortfall.
Dashboard performance and data architecture optimisation
Even the most visually refined executive dashboard is worthless if it takes twenty seconds to load or times out in the middle of a live leadership meeting. If a view takes too long to respond after a filter is changed or a link is opened, trust in the whole analytics platform vanishes immediately. Senior executives want responsiveness at the consumer level.
In Tableau, performance is mostly won by disciplined data engineering before a single chart is drawn:
Executive-level data summary: Executive dashboards don't usually require row-level transactional granularity. Create pre-aggregated data tables or Tableau extracts aggregated to exactly the dimensions needed for the dashboard (e.g. daily or weekly totals by region, product line, channel). Load times go from glacial to instantaneous when you jump from tens of millions of raw rows to tens of thousands of aggregated rows.
Move heavy calculations to the database layer: Complex string manipulation, nested conditional logic and multi-table joins performed on the fly in Tableau slows down rendering. Do your data cleansing, business logic mapping and metric calculations upstream in your data warehouse or transformation pipeline so that Tableau can focus purely on fast visual rendering.
Minimise worksheets per dashboard: Separate queries are sent to the underlying data source for each individual worksheet on a Tableau dashboard . You want to have 5-8 different worksheets for each executive dashboard. Where possible, group related KPI metrics together in single, well-structured sheets, instead of having dozens of tiny, isolated worksheets.
Build custom visuals from your audits, filter and extract: Schedule automated extract refreshes for off hours so that data is warm and ready for the morning executive briefings. Avoid quick filters with high cardinality that force Tableau to run queries against thousands of unique values each time you open the workbook. Test dashboard load times thoroughly using Tableau’s built-in Performance Recorder before you launch.
Governance Getting the Executives on Board Testing
Launching an executive dashboard is not the end, but the beginning of a never-ending product life cycle. Treat the dashboard as mission critical software for long term adoption and alignment with the organization.
Before issuing the workbook to leadership, run structured usability testing with a small group of executive sponsors or chiefs of staff. Watch them use the dashboard without verbal directions. Watch where their eyes go first, watch where they settle and ask them to tell you what they think each chart is saying. If a test user misunderstands a metric or can’t find a filter, fix the design immediately. Don’t blame the user.
Embed clear governance and trust signals right into the interface:
Identify who owns the data and how current it is: Include a subtle header or footer badge with the exact time of the last data refresh, the authoritative source system, and the name or team responsible for maintaining the dashboard. Transparency builds confidence, especially when leaders get surprising numbers.
Provide a light weight metrics glossary: Info icon/help overlay that defines key metrics, explains formulas used for calculation in plain business English and highlights any known data caveats. That means no more asking the same questions in meetings over and over again and everyone is on the same page with one source of truth.
Embed the dashboard in existing leadership rituals: The best way to guarantee adoption is to embed the live Tableau dashboard right into recurring executive meetings, weekly business reviews and board presentations. When leaders actually run their meetings off of the dashboard, instead of pasting screenshots into static slides, the dashboard becomes the living pulse of the organization.
Iterate from telemetry and usage feedback: Check Tableau Server or Tableau Cloud viewership analytics in order to see which views executives are most engaged with and where engagement falls off. Hold quarterly leadership meetings to sunset legacy metrics, evolve targets for upcoming fiscal periods and adjust the dashboard as strategic priorities change.
Bringing It All Together
When designing executive dashboards in Tableau, the most important things are empathy, clarity and editorial discipline. Good designers resist the temptation to show every single data point possible and instead have laser focus on the key decisions that leaders need to make, turning raw enterprise data into true strategic leverage. When visual hierarchy does its job of guiding the eye, semantic colour exposes the real exceptions, narrative context explains the why behind the numbers, and sub-second performance respects executive time, A Tableau dashboard is much more than a simple report; it is the driving force behind clear insights which help the decision-makers within an organization make better, quicker, and more confident decisions. If you need help with learning to create dashboards, model your data, and improve performance through some practical tips and techniques, then taking a tableau online course at OnlineITGuru may be helpful to you.