
E-Commerce Analytics for Business Analysts: Understanding Customers, Sales and Repeat Purchases
Last updated on Sep 23, 2026

E-commerce businesses can see customer data than ever. Every product search, page visit, cart addition, purchase and repeat order leaves a record.. A large amount of data does not automatically mean a business knows its customers. A company might see sales rise month yet still not know why customers bought, where potential buyers stopped or why some customers never returned.
This is where business analysis becomes essential. The goal is not just to gather numbers or write another sales report. It is to grasp what is happening inside the business spot patterns and link those patterns to questions that truly matter. In E-commerce this can mean tracking the customer journey from the first website visit to the first purchase and eventually to repeat buying.
Tools, like Power BI can help by gathering kinds of business data into one place. Website activity, customer information, sales records and marketing data can be examined together to paint a picture of what is happening.. The tool is only one piece of the work. The real key is knowing what to analyze and why.
Your E-Commerce Sales Number Doesn't Tell the Whole Story
Imagine a store that made ₹50 lakh in sales last month. On the surface that sounds good. Management might want to know if revenue went up compared with the month, which products sold the most and which marketing channels brought customers to the website. These numbers leave several questions unanswered. How many people came to the website before any sales happened? How many looked at products. Left without buying anything? How many put something in their cart. Never finished the purchase? How many of the customers who bought were new to the store? How many came back. Bought again? These questions matter because revenue is the result of customer choices. A customer must first find the business get interested in a product think about the price and other options. Then decide to buy. After that purchase another choice begins: whether to come back.
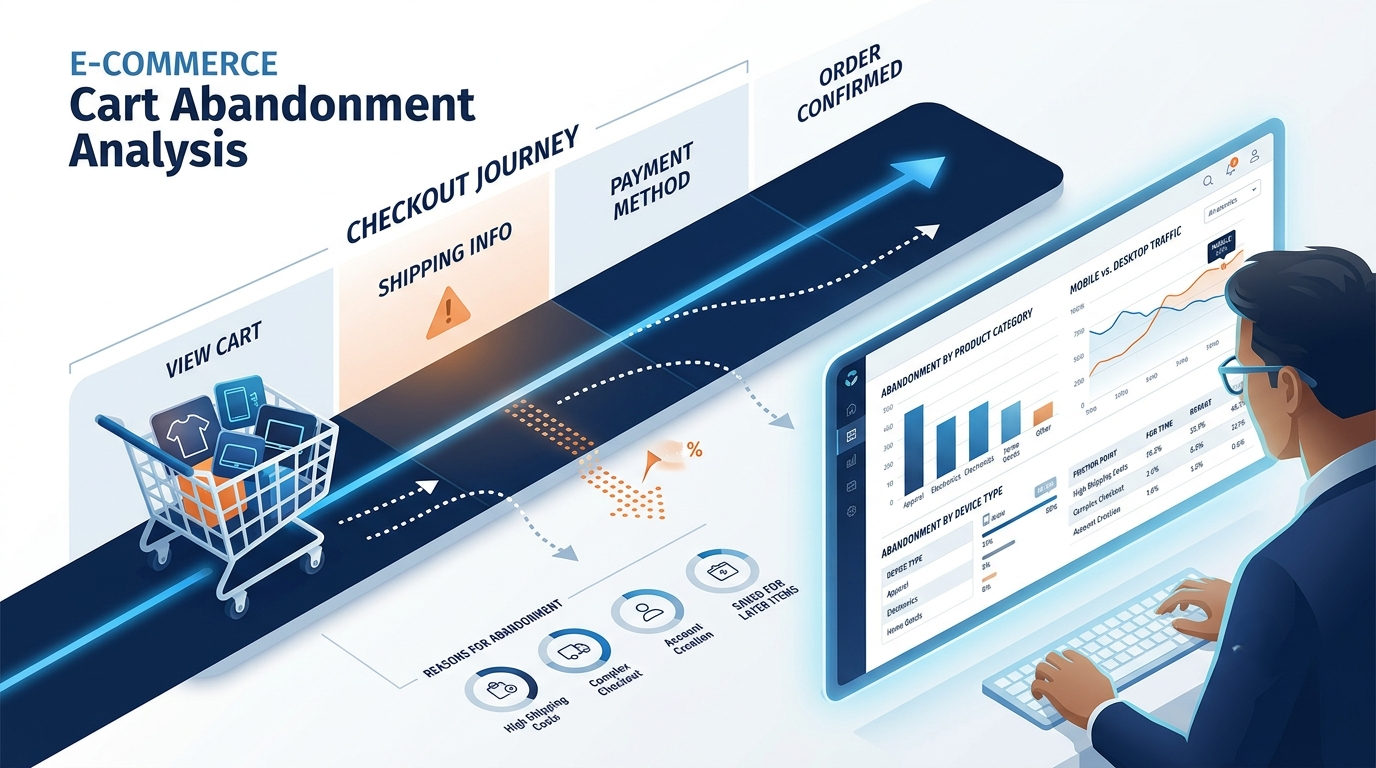
A business analyst looks at the picture instead of seeing sales as a single number. The analyst might start with a business need such as figuring out why online conversion dropped or why repeat purchases are slowing down. From there the analysis can look at customer behavior, product performance, marketing sources and order history. This method also helps avoid an issue in reporting. A dashboard can show that conversion went down. The number alone doesn't explain why. The next step is to look where the change happened and see if it is connected to a product, customer group, device, channel or time period. Power BI can help with this investigation by letting data sets and business measures be viewed together. Its value in this case is not just making charts. It gives analysts a way to look at data, from perspectives and share the results with people who need to make business decisions.
For a business analyst the main question is not just "What are the numbers?" It is also "What do these numbers say about the business?"
What Happens Between "Add to Cart" and "Buy Now”?
The distance between "interested customer" and "customer who made a purchase" is one of the most important areas of research in contemporary e-commerce. A customer can come in via a search engine or a banner ad, browse the site, find a product of interest, and add it to their cart. In this case, the business already has a great sign of engagement: a customer has shown interest in purchasing and actively added an item to the cart. However, this does not mean that a purchase is imminent. They can come back later and abandon the cart, compare different items, change their mind, or have problems with checkout. If there is a noticeable drop-off between adding items to the cart and purchasing, studying this point will show why it is happening.
Here is an example of a simple funnel:
Website Visit → Product View → Add to Cart → Checkout → Payment → Purchase
Power BI can visualize this type of information in a funnel chart, which effectively shows the conversion at each stage. However, the main advantage of the funnel chart is that it allows researchers to look at the breakdown of customers at different levels. For instance, there is an imaginary online store, which employs a team of 20,000 regular visitors to the site. Approximately 8,000 of them are engaged enough to view some products, 3,000 add items to their cart, 1,800 are ready to check-out, and 1,200 complete their purchases. The distribution presented above can raise many questions.
First of all, it should be noted that 75% of visitors leave the site without visiting any pages, which is usually impossible to control. However, the dramatic drop at the second stage (product view to add to cart) suggests that something might be wrong with the add-to-cart button or the product page itself. The next stage suggests there is a problem with the checkout page. However, if we go deeper into the data, we can see that the traffic distribution is abnormal in different segments. Mobile visitors are entirely different from desktop visitors. Some categories have more issues than others, and some marketing channels might be underperforming. Information about the funnel is an essential part of business analysis, but it rarely provides answers.
It should also be noted that analyzing cart abandonments requires a more profound understanding of the situation. High cart abandonment rates are usually not an indicator of a problem, per se. Visitors adding several items to their cart continue browsing the site. They can be encouraged to make a purchase with a discount or a special offer. Besides, many visitors are likely to add more expensive items to their cart later. Many visitors might leave the site due to issues while reviewing the shipping cost. Some may not want to purchase anything at all. Therefore, the analysis should not stop at the general observation of cart abandonment; it should identify specific problems.
I believe this to be especially important from a business analyst's perspective. Not only can they utilize data, but they can make decisions based on what they see. In cases like "the higher the cart abandonment rate is, the worse is the performance of the business," analysts should not use these findings to criticize the existing performance. Instead, they can take action and improve the product or the existing marketing campaign.
A First-Time Customer Is Not the Same as a Valuable Customer
Getting a customer to place an order is important. The first transaction does not reveal the whole story. Consider two customers. The first customer spends ₹4,000 once. Never returns. The second customer spends ₹1,500 every two months for two years. If the business looks at the first purchase, the first customer seems more valuable. Over a period, however, the second customer may bring in much more revenue. This is why customer lifetime value or LTV, is useful in e-commerce analysis. Instead of looking only at the first order LTV gives a wider view of the value that a customer creates over the time that a customer stays with the business.
Microsoft’s customer analytics documentation also explains lifetime value as an estimate of the value that an active customer might bring over a set period. For an analyst this changes the kinds of questions that can be asked. Instead of asking which customers spent this month, the business can ask which customer groups keep buying. It can compare first‑time customers with returning customers. Look at how revenue grows after the first purchase.
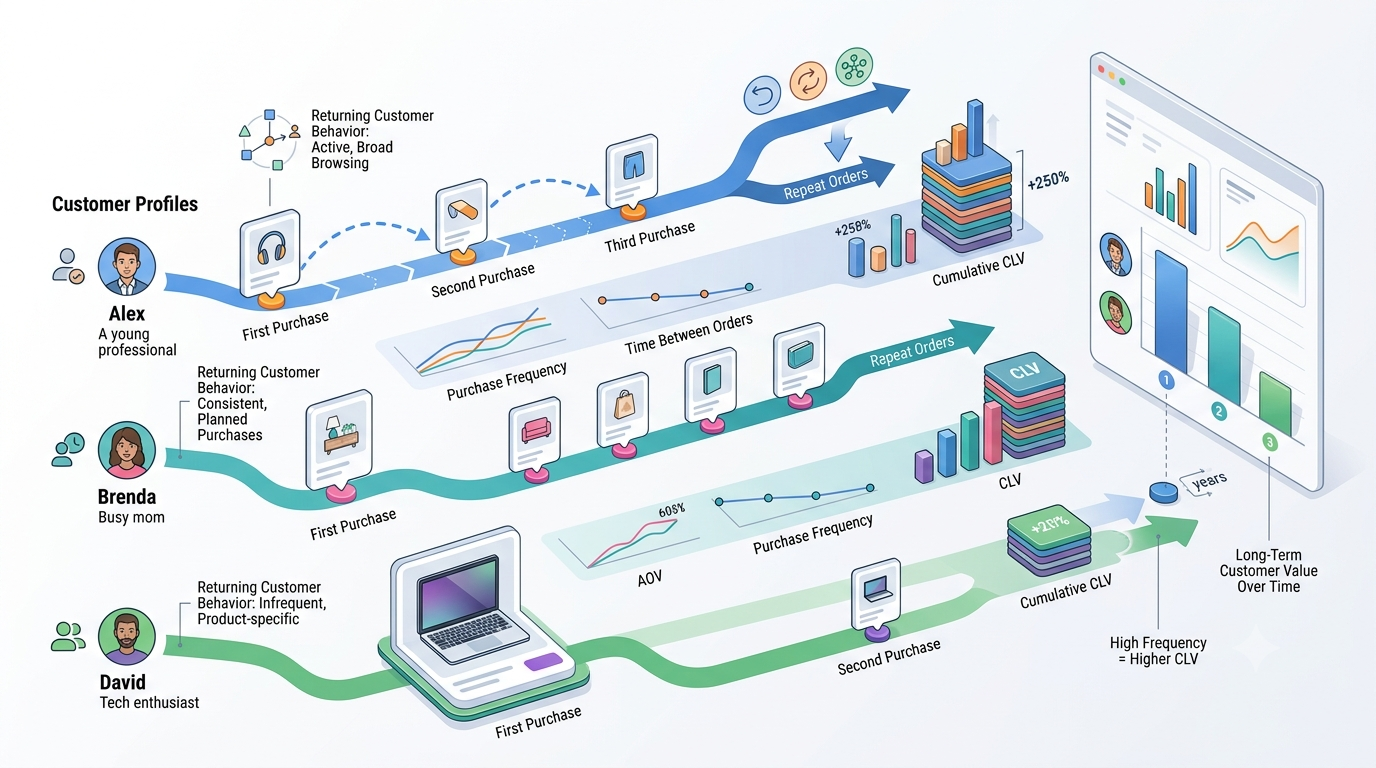
Customer value can also be studied with acquisition data. Suppose a campaign brings 2,000 customers. That sounds impressive. The business may want to know how many of those customers bought again. This is especially useful when evaluating marketing performance. A campaign that creates first orders may have a different long‑term result than a campaign that brings fewer customers who keep purchasing. This kind of thinking is useful for people learning their skills in a business analyst course because it shows how a simple business need can lead to many related questions. The analyst must understand the goal first. Then decide which measures can give proof.
LTV should not be treated the same as profit. A customer may bring revenue while also getting large discounts or causing high return, delivery or service costs. Depending on the business these factors may need to be looked at before making an assessment of customer value. The purpose of LTV analysis is therefore not to create another number, for a dashboard. It is to help the business understand customer relationships over time.
The Customers Who Come Back Can Tell You More
A first purchase tells a business that a customer was willing to buy. A second, third or fourth purchase gives clues about the relationship. Repeat purchasing can show whether customers are finding value to return.. Just counting how many customers come back is not enough. The time between purchases also matters. For example a customer who buys a product every 30 days has a different buying pattern than someone who buys the same product every six months. A change in the time between purchases can be important. It might mean something has changed—maybe the customer found an option or faced a new need.
This is where repurchase interval analysis becomes useful. An analyst can look at how many days pass between qualifying purchases. Then compare these intervals across groups of customers or different product types. This helps spot trends and understand behavior. A longer gap between purchases does not always mean a customer is lost. Some products naturally take longer to replace. For instance, a printer may last years while toothpaste gets used up quickly. The analysis must take into account what kind of product is being sold and how customers have behaved.
Cohort analysis adds more clarity. Of looking at all customers together, businesses can group them by when they first bought. For example, customers who made their purchase in January can be compared with those from February or March. This allows a company to see which groups keep coming back, how much they spend over time, and how their buying habits evolve. This approach can reveal insights that're hard to see in a simple sales report. A company might think it is doing well because revenue is growing.. If the number of returning customers is dropping, that growth could be due only to attracting new buyers. That’s a flag. Customer retention reporting helps break down customer states. Microsoft's Business Central documentation for example, uses categories like new, returning, recovered, temporarily lost, and lost. These labels help track each customer’s journey. For a business analyst, this data leads to questions. Are customers returning at the same rate as older ones? Has the average time between purchases increased? Do certain product categories lead to repeat buys? Are customers from channels more likely to come back?
These questions move beyond showing numbers. They push the analysis toward understanding why people act the way they do.
They also show that customer data should be viewed over time. One transaction tells little.. A series of transactions can show patterns—what keeps people coming back what makes them stop and what changes, in behavior matter most.
Turning E-Commerce Data Into Something a Business Can Actually Use
E-commerce data usually comes from places. Website analytics may hold data about visits. What customers do. The e-commerce platform holds orders and product details. A CRM may hold customer details while marketing platforms hold campaign and acquisition data. Looking at each source by itself can make it hard to see the customer journey.

A business analyst can help decide which data must be linked and what questions the final analysis should answer. Power BI can then act as the reporting and analysis layer to bring the data together. A practical e-commerce report might show revenue, orders, conversion rate, average order value, cart abandonment, new customers, returning customers, and repeat purchase behavior. The exact KPIs depend on the business requirements. The data model behind the report also matters. Website events and completed transactions are kinds of information. Website data may record product views, searches, cart additions, and checkout activity, while sales data may record order IDs, customers, products, quantities, discounts, and revenue.
These data sets can be linked through pieces such as customer, product, date, location and marketing channel. Keeping these areas logically organized helps reduce confusion when the business starts comparing metrics. Power BI can then let users filter the report by dimensions. A management team may want to see revenue while a marketing team may want to examine acquisition sources. A product team may want to investigate product‑level conversion while a customer team may want to focus on repeat purchases.
This is where the business analyst role is different from learning a reporting tool. The analyst first needs to understand the business requirement. If the requirement is "improve,sales " that statement is too broad to turn into a useful report right away. The analyst may need to clarify whether the business is concerned about traffic, conversion, order value, customer retention, product performance or another factor. Once the requirement is clear, the analyst can identify the data, define the KPIs, analyze the results, and communicate the findings.
This is also why BA analyst course that includes data analysis can be useful. Real business problems rarely arrive as defined questions. Analysts often need to clarify requirements, understand the data, identify gaps, and work with different teams before reaching a useful conclusion. The dashboard is therefore the part of a much larger process.
The Real Value Is in Knowing What to Ask Next
The biggest mistake a business can make with analytics is thinking that a dashboard alone solves a problem. A dashboard can show that conversion has dropped. It can point out that cart abandonment has gone up. It can highlight that repeat purchases have slowed down.. The dashboard does not answer the key question: Why?
If conversion has fallen the next step is to ask where exactly it happened. Was it on the homepage? During checkout? At a stage of the funnel?
If cart abandonment has increased the business should look at different products, devices, traffic sources, customer types and time periods. Comparing these factors helps find the root cause.
If repeat purchases have declined the analyst might study customer groups over time. Are cohorts dropping off? Does the gap between purchases get longer?
If revenue has gone up the business needs to know what drove the increase. Was it new customers? More returning ones? Higher prices? A shift in which products are selling well?
This leads to a powerful cycle:
Business Question → Data → Analysis → Finding → Further Question → Business Action
Power BI can help with gathering data and doing the analysis.. The real work happens when people think through what the numbers mean. That’s what makes e-commerce analytics so important for business analysis. The analyst isn’t just making charts or adding up totals. They’re trying to understand how the business is doing and why things are changing.
For someone thinking about a business analyst class, an e-commerce analytics project can be an example. It brings together key skills. It requires understanding what the business needs, finding the data, setting clear KPIs, studying customer behavior, sharing results clearly, and helping decision-makers see what the data shows. The valuable outcome isn’t always a complex model or a flashy dashboard filled with graphs. Sometimes it’s an insight that opens up a better question. An e-commerce business might start with "Why are our sales lower this month?" After looking at the customer journey, the question shifts to "Why are customers adding items to their carts but not checking out?" Then deeper analysis may show that the issue is only happening with users or in one product category.
That is the process of business analysis. Data helps narrow down what’s wrong until the business knows where to focus. E-commerce analytics goes beyond tracking sales. It gives a way to see how customers move through the buying process, where sales are lost, what keeps them coming, and how their value changes over time. Power BI can help make this information easier to explore and share.. The business analyst must still connect the numbers to real business situations. When the focus stays on asking the questions instead of just using tools e-commerce data becomes much more useful. Teams stop just knowing how much was sold. They begin to understand what caused those sales and what they should investigate next.