
Excel, SQL, Power BI, Jira: what should an aspiring business analyst learn first?
Last updated on Oct 10, 2026

Four Tools Every Beginner Learns At Once
You have decided to become a Business Analyst and started looking for information about the profession. In the first hour of research, you find dozens of articles and blogs discussing the tools an employer expects an entry-level candidate to know. Excel is mentioned as a must-have skill, SQL is included in the shortlist of frequently required competencies, Power BI is highlighted as a popular choice for data visualization, and Jira is presented as one of the most widespread ways to track dev team progress. You wonder if there is any sense in embarking on the learning path before you have mastered all four tools and can list your expertise on a resume. You watch a few videos and bookmark some useful websites, trying to absorb as much information as possible, but the more you learn, the more confused you become. The problem many new analysts face is that they try to learn individual tools in isolation without defining their role in the business analysis process.
A Business Analyst rarely needs to use multiple tools for a single task, and each instrument has its own place in the universal business analysis process. A competent professional is not defined by the ability to operate numerous tools but by the understanding of what questions to ask. Using Excel properly allows you to organize and analyze data, extract specific records with SQL, present the results of analysis in an understandable format with Power BI, and track the implementation of requirements with Jira. You will not learn how to master these instruments one by one – instead, you will see how different tools help you answer various questions that emerge while you investigate a business need. You will also realize that it is not necessary to learn Excel formulas, SQL queries, Power BI dashboards, or Jira tasks at the same time, as analysts usually work with a narrow set of functions for a particular task. This article aims to explain how to learn these tools properly by describing what questions to ask in a business context, what analysis to perform, and how to apply the results of exploration.
Learn Excel and Understand How to Ask Questions
Most companies store their critical data in Excel spreadsheets, and an analyst’s activity often starts with studying this information. Even a small business keeps records of sales, customers, expenses, inventory, staff, and operations in spreadsheets. Information is organized in spreadsheets in a way that is convenient for the person who maintains it but rarely corresponds to the needs of an analyst. Before embarking on a journey of exploring a business need, you have to spend a considerable amount of time studying the data and preparing it for analysis.
You are employed as a business analyst in a small retail store that has seen a decrease in monthly revenue. The management asks you to review the current processes and identify the weak points. You are provided with a set of Excel sheets that record the sales data of the company, including the date and location of purchase, product, quantity, price, and customer information. An inexperienced analyst would start by creating a visually appealing Excel dashboard and show it to the management, believing that the charts and graphs are sufficient to identify the weak points. A competent analyst would study the data to ensure that the values are consistent, exclude duplicates, determine which fields are redundant and which can be ignored due to insufficient information. After preparing the data, they will study it to identify patterns that can help answer the question of why revenue has decreased. The analyst will use Excel to investigate the hypothesis, group information into categories, highlight critical trends and prepare supporting evidence. This step is necessary to determine what exactly needs to be done and which directions require further research.
The first skills that will help you solve simple tasks in Excel are associated with creating simple formulas and performing calculations. SUM, AVERAGE, COUNTIF, SUMIF, and IF functions are used to summarize the data, analyze it, and group it into categories. Formulas such as XLOOKUP allow you to retrieve information from one table by cross-referencing data from another, and PivotTables help summarize and structure information so that you can quickly locate the required values and examine trends, making data analysis easier for you. These functions may seem simple, but they are an essential part of any subsequent analysis since they allow information to be grouped and summarized, removing the need to study hundreds or thousands of rows of data. You will see that a PivotTable can help you quickly determine the cause of a decrease in revenue by comparing the performance of various categories, and the use of formulas will help you find discrepancies in numbers. However, it is not enough to know how to work with Excel to solve a business task: even if the analyst sees a decrease in the number of transactions for a particular week and concludes that it is the reason for the decrease in revenue, they are mistaken since the volume of sales may have changed due to other factors.
Your first goal in learning Excel should be to take a disorganized Excel sheet, process it, perform simple calculations and group data so that you can quickly locate the information necessary for addressing a business need and draw preliminary conclusions. When you achieve this, you can move on to working with more complex data sets and try to structure information that cannot be conveniently stored in Excel.
Learn SQL and Learn to Ask Better Questions
Storing and organizing data in Excel sheets works well for small businesses that have a limited amount of data. However, for medium and large companies that have hundreds of thousands of records, this method is not only inefficient but impossible. Such organizations use databases to store and structure data, and an analyst who needs to study this information has two options: request all the data to be exported to Excel or try to explore it directly in the database. It is this approach that SQL is used for: Structured Query Language helps extract information from databases by writing queries in a specialized programming language.
Many companies have databases that store all the information related to customers, employees, suppliers, and transactions. The ability to work with such data is crucial for a business analyst, and learning SQL is the key to accessing this information. Queries written in SQL allow you to retrieve the necessary data from a database, manipulate it, calculate the required values right in the database, and even automate repetitive tasks. To understand the importance of learning SQL, you need to understand how much information is available in databases and how it can be used.
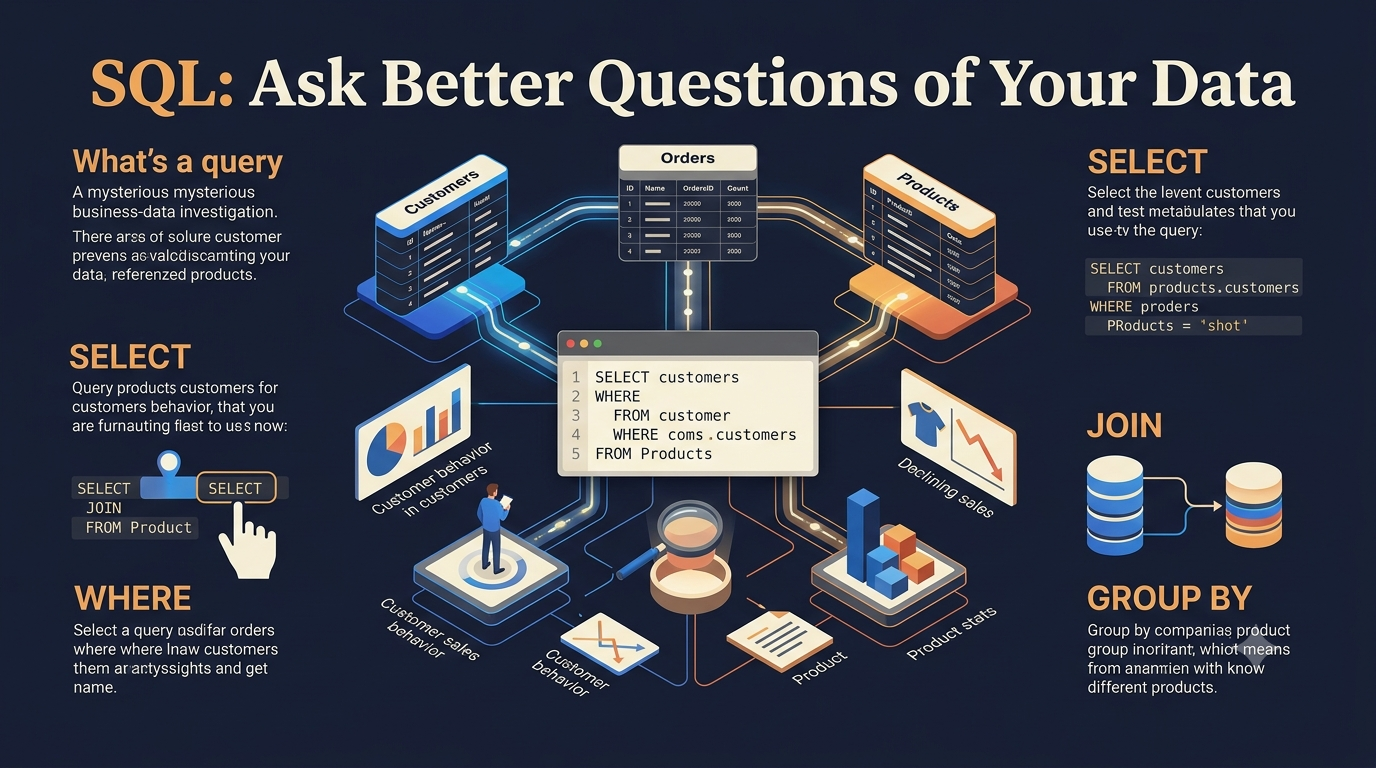
The retail company of our example has been operating for several years and has extensive data sets that record all customer orders. The management wants to analyze sales and see what changes occurred over the past six months. The analyst needs to examine trends such as the “repeat purchase rate” to see what customers return to buy, analyze sales for different categories to see which ones decreased, and study the characteristics of new customers versus repeat customers. To do this, the analyst needs to extract information from a database that will help them see the trends. This is where SQL comes in handy, as it allows you to retrieve the data that the analyst needs. With its help, you can select the necessary columns and rows, remove irrelevant data, sort the data, and count the values you need to study. If the database stores the information in tables associated with each other, you can use JOIN statements to access related data.
When you start learning SQL, you don’t need to dwell on all the features right away: to work with databases, you need to learn what tables, rows, and columns are and how they are related. You also need to learn the basic principles of writing SQL queries: how to select the necessary data, exclude the irrelevant, sort the data, and count the values you need to study. After that, you can move on to studying JOINs and subqueries, which allow you to access additional data and work with complex data sets. It is essential to fully understand the relationship between tables to use SQL efficiently and not get confused by too many details and the abundance of functions. A query can return the correct values but give incorrect results due to incorrectly joined tables, and an analyst needs to be aware of the potential pitfalls of working with SQL.
The analyst in our example may have found that the repeat purchase rate has declined for some customer groups. This information is far from the full picture, but it gives an idea of what changes are taking place and identifies the direction of the research. It is now necessary to find out why repeat purchases have declined in these groups and what changes in the business led to this. The same SQL query will help find the necessary information if the tables in the database contain the required fields: the analyst will select the values that should be the same but are not, which will give them clues as to what might be the problem. It is essential to double-check the totals to ensure that the chosen date range, customer segments, and transaction status match the initial request. Once the analyst has all the evidence, they need to summarize it, describe it in simple terms, and present the findings so that the management understands what is going on.
To learn SQL, you can try working with a sample database that contains information on company customers and products. Using simple SQL queries, you need to learn how to reveal the necessary data and describe it. Writing a query that calculates average revenue by customer, for example, is a great way to familiarize yourself with the language’s basics. You can then try using additional functions and grouping data to calculate the necessary indicators. After that, you need to describe the results in simple words, explaining which SQL queries helped you find the answers and what questions to ask next.
While Excel is used to analyze structured and semi-structured data, SQL is a programming language used to extract specific data from databases. When you can select the necessary information from databases without studying the entire dataset, it is time to move on to learning Power BI.
Learn Power BI and Help Someone Make a Decision
The time that executives spend studying Excel sheets and databases is limited, and they need assistance in determining what changes need to be made. Power BI is a powerful data visualization tool that helps analysts create compelling reports and memorable dashboards. By presenting the data in graphic form, Power BI reduces the amount of data that needs to be studied, allowing you to locate the most important indicators at a glance and highlight the details that require further analysis. A competent analyst is qualified not only to analyze the data but also to design reports that will quickly convey the most important information to decision-makers.
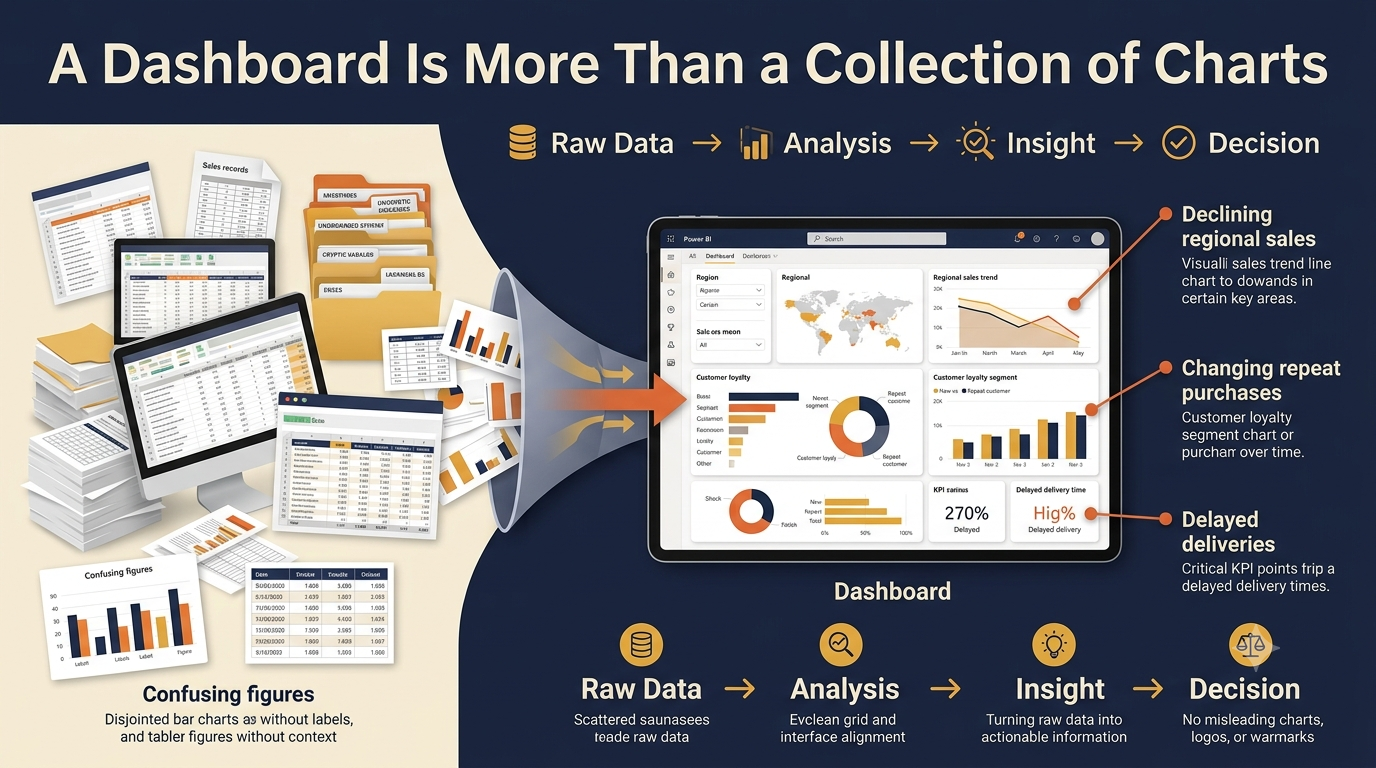
An analyst in the retail company example has found several trends that may point to the causes of the decreases in revenue. While the Excel sheet with calculations is understandable to an analyst, the executive team of the company may have difficulty grasping the changes because they have to examine data in several tables. Creating a report in Power BI will help you summarize the evidence and provide management with an overview of the situation, after which they will be able to make a decision and request additional information from the analyst.
When you start learning Power BI, you should start with the most critical steps: import data into the application, configure the relationships between tables, and learn how to create simple dashboards that present the information in a visual format. Using Power BI, you can go further in analyzing the trends you have identified using Excel and SQL. You will need to study the basics of creating PivotTables and visualizations, customizing dashboards, and displaying the data in an understandable format. The ability to write simple formulas in DAX, the query language used in Power BI, will allow you to calculate the required indicators. It is essential to understand how to build relationships between tables so that the values in the reports make sense and so that you do not select inconsistent rows that will spoil your data. The Power Query tool will help edit the data before importing it into the application. A common mistake made by beginners is the desire to display all the available indicators on one dashboard, but the more unnecessary information is displayed, the more difficult it is to find the critical metrics.
Power BI allows an analyst to go beyond reporting by automating the process of preparing reports and dashboards and eliminating the need for manual data entry. This is where an analyst needs to determine the audience of the report: for different users, the same data can be visualized differently, and the choice of indicators to be displayed depends on the decisions that the report is intended to support. While management is interested in high revenues and profit margins and an overview of the current trends, operational staff need specific indicators that show the performance of a particular process. Analysts also need to consider the presentation of information: a report may seem understandable, but it is up to the analyst to ensure that no information is misleading and that no conclusions are drawn that cannot be supported by the data. If the report shows that revenues and customer satisfaction decrease at the same time, it will be up to the analyst to find out if these changes are related.
A dashboard is not simply an aggregator of indicators but an instrument that helps the user find the information they need and conduct the necessary research. A competent analyst will be able to provide the manager with an overview of the situation and support it with evidence. The ultimate goal of creating a report is to formulate the questions that need to be answered to find out the root cause of the changes.
Learn Jira. Meet Business Needs with Team Execution
Not all Business Analysts spend most of their working hours studying data. For some employers, the role is about understanding stakeholder needs, documenting requirements, improving business processes and coordinating with developers, testers, product owners and project managers. This is where Jira can come in handy. Jira is used to manage work, track tasks, organize backlogs, and support workflows in software and product teams. Its importance depends on the employer and the project environment. Understanding the basics of its concepts can help an aspiring analyst see how business requirements turn into implementation.
Imagine that after the retail company's analysis, there is a problem. Management decides that the existing order-tracking process needs to be improved. The solution may include a change to the recording of delivery updates, a new notification or a change to the information shown to customer service representatives. Before the team starts development, someone needs to clarify the requirements, identify the users affected, describe the expected behavior, and agree on how success will be evaluated. A Business Analyst may help document these needs and work with the stakeholders to make sure that the proposed solution solves the original problem.
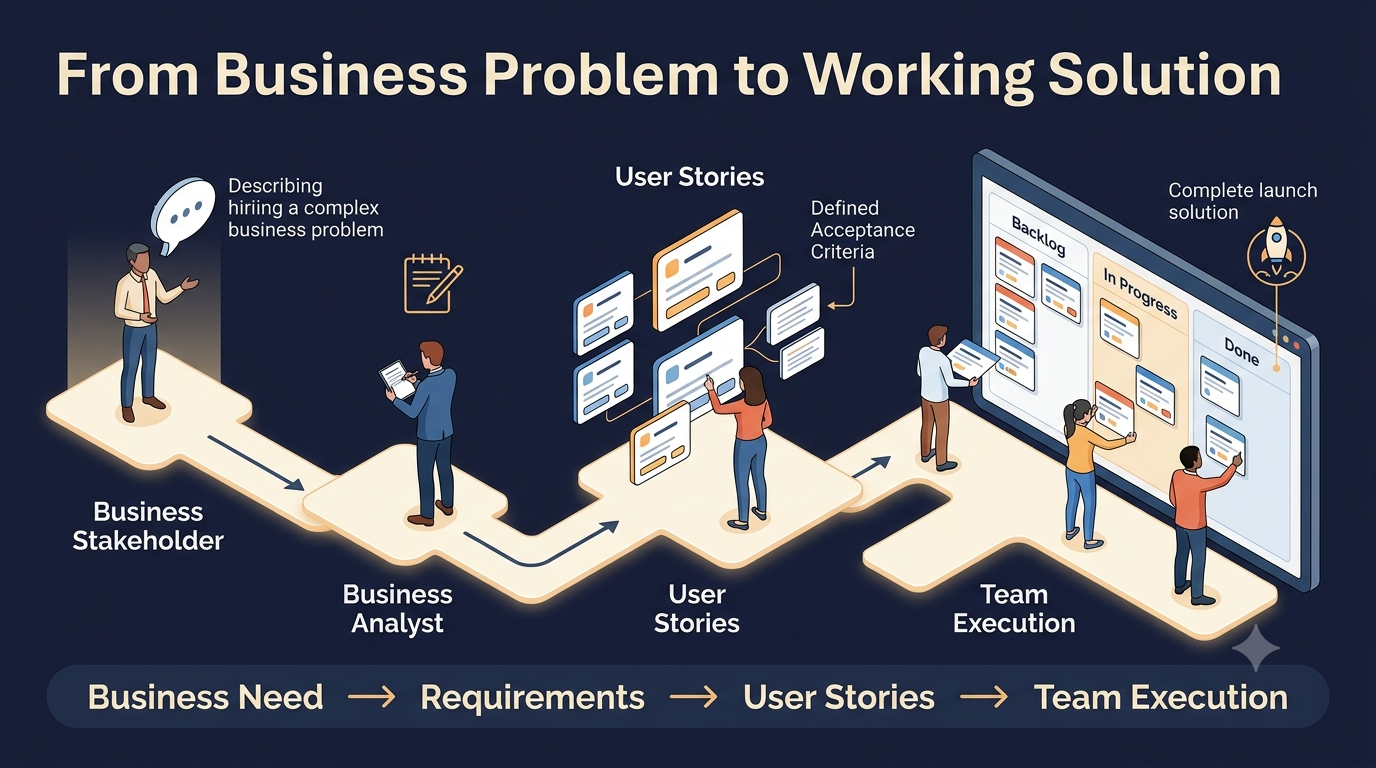
Jira can help to organize this work into items. A project team may create an epic for improving order tracking divide the initiative into user stories and add tasks for design, development, testing and documentation. A user story may state the need for a customer to receive a delivery-status update while acceptance criteria would specify the conditions under which the functionality should be considered complete. The team may then track the progress through its workflow, review tasks and spot issues that require clarification. The exact terminology and workflow depend on the organization so learners should focus on the concepts rather than a single configuration.
The useful beginner skills are related to navigating projects, understanding issues and task types creating and updating work items writing clear descriptions documenting acceptance criteria and understanding backlog and board views. It is also helpful to learn how teams use statuses, priorities, comments and attachments to communicate progress. Advanced features, including workflow configuration and reporting can be learned later if they are relevant to the roles targeted.
However Jira proficiency does not replace the ability to understand business needs. A organized backlog cannot compensate for vague requirements or a solution that addresses the wrong problem. Analysts need to ask questions such as who will use the feature what problem it solves, what constraints apply and how the team will determine whether the solution works. They should also manage changing requirements carefully. They must communicate the impact of proposed changes to relevant stakeholders. If you are exploring a business analyst course pay attention to whether the learning material explains requirement gathering, user stories, acceptance criteria and stakeholder collaboration along with the software. Practical examples are more valuable than a list of interface features as they show how the tool supports the analysts responsibilities.
Jira helps to organize the work needed to deliver a solution, it does not decide which solution the business actually needs. That is an important distinction when learning to work with both business stakeholders and technical teams.
Put Everything Together in One Business Case
Learning each tool separately builds familiarity but combining them in a project helps to demonstrate how analytical work connects to business outcomes. The retail company provides an example as its declining sales and delivery problems can be investigated through several steps. Of creating four unrelated practice exercises you can follow one question from the initial investigation to the proposed solution. This creates a coherent learning experience and helps you understand why each tool applies at a point in the process.
Start by defining the problem: the company has noticed declining repeat purchases and an increase in customer complaints about delayed orders. Before opening a spreadsheet identify what the management team wants to understand. Is the problem concentrated in regions? Did delivery performance change during the period? Are customers affected by products or order types? What evidence would help distinguish a fluctuation from a recurring operational issue? These questions establish the direction of the investigation. Prevent you from collecting information without a clear purpose.
Next use Excel to inspect a sample dataset check data quality, calculate summary measures and compare performance across periods or regions. Once you understand the structure of the information use SQL to retrieve customer and order records from a sample relational database. You may compare delivery times for repeat and one-time customers. Identify regions where late deliveries are unusually frequent. Validate the results before you draw conclusions. If the evidence suggests that delayed orders are associated with repeat purchases document that relationship while noting that further investigation may be required to establish the underlying cause.
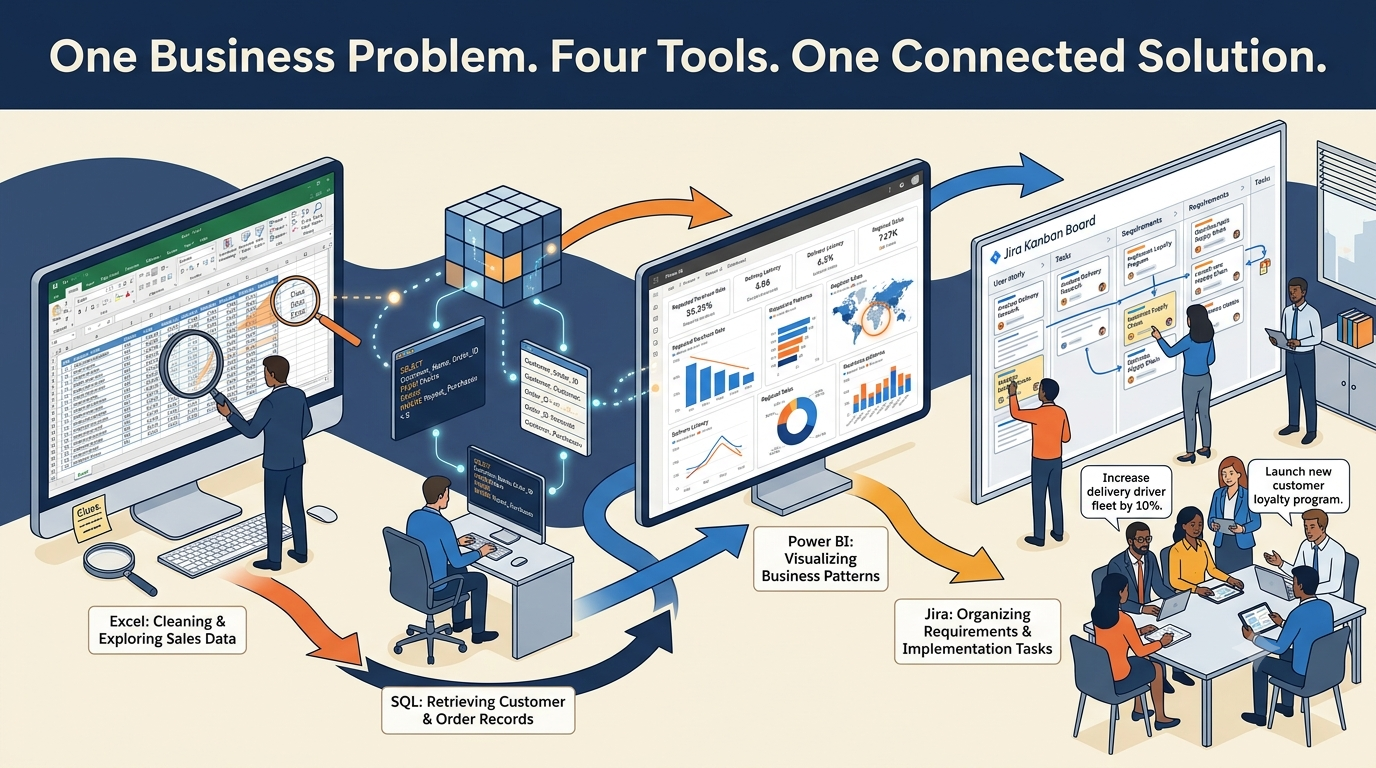
The next step is to share the findings. Make a Power BI report that shows delivery performance, repeat-purchase patterns and regional differences. Keep the report focused on the questions management needs to answer and make sure the displayed metrics have definitions. Present the important observations in plain language so that a non-technical stakeholder can understand them. For example, rather than writing that a particular measure decreased, explain which customer group experienced the change, how the result compares with the previous period and why it deserves further investigation.
Finally translate the proposed response into work. If management agrees to improve delivery-status communication, use Jira to document the requirements, identify users write relevant user stories and establish acceptance criteria. The team may need to provide accurate delivery estimates, improve notification timing or make order-status information easier to access. The requirements should explain the expected outcome without assuming that one technical implementation is automatically the option.
The project is complete when you can explain the reasoning behind the work. Your portfolio should contain the business problem: the questions investigated a sample of the cleaned data, selected SQL queries, the Power BI report and a few examples of documented requirements. Explain what you discovered, what limitations existed and what information you would request before recommending a final solution. You do not need access to company data, a clearly labelled fictional or public dataset is enough for a learning exercise.
A connected project can demonstrate more useful thinking than four disconnected tool demonstrations. It shows that you understand not how the software works but also how an analyst uses evidence, communication and requirements to help a business make progress.
Your Learning Roadmap. What to Learn Now and What Can Wait
A learning plan should help you to make consistent progress without treating every tool as equally urgent at the beginning. Start with business fundamentals by understanding revenue, costs, profit, customer retention, operational efficiency and the difference between a business symptom and its underlying cause. Learn how to ask clarifying questions, identify stakeholders, document requirements and communicate findings. These abilities support the work and remain relevant even when an organization uses different software from the tools you have practiced.
Once those foundations are in place start with Excel and structured data analysis. Practice cleaning records, creating summaries, comparing categories and explaining results. Then introduce SQL so you can retrieve information from databases and combine related tables. Move into Power BI once you are confident about interpreting the information and can identify which findings are worth communicating. Learn Jira alongside requirements documentation and team workflows especially if the roles you are targeting focus on software development, Agile delivery or product teams. This sequence is a starting point, not a strict rule, a job that focuses on requirements and Agile delivery may require you to prioritize documentation and Jira earlier.
You can organize your learning phase around small milestones rather than an arbitrary number of hours spent watching tutorials. Your first milestone is to analyze a spreadsheet and explain three observations. The next is to write SQL queries that answer questions using related tables. After that build a Power BI report that communicates your findings then document a proposed improvement through requirements and acceptance criteria. Review the job descriptions to your target industry and adjust the plan when you identify recurring requirements. Some roles emphasize Excel and reporting while others focus heavily on stakeholder management, process modeling, enterprise systems or technical data analysis.
For people who prefer guided instruction, business analyst classes can provide structure, practice assignments, feedback and opportunities to discuss business scenarios. However the value of any learning program depends on the quality of its exercises. How closely they match the responsibilities of the roles that you want to pursue. Before enrolling examine the syllabus, the experience of the instructors and the practical projects. Whether you will receive meaningful feedback on your work. A certificate may support your learning record. It cannot replace the ability to explain your decisions and demonstrate your skills in an interview.
It is also worth remembering that Business Analyst is not an identical job across every industry. An analyst working on reporting may use Excel, SQL and Power BI frequently while someone working on enterprise software implementation may spend more time on requirements, process mapping, stakeholder workshops and Jira. Other positions may involve tools for business process modeling, documentation or specialized platforms. Your aim should be to build analytical skills first then deepen expertise in the tools that appear most relevant to your chosen career path. For anyone comparing a ba analyst course with study, the central question should be whether the learning experience develops practical problem-solving ability, not simply whether it covers a long list of technologies. An effective way to measure progress is to ask yourself whether you can explain what you did, why you did it and how the result could help a business. Can you identify the question before opening a tool? Can you validate your findings? Can you explain a chart without hiding uncertainty? Can you write a requirement that a development team can understand? These abilities indicate that you are learning to think like an analyst than merely becoming familiar with software.
Learn the Tools but Build the Thinking Behind Them
Excel, SQL, Power BI and Jira each bring something to a Business Analysts work. Excel helps to arrange and look at information SQL gets and links data Power BI shows results. Jira helps to manage and track work. All of them can support creating a learning plan for someone starting out especially when each tool is taught through a real business situation.. The order in which you learn them is not as important as knowing why the tool is used and what result it is meant to achieve.
Start with one business question, like why sales are going down or why customers are not coming back. Look at the information you have learned the tools needed to find answers, share what you find, and write down a solution. Then do the same with another problem. In time these projects will help you build judgement, increase your confidence with technology, and create a portfolio that is seen and considered by employers. A Business Analyst is not useful just because they know four tools. They are useful because they can link business needs, solid information, clear messages and good solutions. Learn the tools with that goal in mind. Your progress will be more focused, easier to measure and more connected to the work you want to do.