
Exploring Tableau Public: Core Features, Key Strengths, and Boundaries
Last updated on Sep 30, 2026
The visualisation of data has gone from a technical speciality to a universal language for business intelligence, citizen engagement, journalism and scientific communication. In this landscape, Tableau has long been an industry-standard benchmark of analytical depth, intuitive visual encodings and interactive storytelling. But professional enterprise business intelligence platforms tend to carry high license fees, complicated server administration overhead, and limited user access.
Tableau announced Tableau Public, a completely free, cloud-hosted tier to democratise the exploration and presentation of data, bridging the gap between enterprise analytics and public data literacy. Since its inception, Tableau Public has become a vibrant global repository of visual insight, with millions of dashboards created by students, independent researchers, data journalists and career analysts.
Anyone who is a professional or hobbyist looking at modern business intelligence tools should know what Tableau Public is, what its strengths are, and what its architectural limitations are. You get the full picture of its structural anatomy, standout features, core career and community benefits, and non-negotiable limitations.
Tableau Public: Genesis and Architectural Philosophy
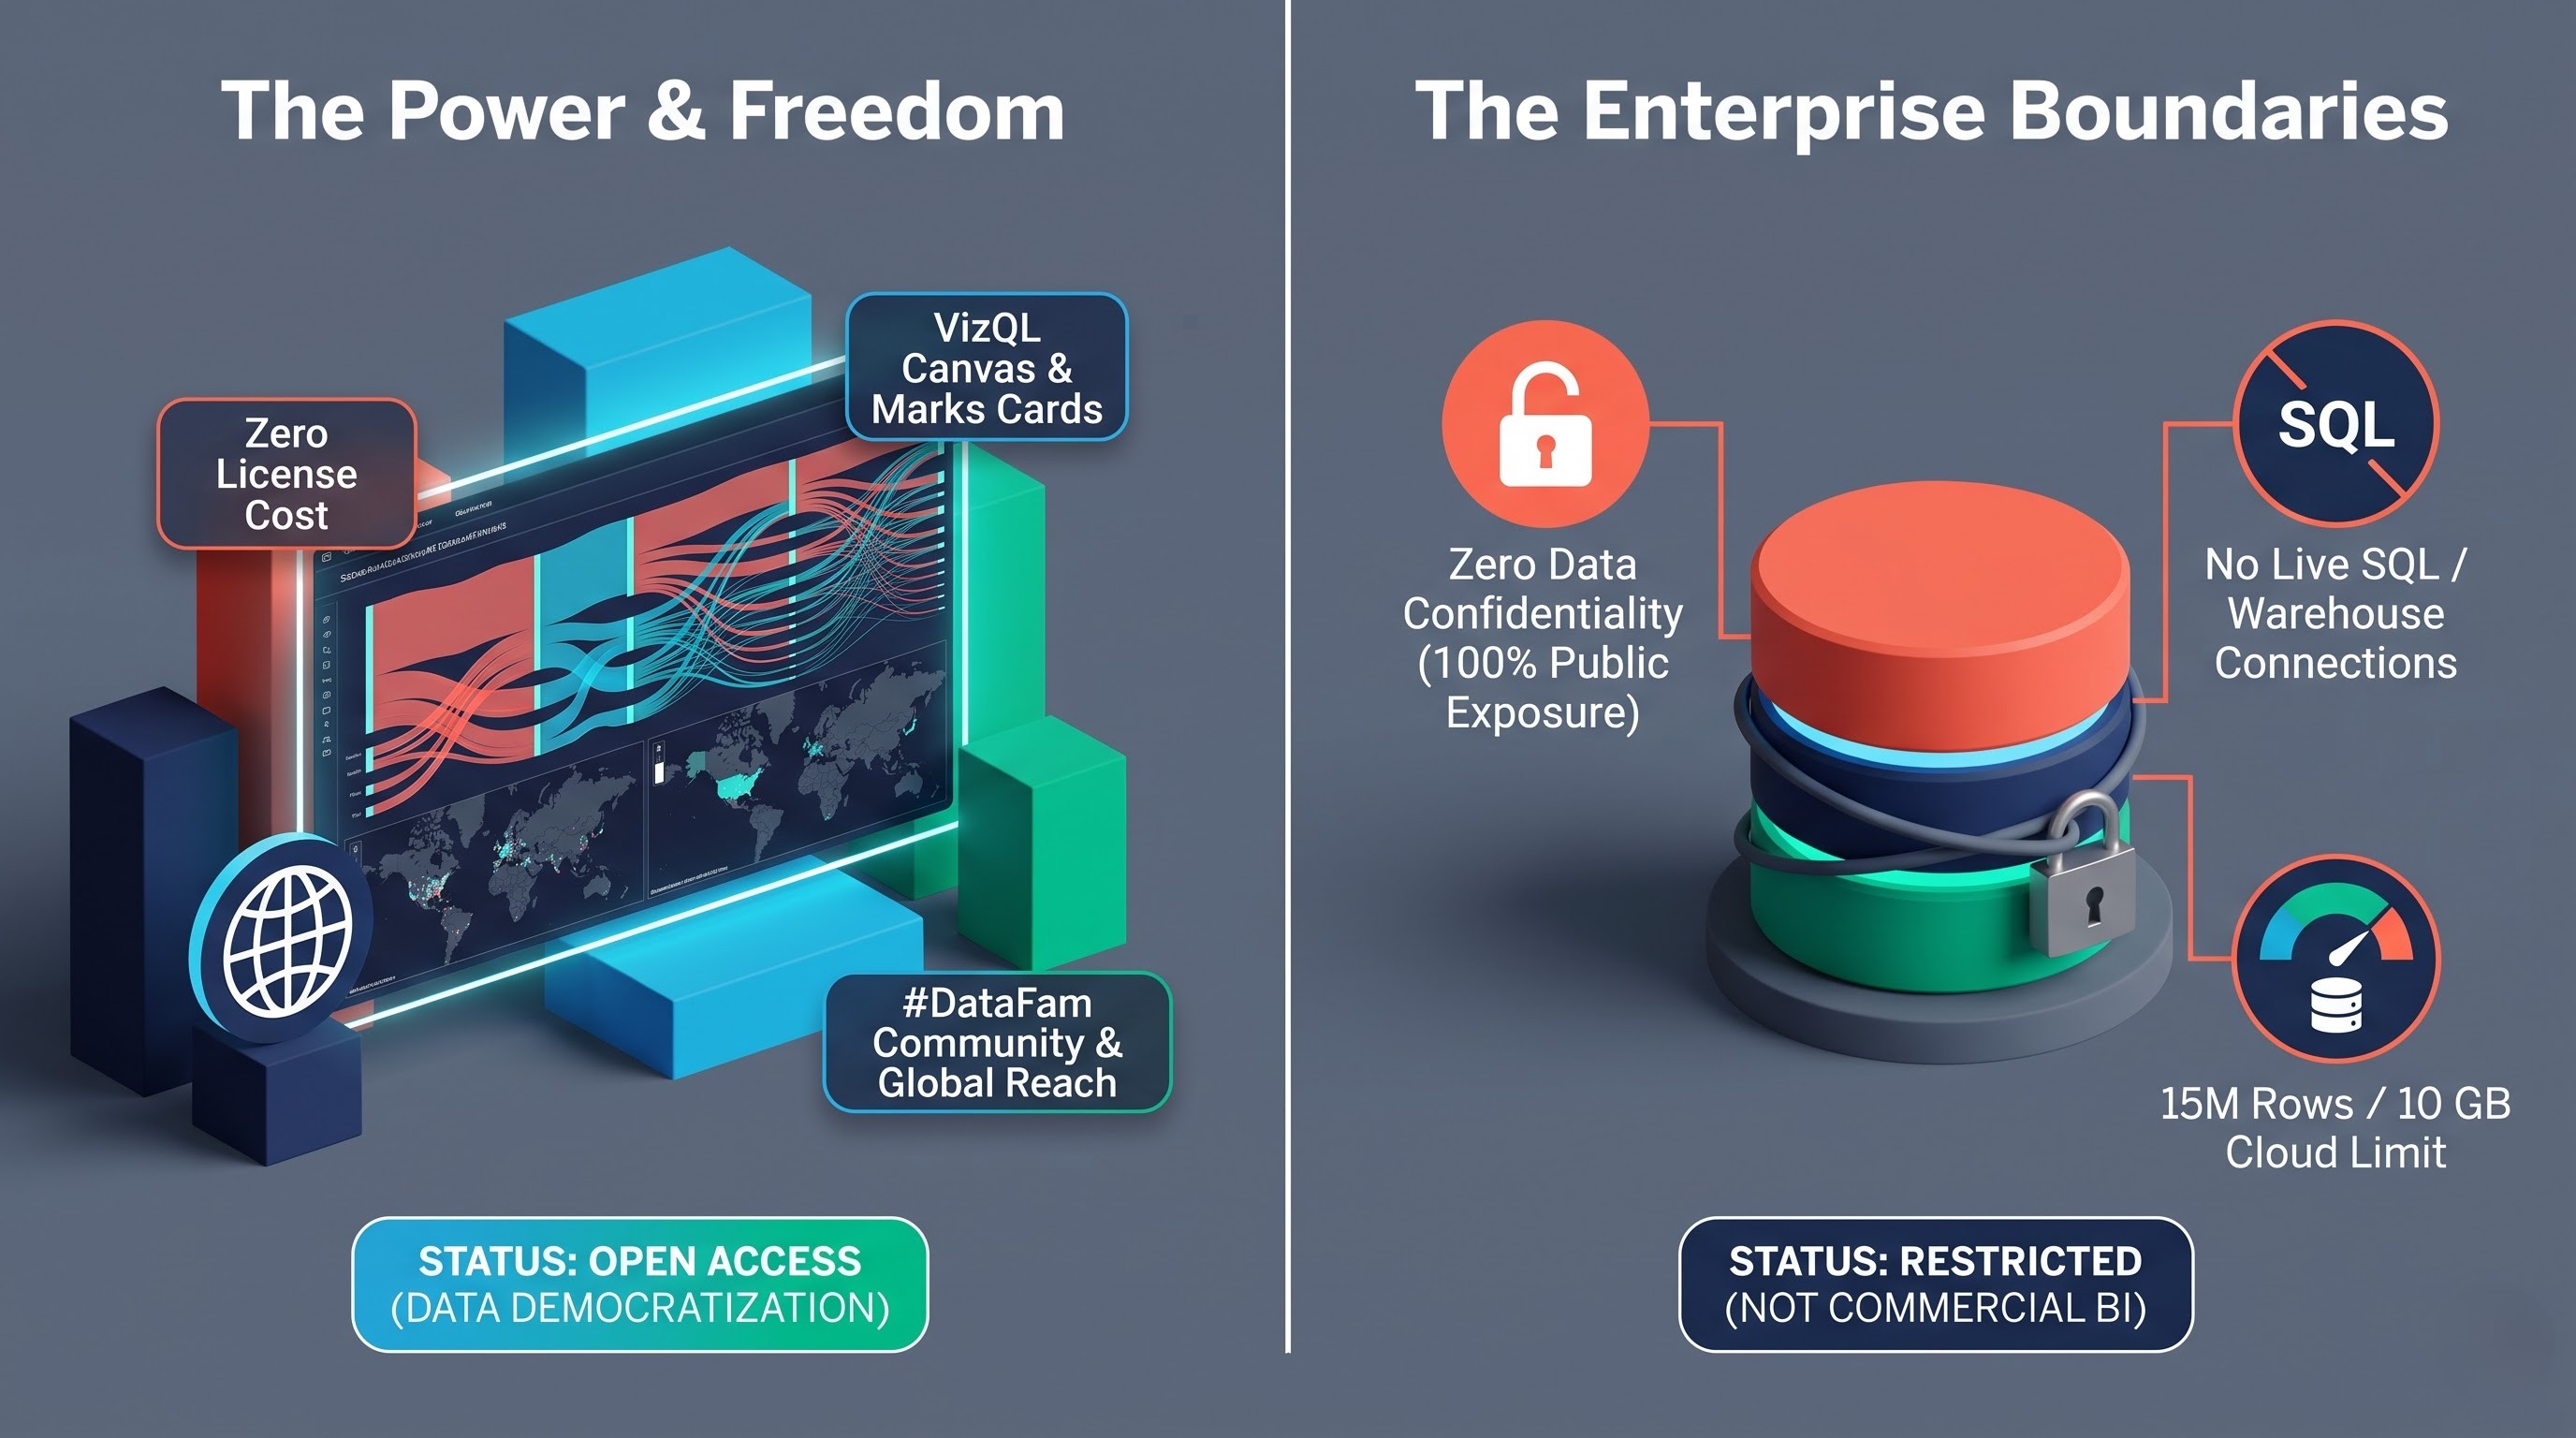
Tableau originated from research done at Stanford University by Chris Stolte, Pat Hanrahan, and Christian Chabot. Their breakthrough innovation was VizQL (Visual Query Language), a proprietary technology that translated drag-and-drop user actions directly into relational database queries, while simultaneously rendering the results as visual marks.
Enterprise editions were meant for corporate silos, but Tableau Public was founded on a different premise entirely: radical openness. The architecture of Tableau Public has two main levels:
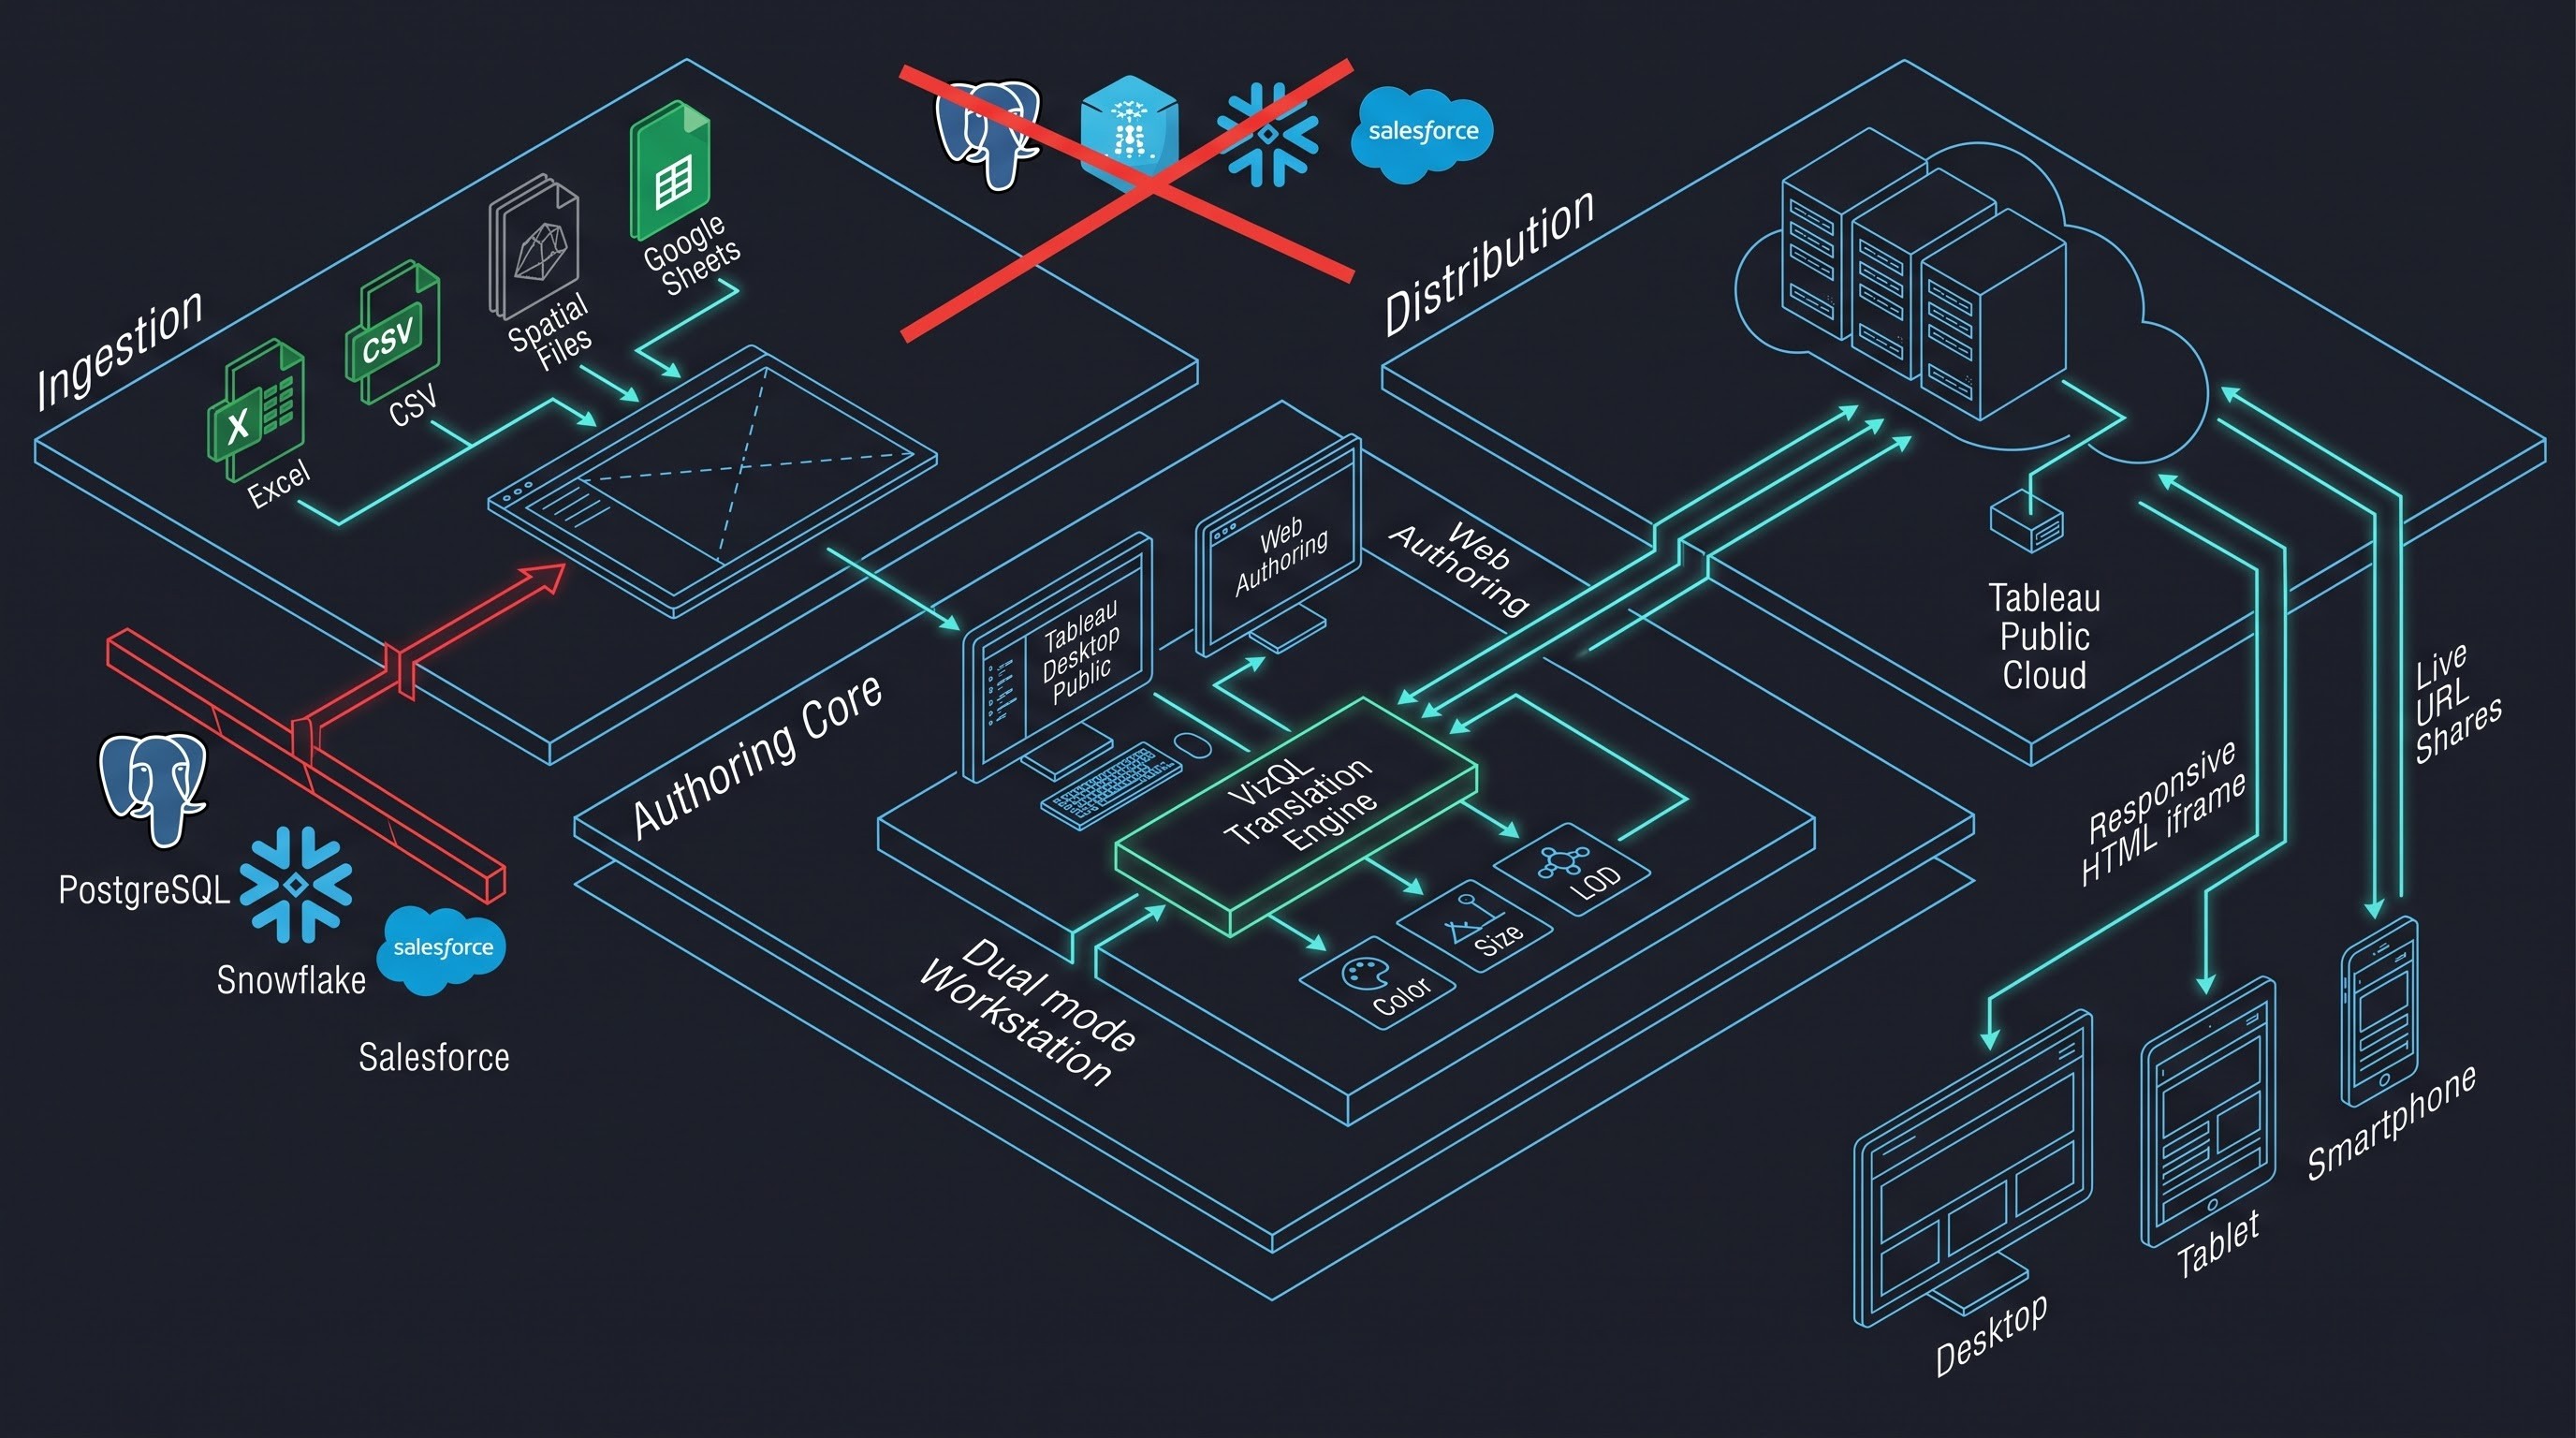
The Authoring Layer: A downloadable local desktop application (Tableau Desktop Public Edition) or a native, browser-based web authoring environment.
Tableau Online Multi-tenant, globally distributed web repository that renders, hosts, indexes, and presents completed workbooks to the public. Managed by Salesforce and Tableau.
The business and operational model is simple: offer high-end visual design capabilities to everyone for free, in exchange for all published work being public and accessible to anyone on the internet. This model makes Tableau Public a data talent incubator and a public utility for open data projects, non-profit campaigns, academic portfolios and visual journalism.
Key Features of Tableau Public
Tableau Public is available for free, but it has a lot of the same visual design and analytical engine as its paid counterpart, Tableau Desktop. It doesn't paralyse the basic mechanics of chart design or analytical logic.
VizQL Canvas and Marks Cards
The Marks Card sits in the middle of the authoring interface and is used with the Rows, Columns, and Pages shelves. Authors are not simply choosing from pre-designed chart templates; they are creating charts from scratch. Mapping measures and dimensions to visual channels such as colour, size, shape, detail, tooltip, and label can empower creators to build:
Standard visual representations are bar charts, line graphs, scatter plots, treemaps and area graphs.
Custom complex charts like Sankey diagrams, radial bar charts, gauge meters, violin plots and waffle charts built using calculated coordinates and trigonometry.
Dual-axis and stacked visualisations that combine different chart types on synchronised axs to show trends over time.
Analytical Logic and Calculated Fields
Tableau Public has an extensive calculation library that is identical to the desktop engine for the enterprise:
Basic calculations String manipulations Mathematical functions Type conversions Conditional branching statements
Level of Detail (LOD) Expressions: Complex analytical calculations, including fixed, include, and exclude expressions. This allows the author to compute aggregations at different levels of granularity than the current view in the visualisation without re-shaping the underlying data set.
Table Calculations: Calculations performed completely within the front-end display pipeline, such as running totals, moving averages, rank, percentile distributions, and period-over-period differences
Sets & Parameter Controls: Dynamic user controls that allow viewers to toggle measures, adjust numeric thresholds, change reference dates, or drill down subsets of cohorts on the fly.
Integrated Mapping & Geospatial Capabilities
Tableau Public uses a built-in background map server from Mapbox and OpenStreetMap. The geospatial engine does:
Automatic geocoding of standard administrative units including country, state, province, zip code, metropolitan area and county boundaries.
Native support for spatial files, parsing formats like Shapefiles, GeoJSON, KML, TopoJSON.
Spatial functions to calculate distance as the crow flies, buffer zones around points, and spatial intersections between layers with complex geometry.
Multi-layered maps that allow authors to overlay polygon territory regions, point locations and density heatmaps onto a single interactive canvas.
Interactive Dashboarding & Story Points
To communicate data you need to organise insights into coherent workflows:
Dashboards are flexible layout containers (tiled and floating) that aggregate multiple worksheets into a single view. They are interactive URL actions, parameter actions, set actions and hover or click filter actions.
Stories: A narrative presentation format that enables sequential storytelling across step-by-step frames or narrative points, with descriptive text commentary.
Device Designer: A dedicated authoring view that allows authors to customize the dashboard layout differently for desktop monitors, tablets and mobile smartphones to ensure a visually clear view on any size screen.
Web Authoring and Editing in the Cloud
Previously authors needed to install the software on a desktop to use it, but with modern Tableau Public authors can do everything end-to-end inside a modern web browser. No desktop software to install. Just log in, connect to supported cloud storage sheets, build worksheets, draft calculations, and publish dashboards.
Embedding & distribution on the web
All visualisations published to the Tableau Public cloud generate embeddable HTML snippets that are responsive and shareable links. This enables publishers to embed interactive charts into WordPress blogs, online news articles, institutional websites and portfolio pages. Dashboards can be dynamically sized to fill the container of the host page.
Top benefits of Tableau Public
Tableau Public is widely used because it provides real benefits to people, educational institutions, non-profits and communities around the world.
Zero Financial Entry Barrier
Professional business intelligence tools can cost hundreds or even thousands of dollars per user each year. Consequently, they are not affordable for students, entry-level job seekers, and non-profit organisations. Tableau Public has completely solved this problem and enables the masses to gain knowledge on data. Being empowered by a self-learning tool makes a person equally knowledgeable as any employee at a large company. The application of a structured tableau course online can speed up the development of one’s skills and aid in receiving proper education even without huge sums of money.
The Ultimate Portfolio Engine for Career Mobility
In the current scenario of data analytics, employers require candidates who are capable of taking action rather than just listing achievements on their CVs. A well-maintained Tableau Public profile serves as a proof of skills learned during extensive education in tableau developer training:
Evidence of Technical Skills: Your public profile shows hands-on mastery of data scrubbing, complex computations, visual hierarchy, dashboard ergonomics, and business storytelling.
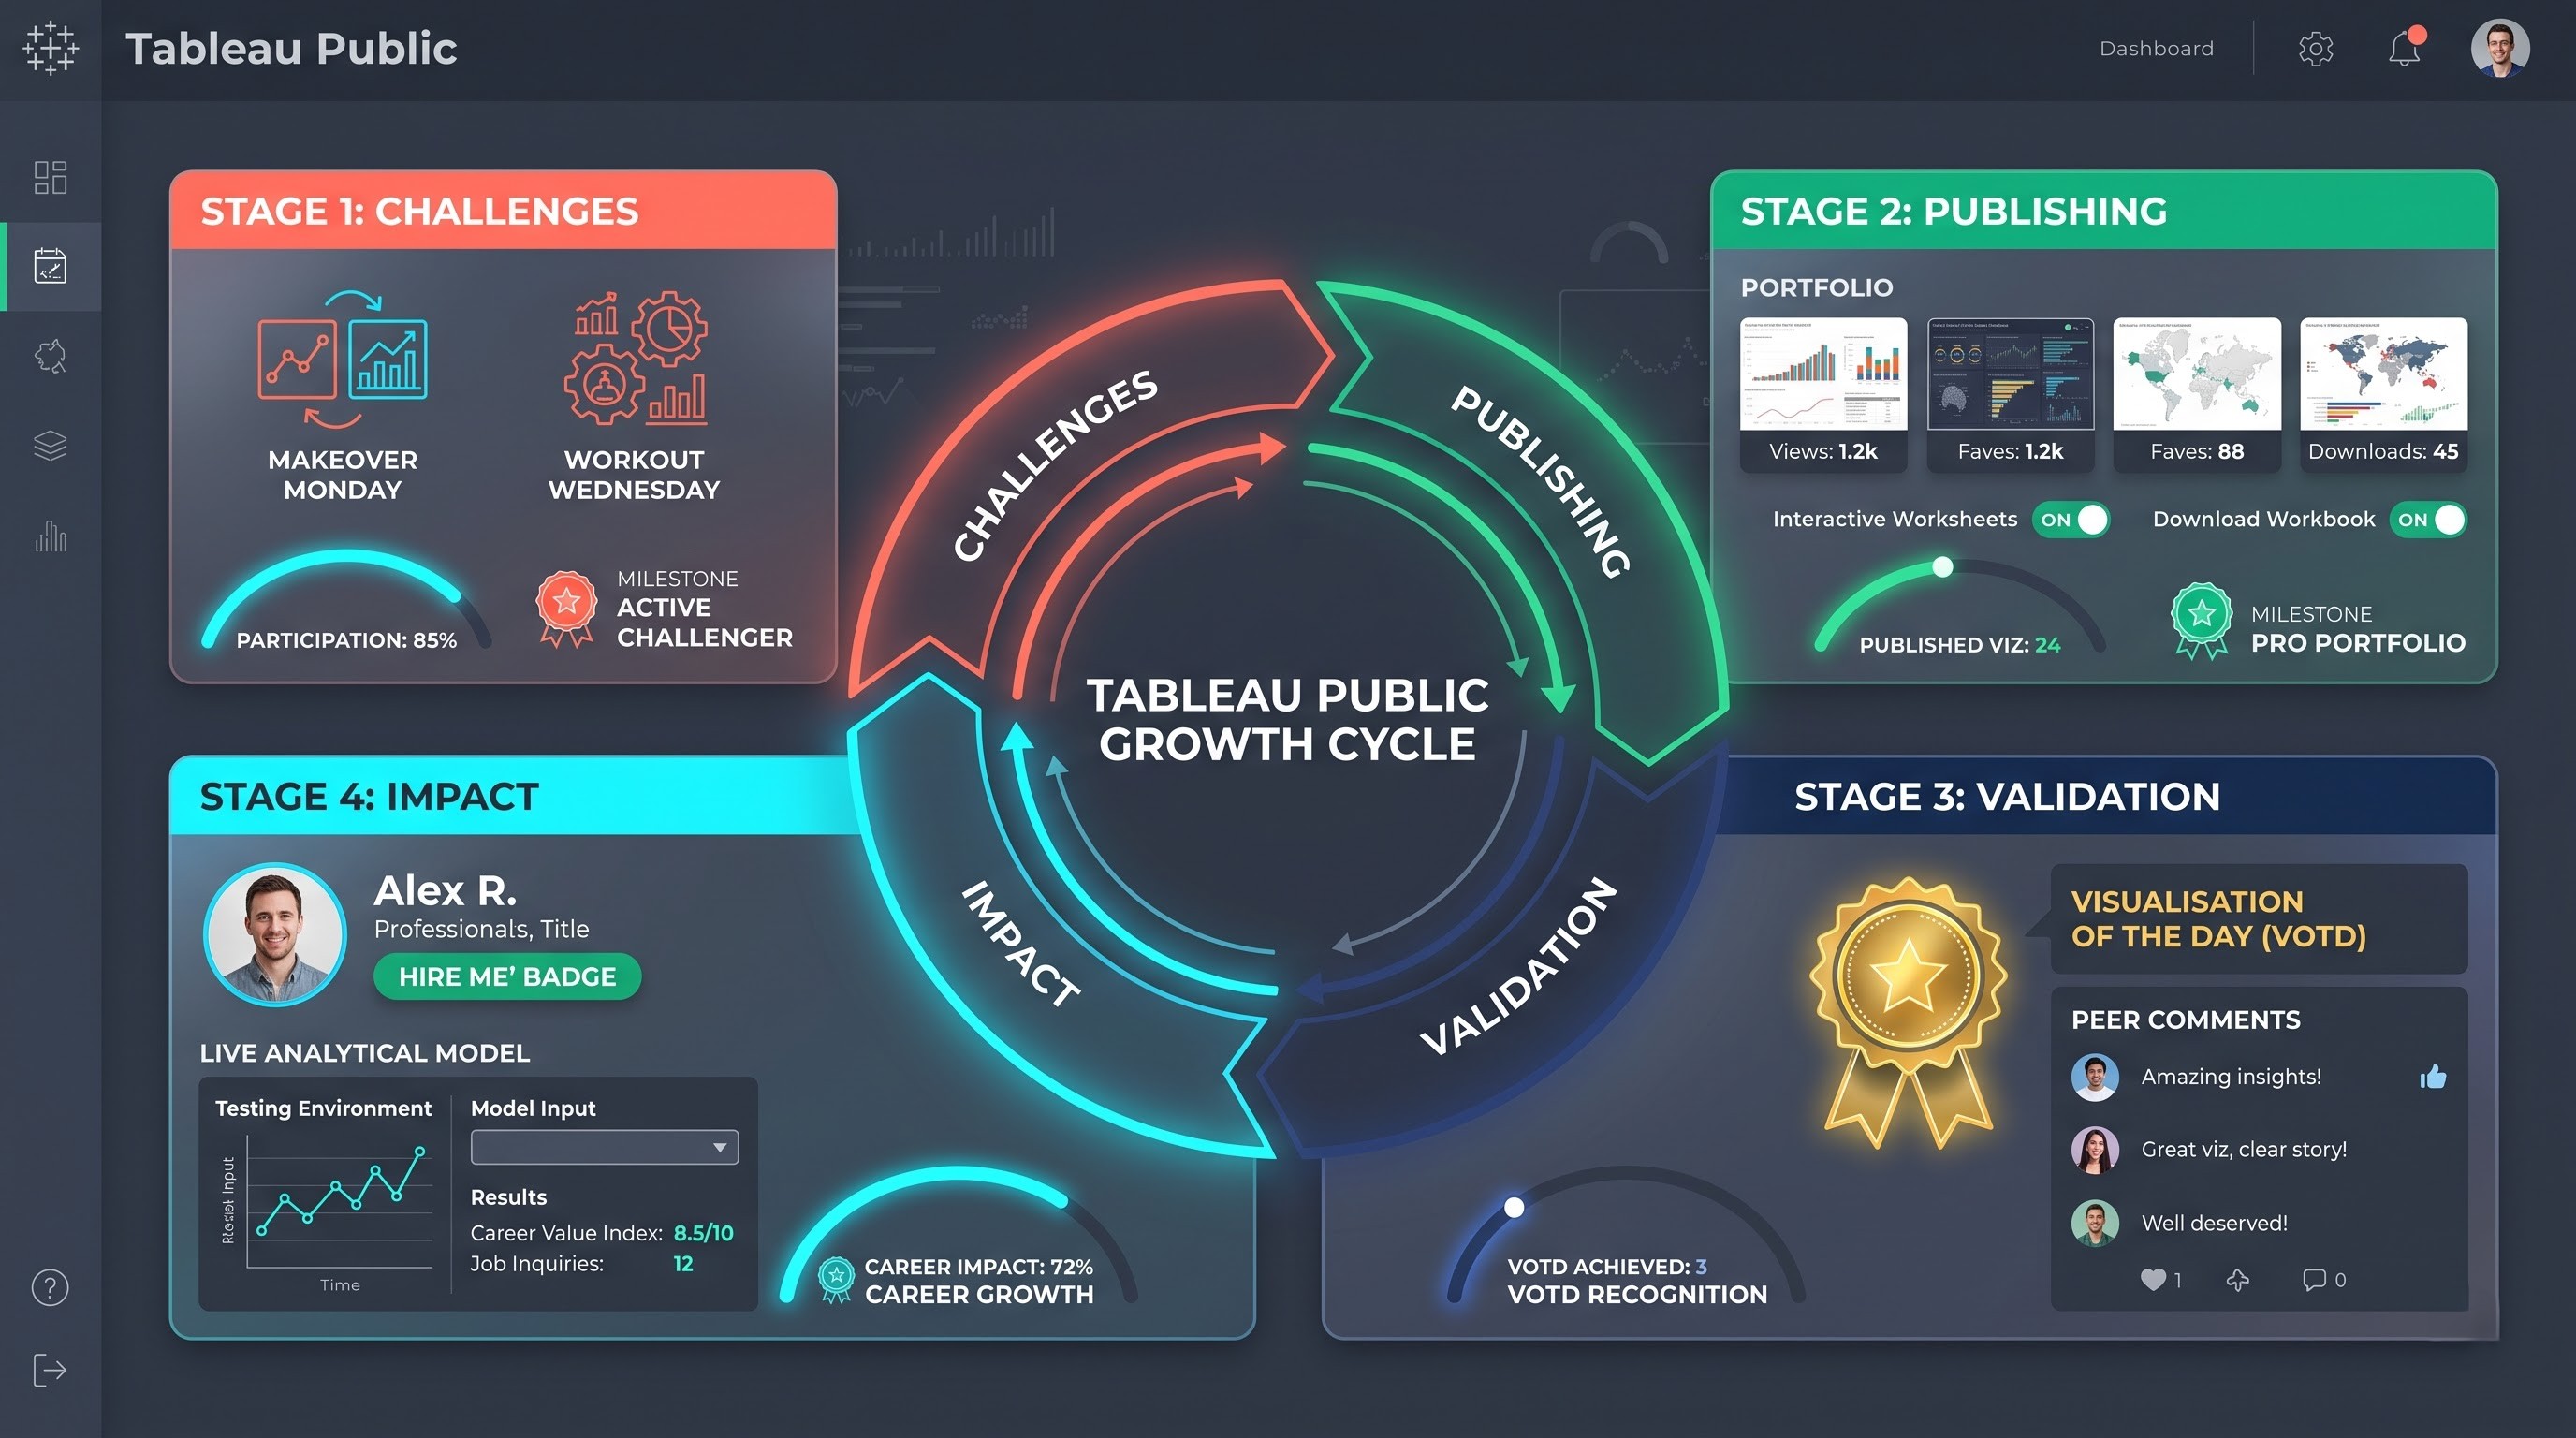
The “Hire Me” Badge Profiles can include contact links and a distinctive hiring badge that signals availability to recruiters, consultants and hiring directors searching the community registry for proven talent.
Resume Hyperlinking: Candidates can now link their live dashboards in applications so interviewers can interact with live models instead of static PDF screenshots.
The World’s Largest Collaborative Learning Hub
The Tableau Public community, also known as the #DataFam, is a lively global learning network. This community offers educational opportunities through the sharing of public work:
Open Workbook Architecture: Authors have the option to let viewers download their underlying workbooks. Learners can explore complex visualisations, dig into the formulas behind new calculations, and reverse-engineer creative layouts.
Structured Community Projects: We have ongoing community projects such as Makeover Monday, Workout Wednesday, Sports Viz Sunday, and Iron Quest that provide weekly clean data and visual design briefs. Participants create solutions, post their work and receive constructive critique from veteran Zen Masters and Tableau Visionaries.
VOTD (Visualisation of the Day): Every day, Tableau’s community team picks out one visualisation that is a standout example of data journalism, artistic design and analytical brilliance, and shares it to inspire other authors.
Dependable Public Cloud Infrastructure
Publishing interactive dashboards on the web usually requires dedicated cloud hosting, database servers, load balancers, and security monitoring. Tableau Public abstracts all of this away If a user publishes a dashboard that goes viral on the news or social media, the cloud infrastructure in Tableau Public scales to handle hundreds of thousands of concurrent hits without incurring hosting bills or crashing the servers.
Boosting Civic Tech and Data Journalism
Newsrooms, non-governmental organisations and municipal authorities often work with limited technology budgets. Using Tableau Public, journalists and researchers can publish interactive trackers on public health, demographic migrations, environmental changes and election trends. Passive consumption is turned into personal discovery as viewers can filter the data down to their own neighbourhood.
Key Limitations and Architectural Tradeoffs
Tableau Public is powerful, but has been deliberately limited to stop commercial companies from using it as a substitute for paid licenses. For organisations and analysts looking at the platform, it is important to understand these structural boundaries.
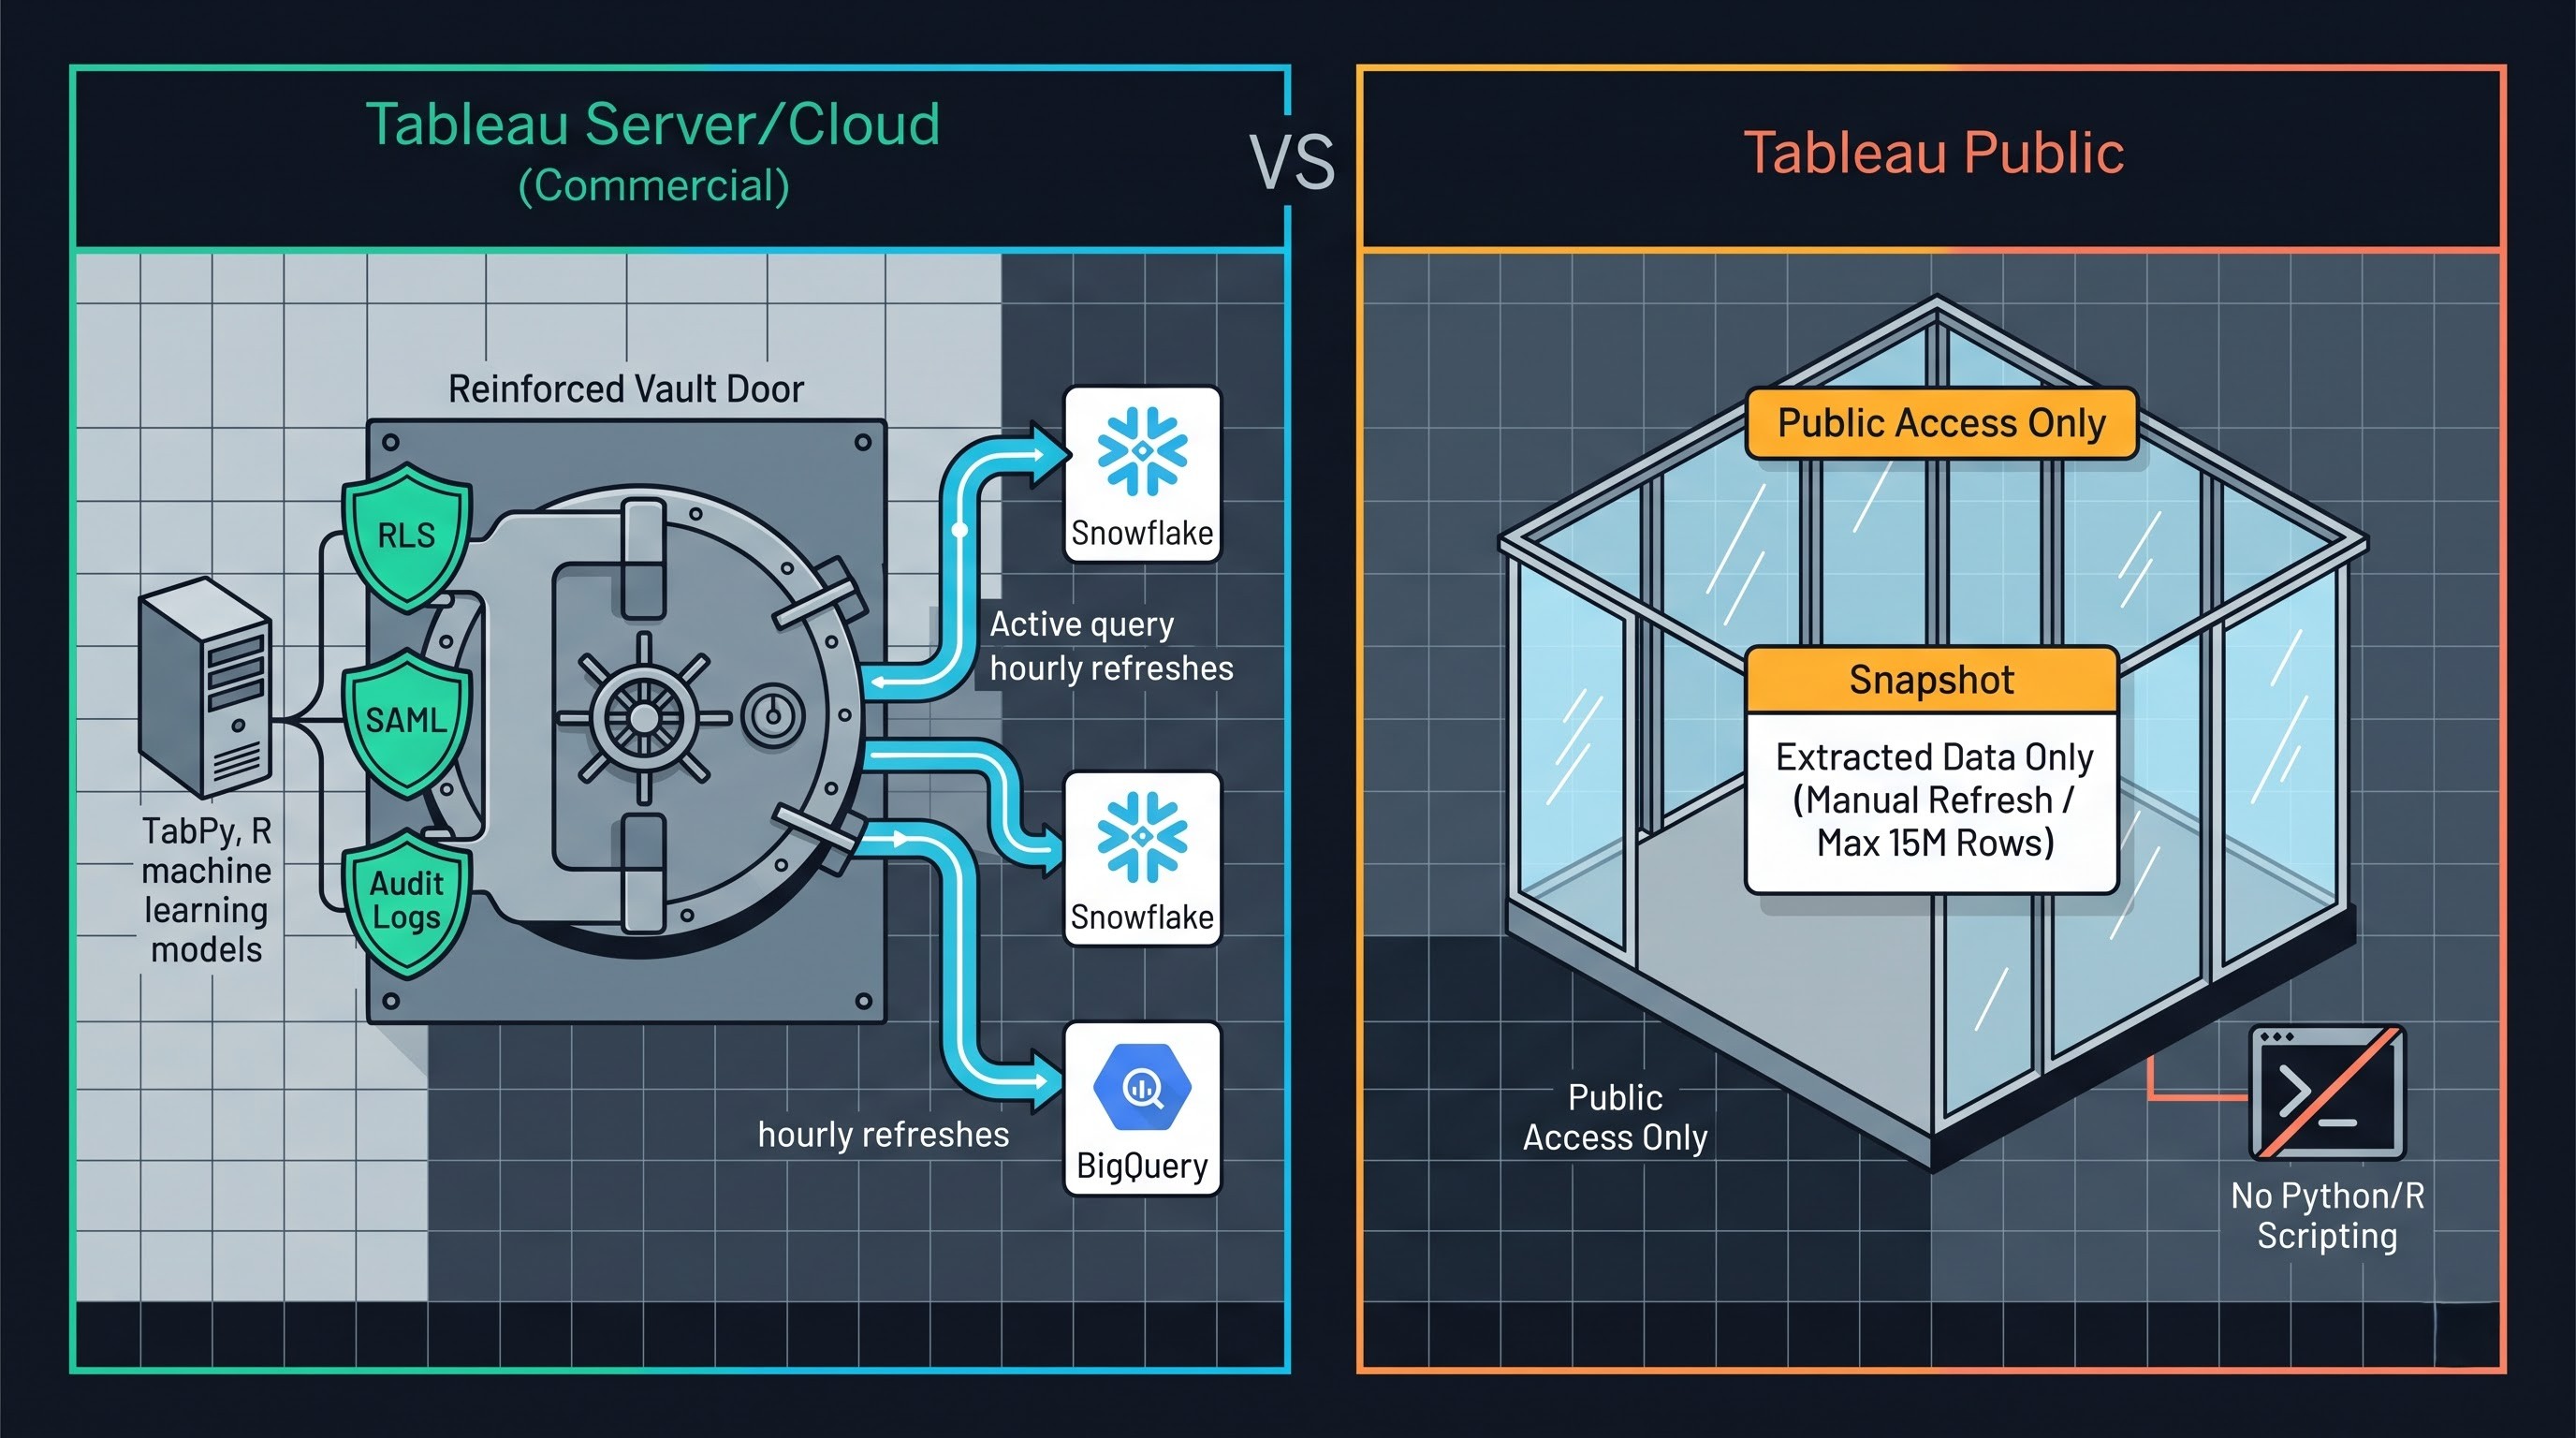
Total lack of data confidentiality
The main problem is privacy: nothing on Tableau Public is secure, encrypted or private.
Every published workbook and its corresponding data extract are on an open cloud server.
Authors can turn on an option to hide a visualisation from their profile gallery, but it can still be accessed by anyone who has or guesses the direct URL.
If workbook downloading is turned on, anyone can download the packaged workbook and extract all of the underlying rows of raw data.
This would expose sensitive assets to the open web, and it is a violation of standard data governance regulations to post corporate financials, client records, health metrics, proprietary algorithms, or Personally Identifiable Information (PII) to Tableau Public.
Limited Data Connectors
Tableau’s commercial products offer dozens of native enterprise connectors for cloud data warehouses, relational databases, big data platforms and enterprise applications. Tableau Public gets rid of almost all of them.
Supported Sources Flat files including Microsoft Excel .xlsx, CSV, text files .txt, JSON, PDF documents, spatial files .shp, .kml, statistical files (SPSS, SAS, R) and Google Sheets.
Unsupported Sources: You can’t connect directly to SQL databases (PostgreSQL, MySQL, Microsoft SQL Server, Oracle), cloud data warehouses (Snowflake, Google BigQuery, Amazon Redshift, Databricks) or SaaS platforms (Salesforce, HubSpot, SAP).
No Live Database Connections: Tableau Public can't maintain an active, live connection to any production database; all workbooks have to run off an extracted, static snapshot of data.
No Automated Scheduling and Data Refreshes
Dashboards in an enterprise analytics deployment refresh on scheduled background intervals (e.g., hourly, daily, or at the end of an ETL job). Data Pipeline Orchestration Tableau Public does not provide:
If the analysis is based on a local spreadsheet or text file, the author must open the project, manually replace or append the new records, refresh the extract, and re-publish the workbook to the web.
Google Sheets is a partial exception, which can be set up to sync once every twenty four hours through Tableau Public's cloud environment. But real-time streaming, intra-day refreshes, and database-triggered webhooks are completely unsupported.
Hard Data Storage and Volume Limits
Enterprise deployments regularly query hundreds of millions of transaction records from distributed clusters. Tableau Public has strict limits on capacity:
Row Limit: Workbooks are limited to a maximum of 15 million rows per extract of a dataset.
Storage Limit: Each individual account is limited to a total cloud storage of ten gigabytes (10 GB) for all published workbooks.
Trying to load raw event-level clickstream data, high-frequency IoT sensor metrics, or long-term transaction archives will quickly break these boundaries, and the extract creation will fail.
Unable to Save Files Locally
One of the most common workflows in enterprise software is to save a file locally (.twb or.twbx) to a hard drive or a shared corporate network drive.
Tableau Desktop Public Edition does not allow local saves at all. The author authenticates with a Tableau Public cloud account and uploads the assets to the web by choosing the save command.
If an analyst has an incomplete draft, experimental prototype, or file with sensitive local notes, it cannot stay on their local drive without being pushed to the public cloud infrastructure.
No Advanced Scripting Integration / External Services
Enterprise Tableau supports analytical extensions which allow custom R and Python (TabPy) scripts to run dynamically at visualisation render time. This enables teams to run live machine learning algorithms, natural language processing routines or Monte Carlo simulations. External analytic services and dynamic script execution are not supported in Tableau Public. All calculations must be performed using Tableau’s native calculation engine or pre-calculated before the data is ingested.
No Formal Technical Support & SLA Guarantees
Since Tableau Public is free, users do not have the benefit of dedicated customer support, ticketing systems or enterprise service level agreements (SLAs) around cloud uptime or performance. If a dashboard is slow to load due to noisy cloud neighbours or global server maintenance, authors must wait for resolution or ask for help in peer forums and community discussion boards.
Tableau Public Vs Tableau Commercial Editions
One way to clarify the functional differentiation of tiers is to compare Tableau Public against commercial Tableau Desktop, Cloud and Server deployments across key dimensions of operational performance.
Security and Data Governance
Commercial versions include fine-grained role-based control of access, row-level security, Active Directory/SAML authentication, audit logging, and certified data sources. By design, Tableau Public has no private access layer and all data that is published is public.
Connectivity and Ingestion
Commercial editions support enterprise databases, large data warehouses, ERP connectors, and real-time analytics querying. Tableau Public is restricted to static file formats, spatial files and Google Sheets, and only works on pre-extracted data structures.
Collaboration & Delivery
Teams can share workbooks via private portals in commercial deployments, set up automated e-mail subscriptions, send alert notifications when KPI thresholds are crossed, and have team sandbox folders. Tableau Public supports only direct public URL links, social shares, open profile pages and public website iframe embeds.
Cost of Ownership (Total)
Commercial licenses are available only as paid monthly or annual subscriptions per creator, explorer or viewer, and with infrastructure costs to manage the servers . Tableau Public is absolutely free so it is the open door to learning and public discussion.
The Best Practices of Tableau Public
To utilize Tableau Public better (while staying within limits), experienced visual designers and analysts often use certain key workflows.
The Practice of Cleaning and Aggregating Data
Before the data set is loaded into Tableau Public, it must be prepared and structured:
Make the file smaller and obtain faster extraction of the file by eliminating unneeded columns.
Aggregate the rows where possible (for instance, from logging by hours to logging by days) so that the number of rows is much lower than fifteen million.
No columns contain any confidential personal information, internal company identifiers, or secret keys.
Enhancing the Experience on the Worldwide Web
The visualizations created in the cloud must be reliable across different internet connections from all over the world:
Remove all heavy unindexed filters, complicated expressions, and repeating sheets.
Restrict the number of plotted visual marks displayed in one view (to avoid rendering problems in the browser).
Use Device Designer in order to check the display formats on different devices and ensure good visibility on mobile phones and tablets.
Involve Yourself In Community Competitions
A clear way to take part in community engagement of participating in tableau classes online continues to be the best way for someone wishing to improve his skills in Tableau Public:
Build and release visualizations on a regular basis as your permanent record of improvement.
Download works of talented authors and study best practices in terms of design solutions, calculation methodologies and dashboard-making techniques.
Receive comments from other community members concerning your visual hierarchy, accessibility, choice of colors.
Circulation of Platform
Tableau Public is considered one of the building blocks of today’s data visualization ecosystem. It combines its own top quality visual design with community features to serve as a tool for data journalists, researchers, self-taught analysts, and advocates of important causes.
With its features such as great design flexibility, reliable cloud hosting, and a vibrant worldwide community, Tableau Public is a great tool for learning visual analytics. However, its limitations are evident: there is no data privacy, flat file connectivity,
no automated scheduling, and the row limits make Tableau Public not suitable for demanding business intelligence.
As long as you are able to work within these parameters and utilize its strengths as a data storytelling tool, Tableau Public is a good platform for creating interesting portfolio with the help of data and sharing data-driven stories with the people.
There is an informative video that provides a detailed overview of Tableau’s public edition and its architecture in the article Public Components & Limitations in Tableau. The video is useful because it describes the architecture components and limitations of Tableau Public platform compared to enterprise options.