
Handling Missing and Duplicate Data Effectively in Power BI Models
Last updated on Sep 30, 2026

Cleansing and preparation of data are of significant importance in business intelligence. In Power BI, reporting and dashboards rely on tabular data modeling. The presence of missing values, empty spaces, or duplicate entries in the source data results in problems with reporting. Dirty data causes wrong revenue numbers and wrong KPI trends in reporting, leading to contradictory downstream reporting. The ability to comprehend data modeling principles via an power bi course online is an essential qualification of specialists who want to avoid problems while reporting. Hence, working with missing data or duplicates becomes essential from the point of view of both maintenance and architecture.
The Real Costs of Having Dirty Data
Before discussing some possible solutions to the problem, it is necessary to understand how missing and duplicated data can lead to the distortion of reporting systems. The use of dirty data in Power BI leads to the emergence of silent errors.
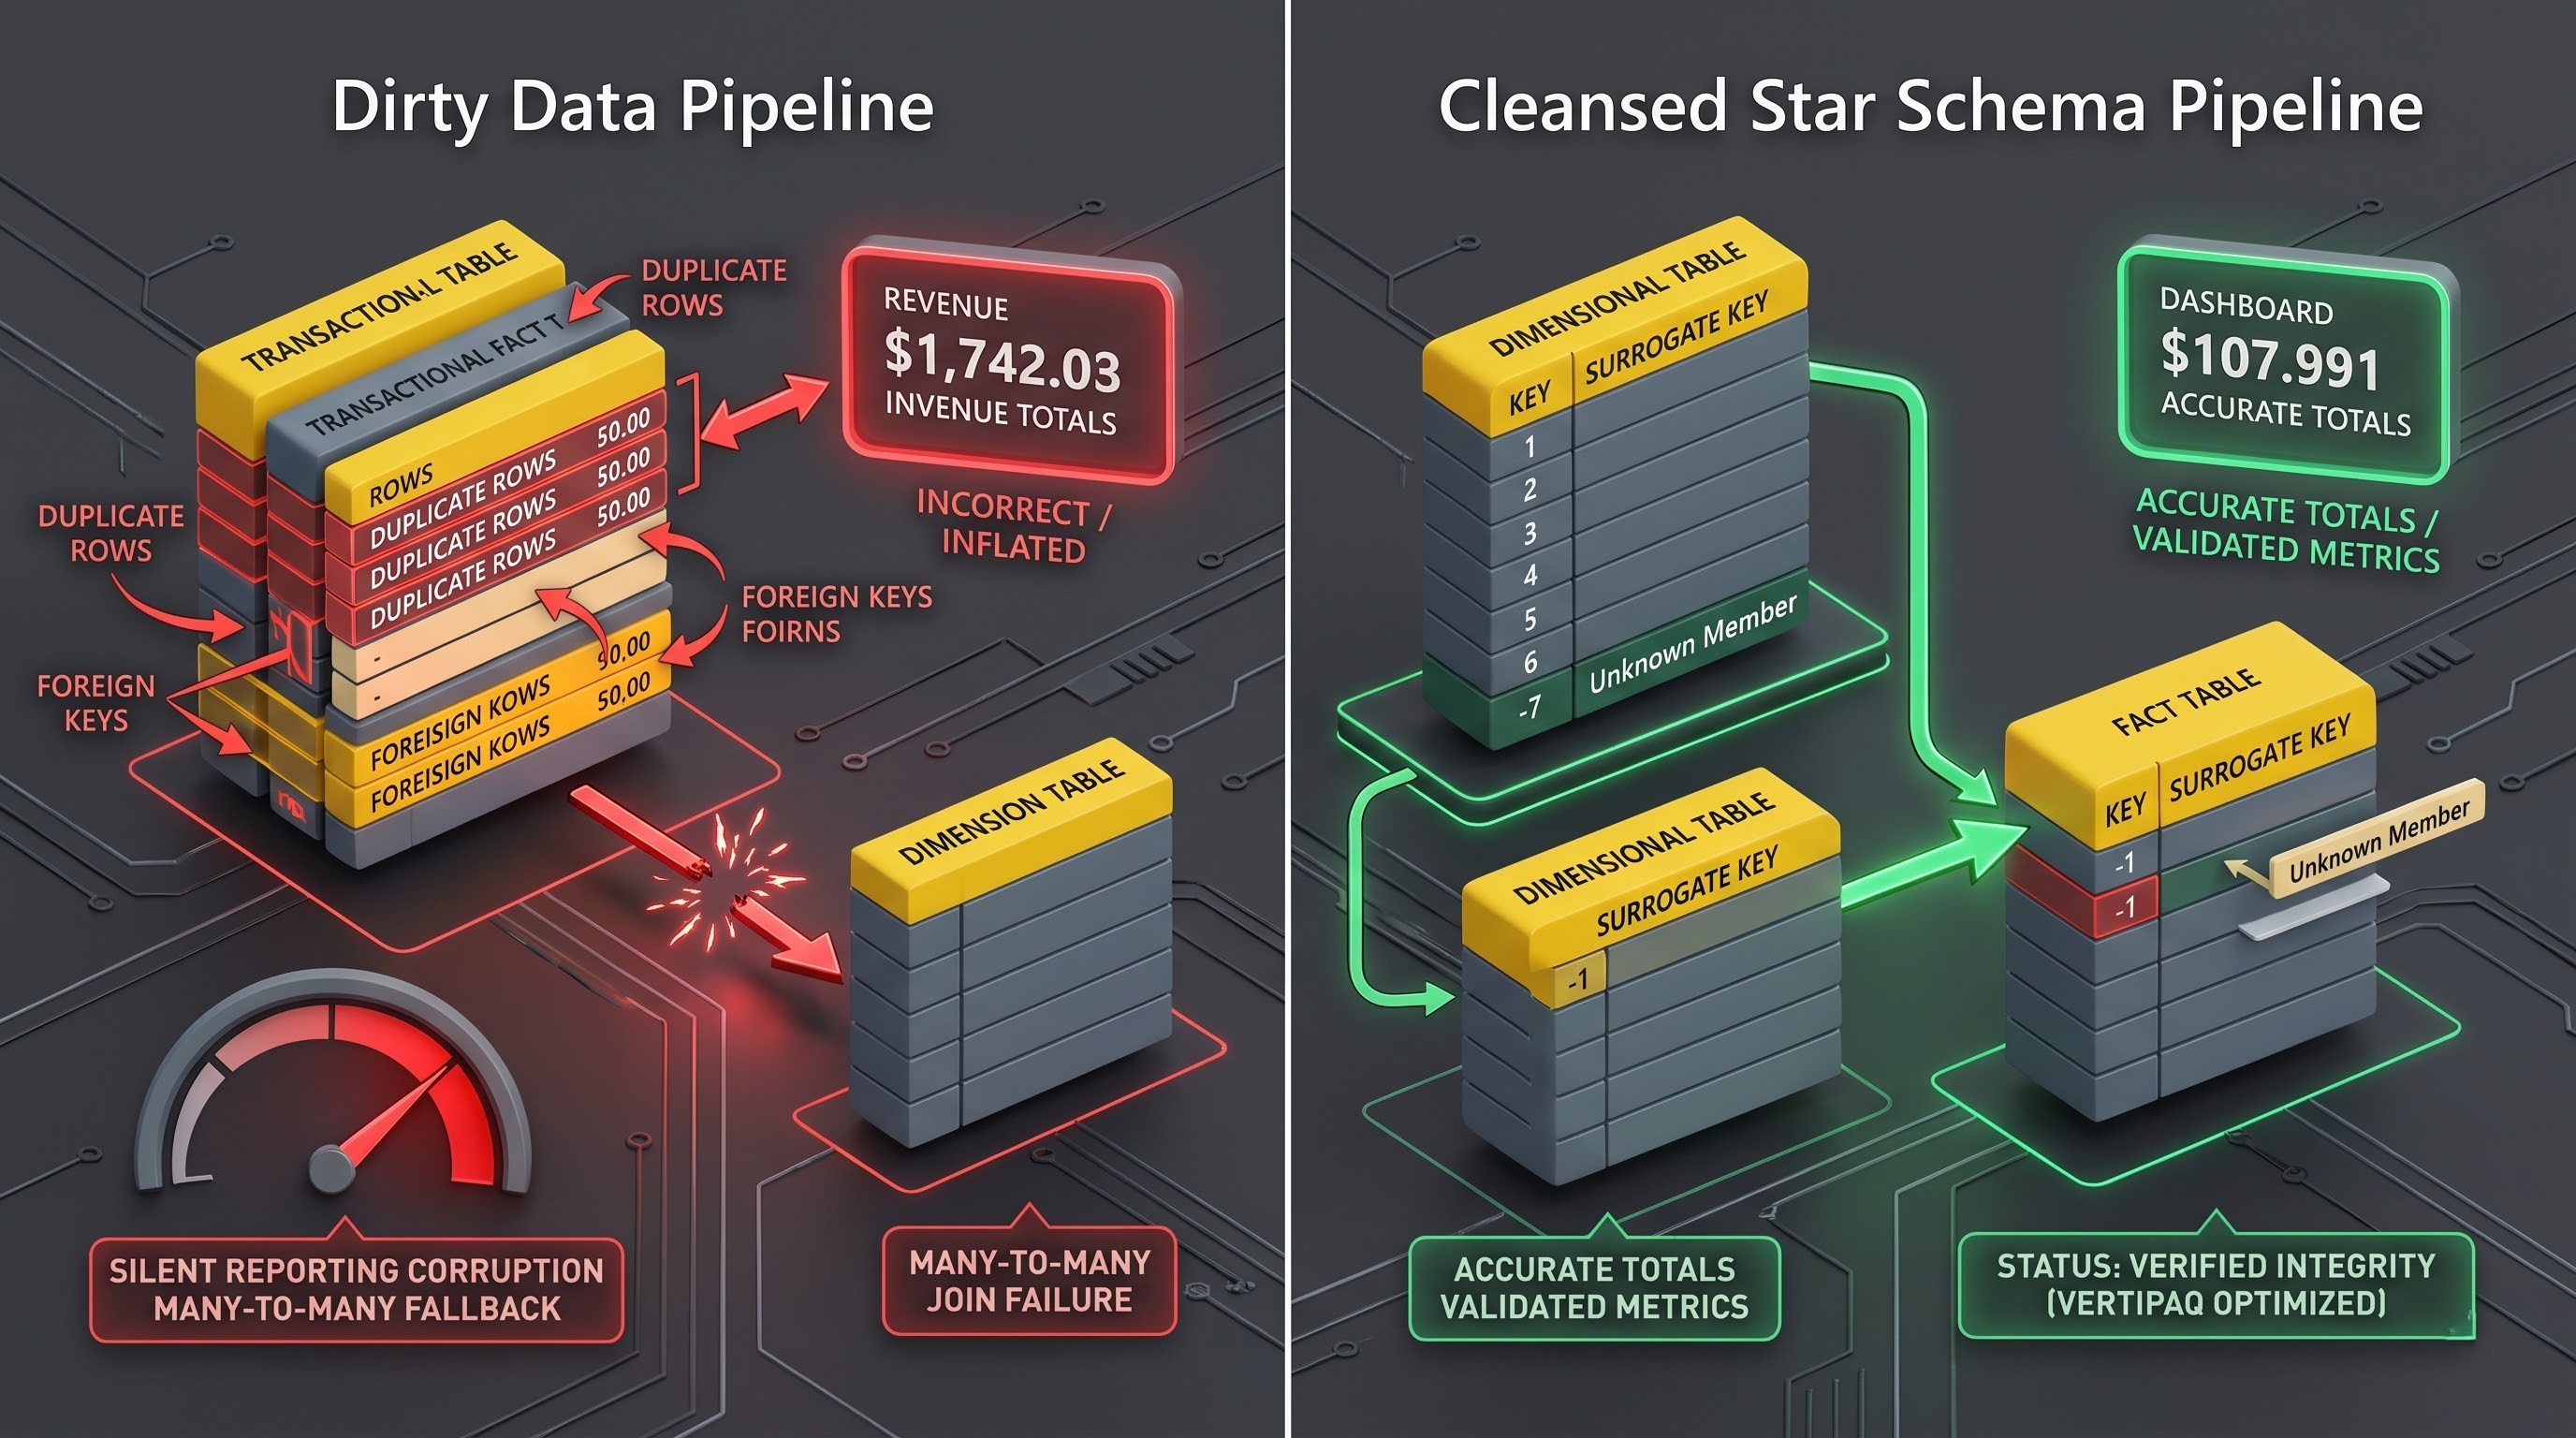
The presence of duplicate records causes false inflation. When the same transactional records are duplicated because of faulty data extraction or using non-unique keys, it results in unimaginable revenue numbers, unit counts, and interaction volume illusions. On the other hand, when duplicate keys in dimension tables exist, the relationships in Power BI model cannot be established properly. The star schema architecture is based on the idea that the dimension tables must use the unique key from the fact tables to create the proper relationship. Therefore if some dimension has duplicate customer IDs, product codes, or store IDs, the VertiPaq engine will not be able to establish a correct one-to-many relationship model and the modeler will end up creating many-to-many relationships or using bidirectional filtering instead.
Missing values result in an equal degree of distortion. Missing data can skew statistical distributions. For instance, when calculating averages, ratios, or percentages, how a system manages empty places modifies the denominator. As far as Power BI treatment of blank values is concerned, it sees blanks as nulls and excludes them from ordinary average calculation methods, potentially resulting in an unreasonable rise in average values. In addition, lack of foreign keys in fact tables violates referential integrity. In case a transaction includes a blank or orphaned foreign key, Power BI generates a row populated by a blank in the dimensional table in order to preserve referential integrity. This blank row is presented in slicers and crosstab visuals, which ruins the trust of business users who await high-quality presentations.
Missing Data: Definitions, Reasons, and Consequences in Analysis
The initial step for an analyst when dealing with missing values is to determine which specific values are missing. In relational databases and tabular data formats and models, missing values can have different meanings.
Nulls, Empty Strings, and Whitespaces

One of the biggest problems of tabular models is understanding the difference between real null values, empty text strings, and whitespace. In simple words, null means that there is no value; the field has never been filled in. An empty string is a text value of zero length. To explain, whitespace is a value made up of invisible spaces, empty lines, or tabs.
Even though in each of these cases an executive would see an empty space on a dashboard, Power BI distinguishes between them.
Firstly, real null values in numerical columns are interpreted as null or blank. When it comes to numerical context, nulls can be interpreted as zero, depending on the measure used.
Secondly, empty strings in text fields are counted as non-empty values, but their length equals zero.
Finally, whitespace values are non-blank text strings, which consist of invisible characters.
If an analyst attempts to categorize customer segments where there are null entries, empty strings, and spaces, Power BI recognizes them as three separate groups. Any filters will not work properly, groupings will show multiple blank-looking fields, and conditional logic will yield different results.
Mechanics of Missing Dimension Keys
The presence of missing values in primary and foreign keys creates distortion in the relational model. Whenever the fact table generates a record of a sale and thus lacks the identifier of a shop, this record becomes orphan. Since relational integrity dictates the necessity for the transaction to point out at least one entity in the corresponding dimension table, Power BI handles this problem by placing an implicit blank record in the dimension table.
This practice helps preserve data integrity by preventing the omission of fact rows from the calculations. At the same time, it directly impacts the reporting dashboard. Thus, slicers based on the dimension column display a blank entry at the top or bottom of the list. However, when users use the reporting software, they might interpret these blank entries as a malfunction of the reporting tool.
Reasons for Data Absence
Data absence can happen at multiple stages in the data lifecycle:
Collection Gaps: Optional form fields in operational software often create nulls. If customer registration systems are not designed to require secondary contact numbers, company names, or middle initials, missing values are left for analytics to deal with.
Extraction and Migration Issues: ETL jobs that pull from multiple sources can create gaps through schema mismatch, unmapped columns, and timing issues with the data mart.
System Switchover: Old data migration to new cloud databases results in many sections being empty due to the fact that older data does not have the fields used in the new surroundings.
System Logging Delays: Telemetry, website clicks, and IoT networks can overall lose data because of network outages.
Duplicate Data: Distinct Types, Main Causes, and Common Problems
Duplicates in Power BI do not always show up the same way on every front. The type of the duplicate signifies what action is necessary (delete it, merge it, or just decide it is valid data).
Identical Duplicates vs. Partial Duplicates
Identical duplicates happen when two or more records of a database are the same in all its columns. Identical duplicates arise from the process of extraction errors caused by e.g. double-fire webhooks, data retry processes, or Failing to avoid the chance of multiple identical records after extraction. Identical duplicates are likely to be just operational noise and do not need to be preserved at all.
Partial duplicates are more complicated. In this situation records can have the same identifiers or keys but differ in respect to some attributes. For example, there might be two customer records that are the same in every respect except for the address (one shows the former address while the other shows the current one).
Using normal automation to detect partial duplicates can lead to information that is important to history being lost forever if it is not used appropriately. For example, if the engine just happens to eliminate a row, there may be important changes made, as well as the risk of discrepancies.
Mismatch of Granularity
One of the most frequent ways of creating duplicates is not using the same granularity while connecting to the database. For example, when two tables are combined in Power Query, such as a sales order header and details table, if the details were not turned into a summarized view previously, all the details will populate the row in the header context.
If such a combination of data is treated as a header table while modeling data in further steps, the result would be the loss of uniqueness since keys would be repeated in the combined table.
Architectural Principle: Upstream Cleansing
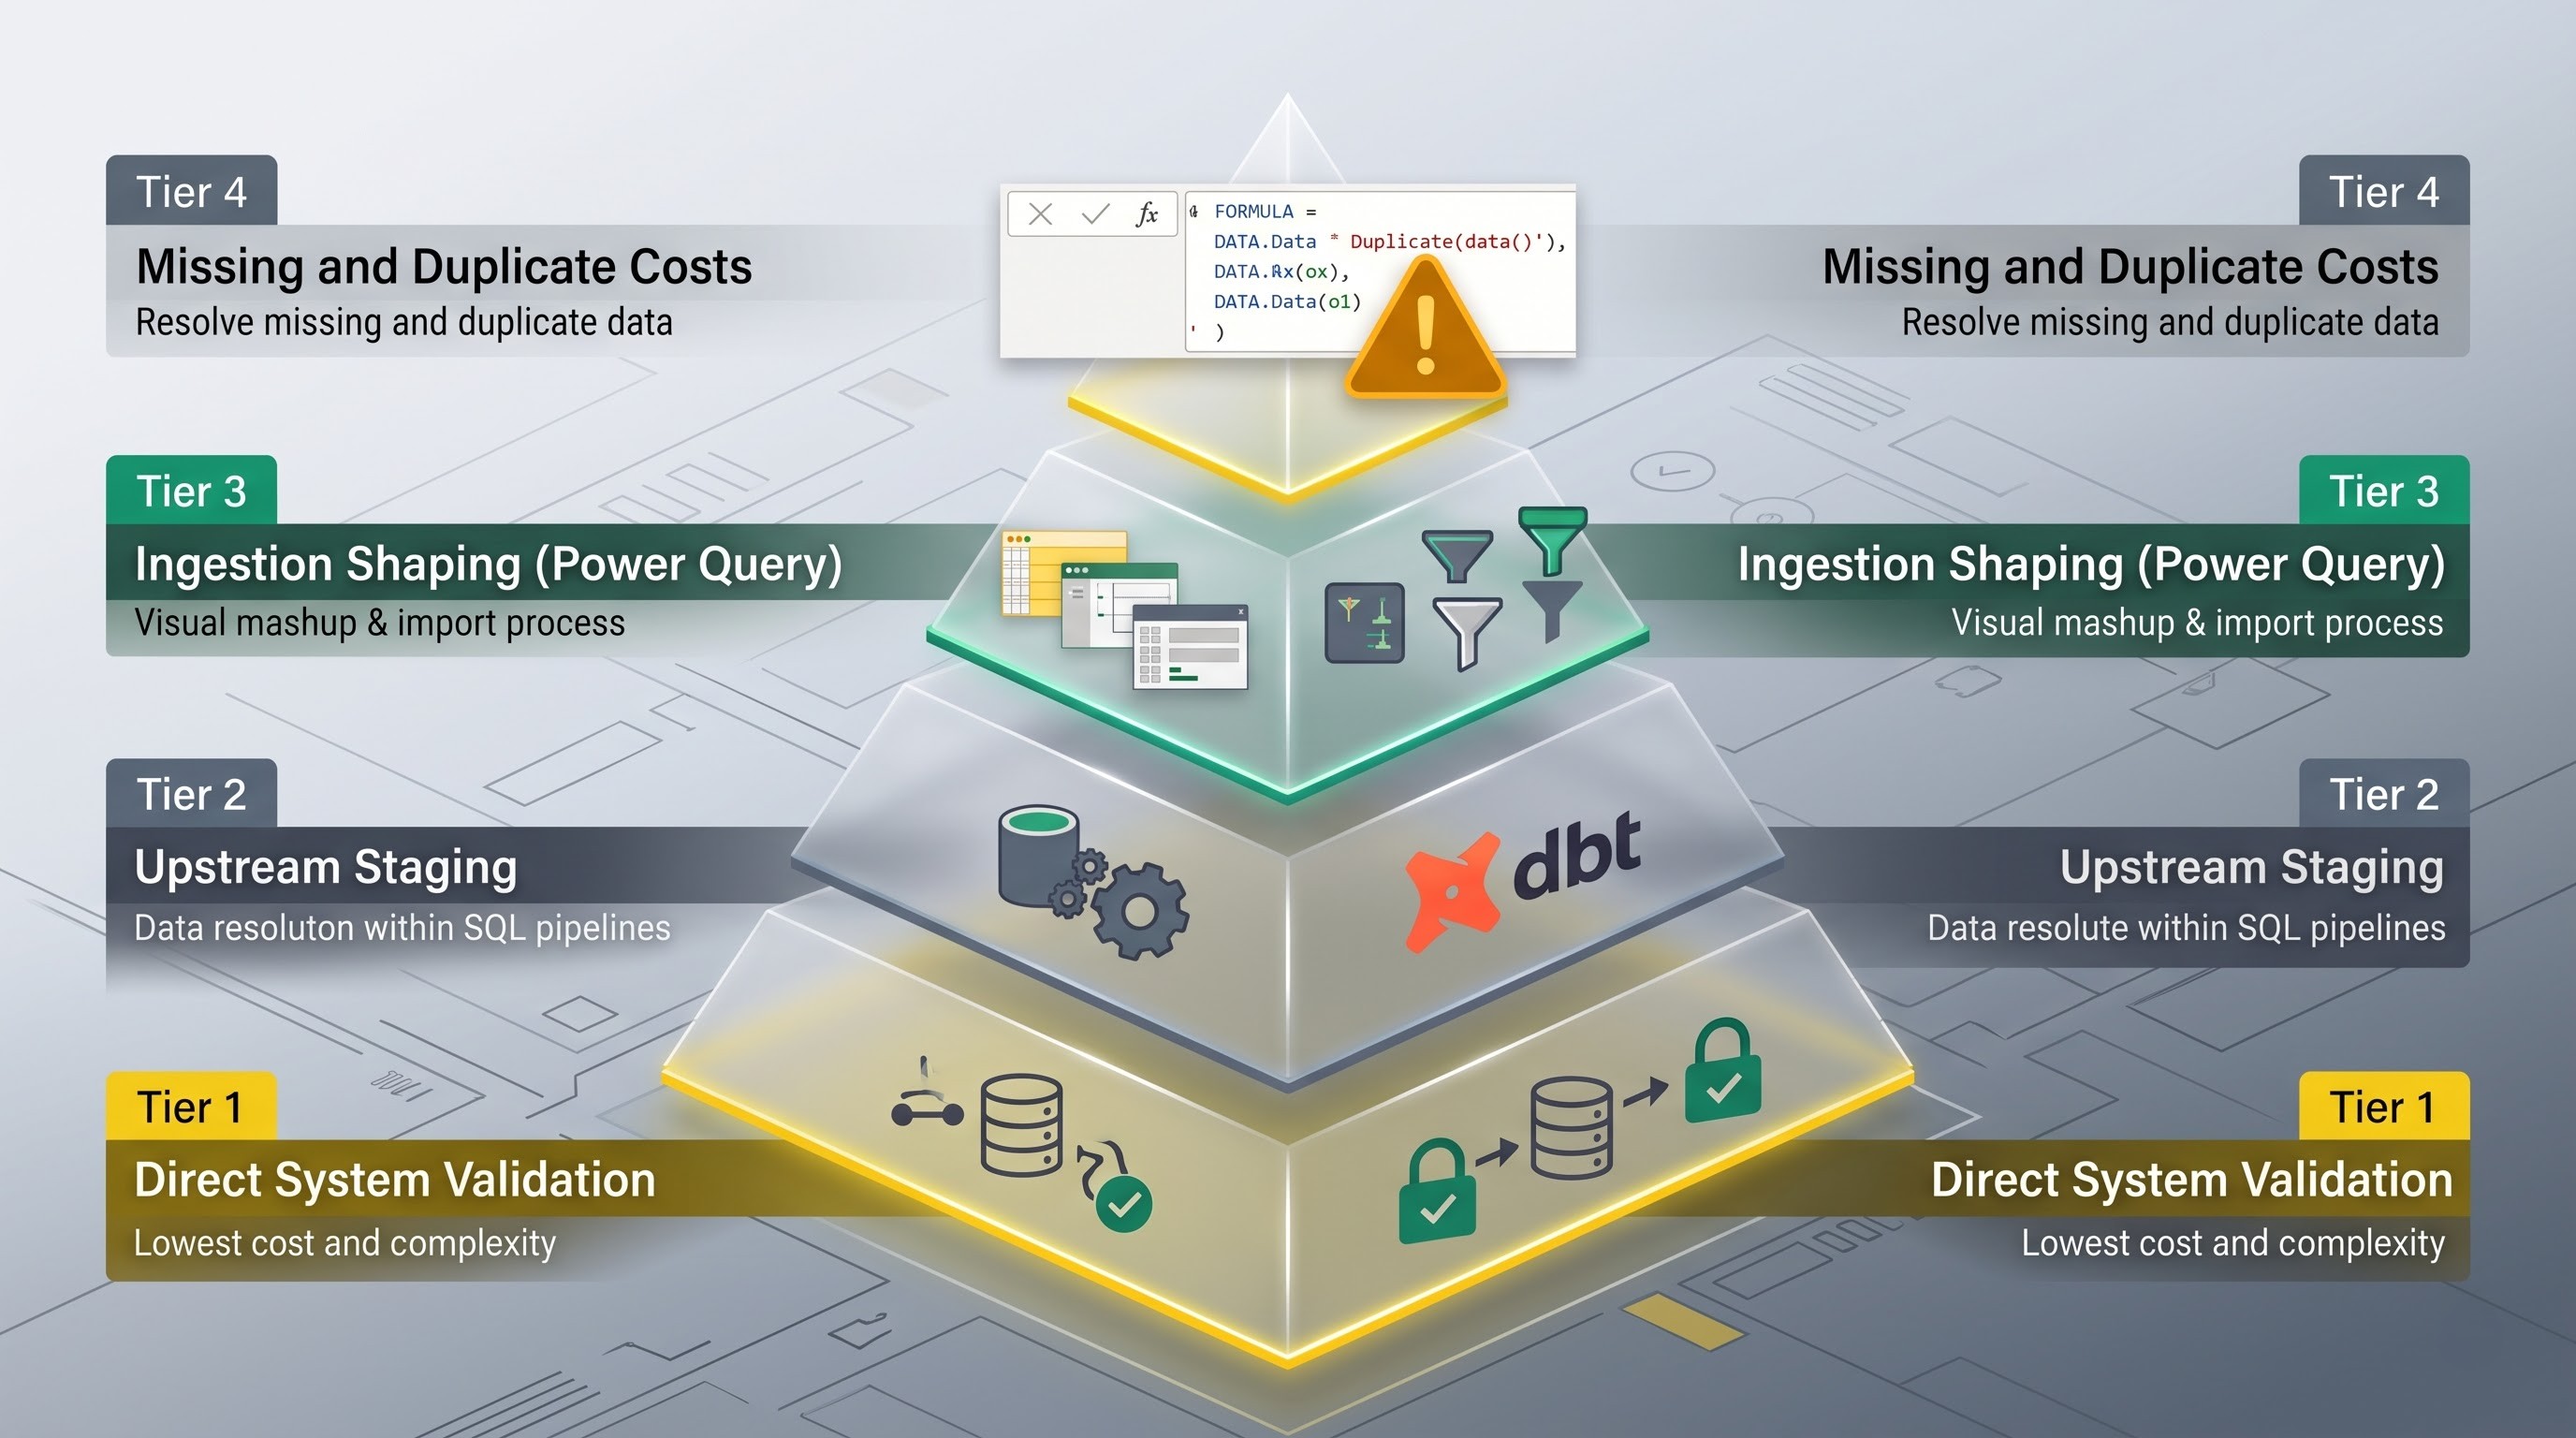
There is one architectural principle that underlies all decisions about data modeling before going into the details of different Power BI techniques: clean the data as far upstream as possible, and as far downstream as necessary.
The hierarchy of data transformation is as follows:
Source System: Validate and restrict data entry directly in transactional systems and applications
DW/Lakehouse: Carry out industry-class deduplication, imputation, and dimensional modelling using SQL views, dbt, or Spark pipeline before publishing datasets;
Power Query (Mashup Engine): Transform, clean, shape, compress data when ingesting it using M language;
Data Analysis Expressions (DAX): Calculate the corner cases and establish relationships at the modelling level dynamically during the query execution.
Employing DAX to handle absent data and remove duplicates while rendering the visualization proves pointless and heavy on resources. The dynamic calculation engine's logic requires a considerable amount of RAM memory, thereby slowing the rate of visual updates and requiring report developers to create cumbersome intermediate particle measures. Many developers end up in this trap because they are not trained about the engine's structures and hence need to take power bi classes online for practical knowledge.
The Strategic Resolution of Missing Data
Dealing with missing data requires varied strategies based on the missing values which may either belong to categorical text fields or continuous numeric ones or relation keys.
Treating Missing Values in Categorical Data
Categorical fields refer to business dimensions, such as the geographical areas, product lines, department titles, customer statuses, or territories. Leaving nulls or blanks in categorical columns compromises the user experience because they lead to the empty labels being shown in charts, slicers, and filter panes.
The Method of Replacing Nulls with Business Classifications
The most straightforward method of handling the absence of values of certain categorical fields is to replace null values, empty fields, and whitespaces with an appropriate business classification. Examples of business classifications include “Not Specified”, “Unknown”, and “Pending Classification”.
Using this method allows us to achieve several things:
We avoid ambiguous empty values from our slicers and dropdown lists, and we give users a category that they can filter or use for their inquiries.
It creates a positive difference between data that was intentionally not collected and data that could not be loaded due to a problem in the loading process.
It pushes all missing instances into one reporting bucket instead of spreading them across the empty strings and null values.
To ensure the correct application of this approach, first the column with fields needs to be cleaned from invisible whitespace. This can easily be done with the help of Power Query.
Cross-column imputation
In a lot of business models, one might use heuristic reasoning to deduce the value of missing attributes. Suppose that a shipping address is missing a name of a state or province but contains a valid postal code and city name. In this case, conditional logic can find the corresponding region through a clean geographical master table. In the same way, when an employee record is missing division information, this information can be inferred from the manager or cost centre code of this employee.
Missing values in numerical and financial data
There is no room for being careless about missing numerical information. Zero is a definite value indicating that there is nothing in quantity, while null means that there is no information available at all. If one confuses these two concepts, it will lead to serious miscalculations.
Zero Imputation Compared to Null Preservation
Imagine a situation on an e-commerce website where customers get rated from one to five. In the event that a client opts not to provide feedback, the corresponding column gets stored as null. A zero value change, however, alters the overall customer satisfaction score leading the managers to believe that clients are very unhappy. It is here where nulls should either be preserved or kept separate without taking part in average calculations.
Take for example a table with customer purchases where the discount column is showing a null value. In this situation, the null indicates genuine absence of the discount application. Thus, changing it to zero will work mathematically since it will allow accurate estimation of discount sums, profit margins, and profitability without breaking additional logic.
Imputation Methods
When numerical values are genuinely nonexistent due to sensor failures, communication failures, or data incompleteness, numerous imputation methods are available:
Static Mean or Median Imputation: The missing value is substituted with the mean or median of the entire group. Despite its simplicity, this method over-simplifies the statistics and affects the patterns of data.
Segmented Imputation: The missing value is replaced with its specific group average or median. For instance, if one of the machines has a missing operating temperature, its value can be imputed using the average temperature of similar machines operating in the same factory and covered by the same operational shift.
Temporal imputation (Forward Fill and Backward Fill): In time-series analyses, such as estimation of daily levels of inventories or prices for particular commodities, there are oftentimes days of closing of the stock market or loss of connection by the sensors. As an example, for forward filling, the last valid measurement made before the data gap should be used up until a new measurement is available. Backward filling is the method of filling the past values with information that is known from the following moment of time.
Addressing Situations of Foreign Keys Being Absent
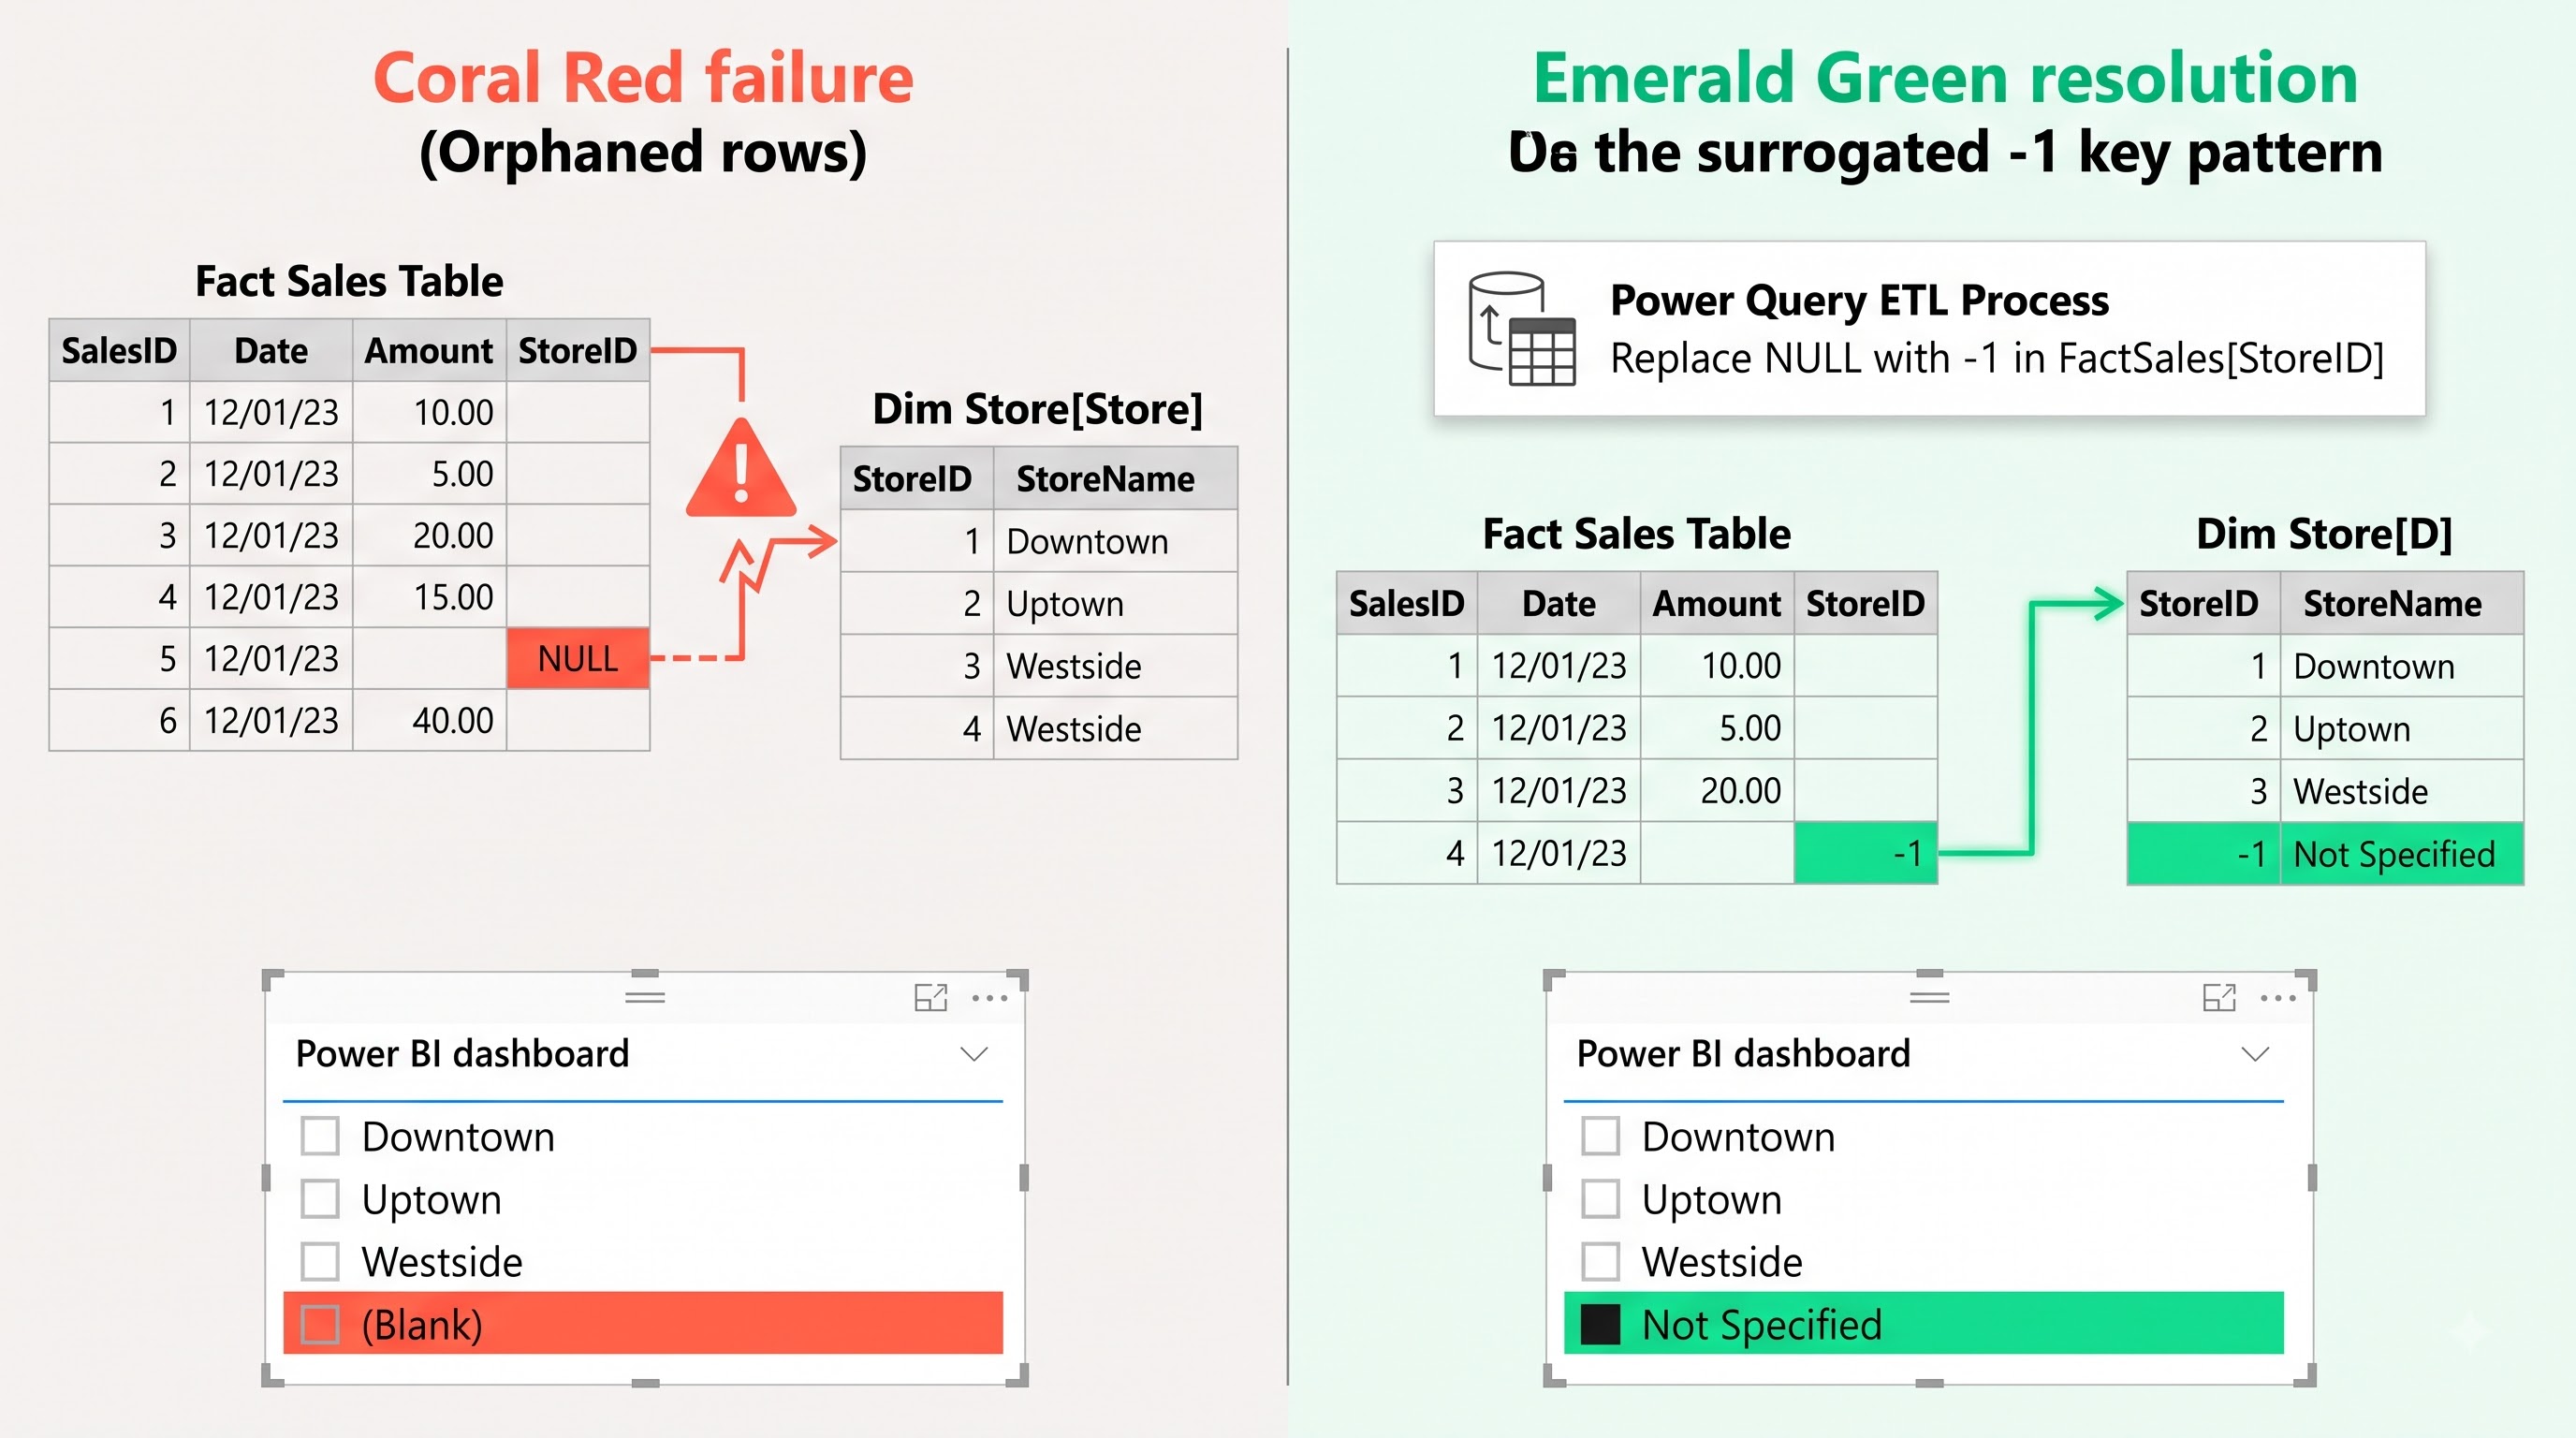
The application of a generic textual replacement such as "Unknown" for a foreign key in a transactional database table results in a mismatch in different data formats.
A recommended standard practice is the use of the Unknown Member Pattern.
Make sure that the column of primary keys in the dimension table serves as an interface for a universal surrogate key (for example, an integer with a value of -1).
Create a permanent entry in the dimension table where the primary key will have the value of -1 and where all additional attributes will be termed “Unknown,” “Unallocated” or “Not Applicable.”
In the fact table replace all missing foreign keys with -1.
Establish a uniform relationship "one-to-many" between the dimension table and the fact table.
The application of this pattern ensures that there are no orphan records at all.
Strategic Remedies for Redundant Data
The commitment to maintaining a selective approach in the elimination of data is essential. The indiscriminate removal of records may lead to the loss of a potential opportunity for income, whereas the act of leaving these records in one’s possession may lead to an inaccurate representation of the data that measures performance.
Removing Duplicate Entries from Dimension Tables
When working on dimension tables, it is vital to ensure that they are unique on an individual basis. Therefore, a customer table cannot include two or more identical customers; a date table is not supposed to have duplicates of a single date; and so on.
As soon as duplicates occur in the dimension tables, the modeling team undergoes a series of steps to eliminate duplicates.
Exactly the Same Duplicate Remover
If an entry is repeated in the dimension table throughout all columns, Power Query provides users with the tools to delete duplicate entries. The underlying process includes uniting entries into one in terms of masses of the data and eliminating the unnecessary consumption of memory.
Business key conflict resolution
In cases when there are two business keys with different attributes, one should not go for automated deduplication unless a tie-breaking condition is applied.
1) Last Update Rule: When the data source tracks last update timestamps, the table is to be sorted chronologically according to the business key and the timestamp in descending order. At this moment, the information older than the last one needs to be removed from duplicate records.
2) Completeness Rule: When there is one record with the missing descriptive fields while the second record does not contain nulls in these fields, the transformation should favor the record with more complete data.
3) Hierarchical Authority Rule: When dimension data comes from different sources (for instance, when customer details from the company’s CRM system and billing system are integrated), the transformer should determine which source has a higher priority as for this field.
Eliminating Duplicate Entries from Fact and Transaction Tables
Fact tables should be treated with caution. Two identical transaction records may represent two separate, yet valid, transactions occurring at the same point of time in the same store.
How to Identify a 'Natural Key'
The first step in preventing duplicates is to check whether a natural key exists for the table or if it is composite. A natural key may contain any of these attributes: transaction date, register ID, cashier ID, customer ID, item SKU and line number.
In this case, if all the elements of the natural key are identical for multiple records, the records are legitimate duplicates that should be removed. If there is no natural key, it is mandatory to contact the administrators of the respective business unit before initiating any deduplication steps in Power Query.
Handling Incremental Refresh duplication
A common source of duplicates in enterprise BI systems is the incorrect setup of incremental refresh. When the incremental refresh is being set up, Power BI generates antiquities and rolling windows based on timestamps.
In case the source system is able to register late arrival facts, including those with timestamps that do not fall under the refresh window, records can be entered into the active refresh partition and also the historical partition at the same time. To avoid this, we must do the following:
Ensure that transactional databases have an unchangeable insert timestamp along with an update timestamp.
Ensure that Power BI incremental refresh parameters match up to the update timestamp.
Upstream staging views must be set in SQL for the elimination of duplicates before data enters the tabular model.
Tool-Specific execution: Power Query and DAX
An important factor is which data cleaning method to apply in the Power BI modeling competencies. Selecting the wrong engine can affect the structure of data and reduce performance. By gaining actual mastery over both engines through specialized power bi online training, report authors learn when to perform extensive transformations in Power Query and when to use DAX for analysis.
Power Query Engine
Power Query is responsible for extraction, transformation, and loading in Power BI. Once the dataset is being refreshed, Power Query processes the raw data so that it could be stored in the tabular database VertiPaq.
Cleaning and sanitizing textual fields starts with trimming leading and trailing spaces and deleting blank spaces.
It also involves substituting null foreign keys with surrogate keys (-1 for instance).
Other actions include substituting missing values based on row-level logic and lookup or merge queries, removing duplicates from dimensional tables through sorting and uniqueness processes, and referring to unpivoting the data to sparse datasets to make random missing fields structured data in rows.
All transformations conducted in Power Query are completed once while refreshing the data. Once the transformation process is finished, VertiPaq engine compresses the resulting clean data by using dictionary encoding, run-length encoding, and bit packing. As VertiPaq relies on low cardinality of columns, removal of duplicate data and conversion of various blank forms into one common placeholder contribute significantly to the size reduction of data in memory and increase the speed of visual loading of data.
Data Analysis Expressions (DAX)
DAX is a language used for calculations and query analysis. It is responsible for evaluation of relationships and calculation of measures during rendering of visuals.
DAX is generally not the best choice for finishing a deduplication job to clean structural data or filling up for missing values – using DAX to create calculated tables and calculated columns for administrating dirty data results in ignoring VertiPaq compression improvement, doubling the required memory amount and increasing the refresh time for the model.
However, DAX is useful in terms of analytics processes concerning missing values:
Controlled Blank Coalescence. One of the requirements of business reporting is that measures should return a dash or certain text instead of empty visual card when the transactions amount to zero or are not recorded. DAX measures can easily determine a result being blank and replace the output visually with the required one.
Safe Division. Ratios of the quantities may include denominators that are zero or blank; thus, division functions in DAX perform managing exceptions automatically and give a substitute result instead of stopping visual production due to infinity error.
Handling Dynamic Filter Context. DAX gives an opportunity for isolating or including unidentified dimensions or missing dimensions of the filter context as well.