
How Power BI Is Changing Business Intelligence in 2026
Last updated on Sep 4, 2026

There was a time when business intelligence meant opening a spreadsheet, filtering rows, creating a few charts, and sending a report to management. That approach worked when businesses had smaller amounts of data and fewer systems to manage. Today, however, organizations collect information from CRM platforms, websites, finance applications, cloud services, marketing platforms, operational systems, and customer interactions. The challenge is no longer simply having access to data. The real challenge is understanding what that data is saying and turning it into something people can confidently act on.
This is where Microsoft Power BI has become much more than a dashboarding tool. It has developed into an important part of the modern Microsoft data ecosystem, increasingly connected with Microsoft Fabric, One Lake, semantic models, real-time analytics, and generative AI. The direction is significant because business intelligence is moving beyond simply answering “What happened?” toward questions such as “Why did it happen?”, “What is changing now?”, and “What should we investigate next?”
For someone learning Power BI today, this means the skill is no longer limited to knowing how to create attractive charts. The more valuable ability is understanding how business data is prepared, modeled, measured, visualized, governed, and ultimately used to support decisions.
Why Power BI Still Matters in an AI-First World
Artificial intelligence has changed the way people think about analytics. An employee can now ask an AI assistant a question in natural language and receive an explanation within seconds. At first glance, this might make traditional business intelligence appear less important. In reality, it makes reliable BI foundations even more important. AI can generate an impressive answer from poorly structured or incorrectly defined information, but an impressive answer is not necessarily a trustworthy one. Imagine two departments calculating “revenue” differently. Finance may exclude certain adjustments while sales includes them. Both teams can produce professional-looking reports, and an AI assistant can summarize either one. The underlying problem, however, remains the same: the organization does not have a consistent definition of the metric.
This is why the semantic model has become such an important part of modern Power BI. A semantic model provides business context around data through tables, relationships, measures, and other analytical definitions. Instead of treating information as a collection of disconnected numbers, it establishes how those numbers relate to the business.
That distinction becomes particularly important as organizations introduce AI into their analytics workflows. AI needs context to produce useful answers. The better the underlying model and business definitions are, the more useful AI-assisted analysis can become.
Power BI Has Become More Than a Reporting Tool
Power BI is often introduced through dashboards because dashboards are visually impressive and easy to demonstrate. But a real Power BI implementation usually involves a much broader process. Data has to be collected, transformed, modeled, calculated, visualized, shared, secured, and maintained.
Data preparation handles inconsistencies and removes unnecessary information. Data modeling establishes relationships between different business entities. Measures transform raw columns into meaningful business calculations. Reports present those calculations in a way that people can understand. The Power BI Service supports publishing, collaboration, sharing, and management, while security and governance determine how information should be accessed.
This distinction is important for learners. Creating a visually attractive report can be relatively easy after some practice. Building an analytical model that remains accurate, understandable, and maintainable as an organization grows is a much greater skill. The strongest Power BI professionals therefore do not begin with the question, “Which chart should I use?” They begin with, “What business question are we trying to answer?”
The Power BI Concepts That Actually Matter
Power Query: Turning Messy Data Into Usable Information
Most business data is not ready for analysis when it first arrives. A spreadsheet may contain duplicate customers, inconsistent date formats, missing values, unnecessary columns, or department names written differently across systems. If these problems are ignored, even a perfectly designed dashboard can produce misleading results.
Power Query provides a repeatable way to clean and transform that information before it reaches the analytical model. Users can connect to different sources, change data types, remove unnecessary rows and columns, combine datasets, split fields, replace values, and perform many other transformations.
The most valuable part is that these transformations can be repeated. Instead of manually cleaning every monthly file, an analyst can create a transformation process that handles the same problems whenever new data arrives. This changes the role of the analyst from repeatedly fixing data to building a process that can handle predictable problems automatically. That idea reflects a much larger principle in modern analytics: repetitive data preparation should increasingly become a reliable process rather than a recurring manual task.
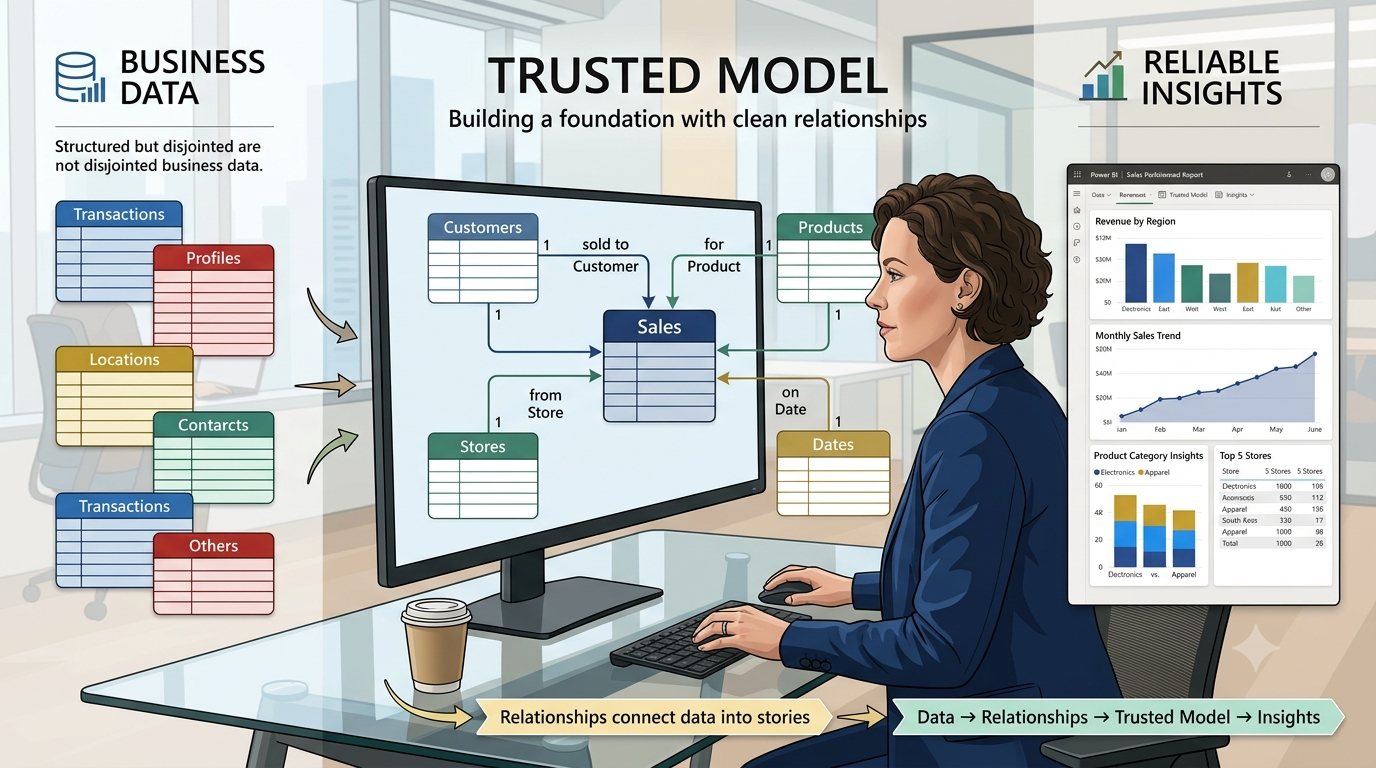
Data Modeling: The Foundation Behind Reliable Reports
A Power BI report can look impressive while its underlying model is poorly designed. This usually happens when someone focuses on visuals before understanding how the data should be structured. Consider a retail organization with customers, products, stores, sales transactions, dates, and promotions. These datasets are related, but that does not mean they should simply be placed into one enormous table. A well-designed model establishes how each business entity connects to the others.
Concepts such as fact tables, dimension tables, relationships, cardinality, filter direction, and star schemas therefore become extremely important. A sales fact table can store transactional information while dimensions provide context about products, customers, stores, and dates. The importance of modeling becomes obvious when business questions become more complicated. “What were total sales?” is relatively simple. “What were premium-customer sales in the North region during the previous quarter compared with the same period last year?” requires a model capable of applying multiple layers of context correctly.
This is why data modeling is one of the most valuable skills to develop rather than simply learning how to drag fields onto a report canvas.
DAX: Analytical Thinking Inside Power BI
DAX is another area where learners can easily fall into the trap of memorizing formulas. A better approach is to understand the concepts behind those formulas.
DAX becomes powerful when you understand measures, filter context, row context, relationships, and evaluation behavior. The important question is not simply how to calculate a number, but how that number should behave when users interact with a report.
For example, total revenue may change when a user selects a particular region, product category, customer segment, or date range. A properly designed measure understands that context and returns the appropriate result.
This is why measures are so important in professional Power BI development. A well-designed measure can become a standardized definition used throughout an organization. Metrics such as revenue, gross margin, conversion rate, customer retention, average order value, and year-over-year growth can be defined once and reused across multiple reports. That creates consistency and reduces the risk of different teams calculating the same business metric in different ways.
Visualization Should Help People Make Decisions
One of the easiest mistakes in BI is assuming that more visuals automatically create better analysis. They do not. A report containing twenty-five charts can be considerably harder to understand than one containing five carefully selected visuals.
The better question is what decision the report is supposed to support. A sales manager might want to know which regions are falling behind, which products are responsible for the decline, whether the problem comes from lower volume or pricing, and which customers may be at risk. A finance leader may care more about actual-versus-budget performance, cost variance, margins, cash position, and forecast accuracy.
The design should reflect those questions rather than attempting to display everything available in the dataset. Clear hierarchy, appropriate comparisons, meaningful filters, readable labels, and controlled visual density can make a report substantially more useful. A professional dashboard should feel less like a collection of charts and more like a guided conversation with the data.
Power BI and the Rise of Microsoft Fabric
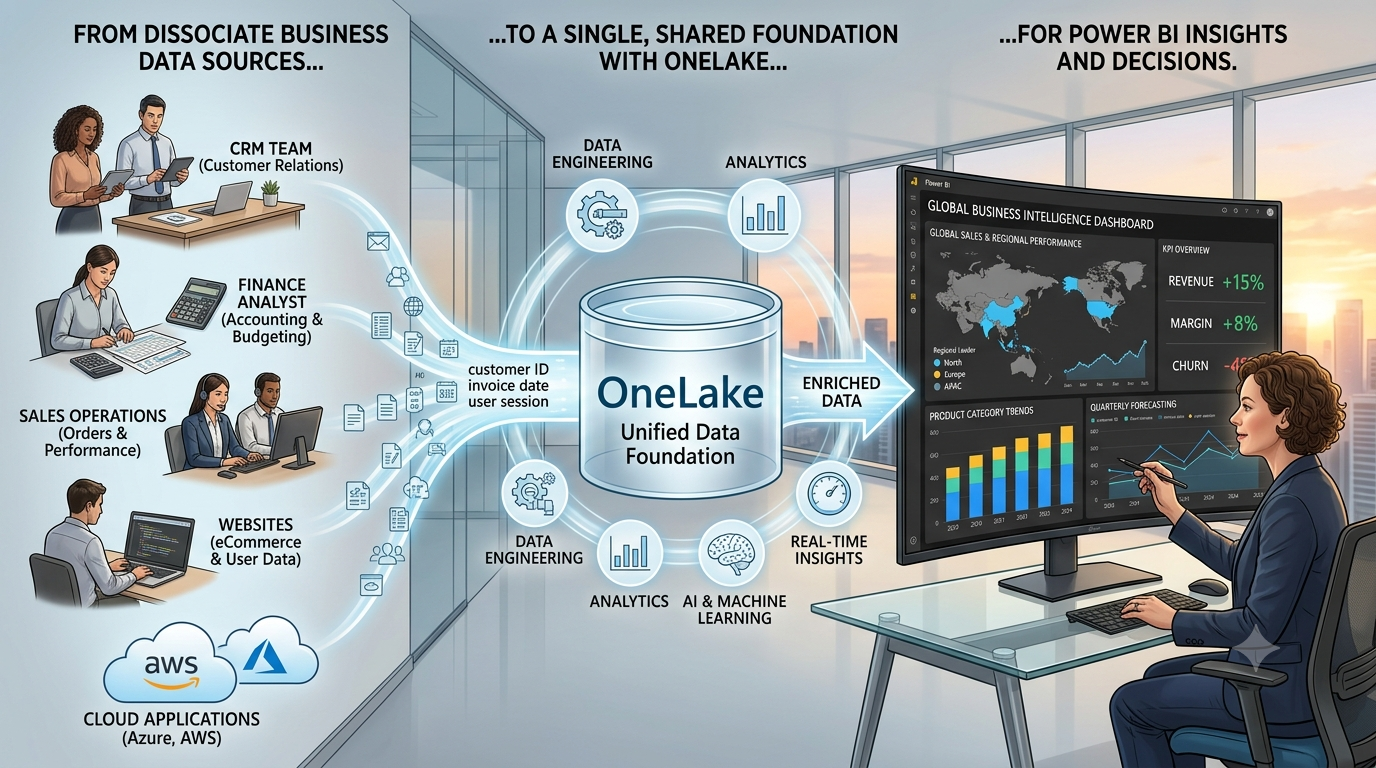
One of the biggest developments for Power BI learners to understand in 2026 is its relationship with Microsoft Fabric. Fabric brings together capabilities across data engineering, data science, data warehousing, real-time analytics, and business intelligence within a broader analytical platform. This means Power BI increasingly operates as part of a larger data architecture rather than as an isolated reporting application. That matters because enterprise organizations rarely have all their information in one place. Data can exist in databases, cloud applications, files, business systems, and specialized platforms.
OneLake is an important part of the Fabric vision because it provides a unified data foundation across analytical workloads. The broader goal is to reduce unnecessary duplication and make organizational data easier to work with across different analytical scenarios. For Power BI professionals, this creates an opportunity to move beyond traditional report development and understand how reporting connects to the wider data platform.
Direct Lake Changes the Conversation Around Data Access
Direct Lake is one of the more interesting developments for people following modern Power BI architecture. Traditionally, Power BI models have commonly relied on Import mode or Direct Query, each with different performance and data-freshness considerations. Import mode loads data into the Power BI engine and can provide strong performance, but data generally needs to be refreshed. Direct Query queries the underlying source, which can reduce the need for imported copies but makes report performance more dependent on the source system and query behavior.
Direct Lake introduces another approach for data stored in OneLake. It is designed to allow Power BI semantic models to work directly with data stored in Delta tables, loading columns as needed rather than following the conventional import process.
The significance goes beyond simply adding another storage mode. It represents a broader movement in modern analytics in which the BI layer becomes increasingly connected to the underlying data platform. For professionals working with large datasets and modern Fabric environments, understanding when different storage approaches make sense is becoming increasingly valuable.
The Semantic Model Is Becoming More Important
There has also been a meaningful shift in the terminology used around Power BI. The term “dataset,” which was widely used historically, has increasingly been replaced by “semantic model.” The new terminology better reflects what the object actually represents. It is not merely a collection of data. It can contain relationships, measures, metadata, business definitions, and analytical structures that explain how information should be interpreted.
This becomes especially important when AI is introduced. Suppose an organization has a measure called “Net Sales.” An AI assistant needs to understand what that measure represents before it can provide a useful explanation. Without consistent definitions and appropriate modeling, natural-language questions can produce results that sound convincing but do not accurately reflect the organization's intended business logic. That is why AI does not remove the need for good data modeling. In many cases, it makes good modeling even more important.
Power BI and Copilot: What Is Actually Changing?
Generative AI is becoming increasingly integrated into Power BI and the wider Microsoft analytics ecosystem. AI-assisted capabilities can help users explore information, work with DAX, generate summaries, understand reports, and interact with data using more natural language.
The most interesting change is the interaction model. Historically, an analyst needed to know which visual to create, which fields to select, and where to apply filters. Natural-language experiences can reduce some of that friction by allowing users to begin with a question.
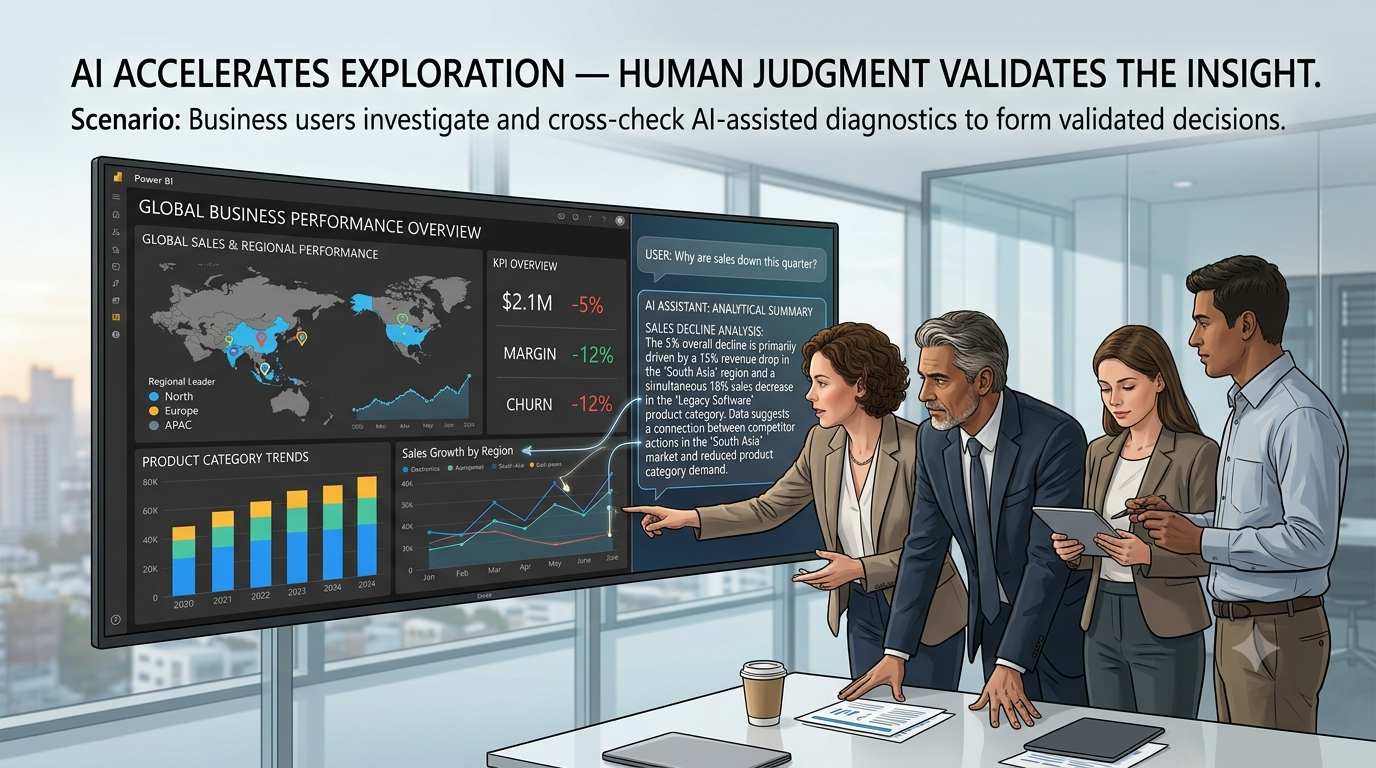
For example, a business user might ask which product categories experienced the largest decline during the current quarter. That sounds straightforward, but answering it reliably still requires the system to understand what “decline” means, which period should be compared, which revenue measure should be used, and whether returns or cancellations should be included.
This is where human expertise remains critical. AI can accelerate exploration, but it does not automatically provide business judgment. Someone still needs to validate the result, understand the context, recognize unusual patterns, and determine whether the finding actually matters to the business. The future therefore looks less like humans versus AI and more like humans using AI to investigate business questions faster.
What Makes a Power BI Report Look Professional?
A professional Power BI report is rarely defined by complicated visuals. It is usually defined by clarity. The user should immediately understand what the report is about, which metrics matter, what changed, and where attention is required. Consistent terminology is equally important because different names for the same metric can create confusion. Comparisons also add meaning. A revenue number by itself tells a limited story. Revenue compared with a target, previous period, forecast, or historical benchmark tells a much more useful one.
Good reports also avoid unnecessary visual density. Every chart should have a reason for being there. If removing a visual does not reduce the user's ability to understand or act on the information, it may not need to exist. Ultimately, good dashboard design combines analytical thinking with visual communication. The objective is not to make the report look busy. The objective is to make important information easier to understand.
Is Learning Power BI Worth the Investment?
For someone considering professional training, the important question is not simply how much a course costs. When comparing power bi course fees, learners should examine what is actually included in the program and whether it develops practical skills rather than only teaching interface features.
A strong program should cover data preparation, modeling, DAX, visualization, Power BI Service, security, and realistic business projects. It should explain why particular approaches are used instead of simply demonstrating a sequence of clicks. Learners should also check whether the material reflects the current Power BI and Fabric environment because the platform continues to evolve.
A low-cost course can become expensive in practice if it leaves major knowledge gaps that require additional learning later. At the same time, a high-priced course is not automatically better. The real value comes from whether the learning experience helps someone move from following tutorials to solving unfamiliar analytical problems independently. That is a much better way to evaluate training than comparing course prices alone.
What Should a Modern BI Course Teach?
The definition of a useful bi course is changing as the technology evolves. Earlier BI education often focused heavily on creating reports and dashboards. Modern training needs to provide a broader understanding of the analytical lifecycle. A learner should understand how a business question becomes a data requirement, how the data is transformed, how the model is designed, how metrics are defined, how the information is visualized, and how the final result reaches the people who need it.
This broader perspective also makes learners more adaptable. A particular interface may change, a feature may be renamed, or a new AI assistant may appear, but the fundamental principles of data modeling, analytical logic, business metrics, and decision-making remain relevant. For that reason, the strongest learning programs teach both tool-specific skills and transferable analytical thinking.
Choosing the Right Power BI Learning Path
There is no single program that can genuinely be called the best choice for every learner. The right learning path depends on someone's existing knowledge and career objective. A beginner may need to start with data concepts, Excel, Power Query, basic modeling, and visualization. An experienced Excel user may be able to move quickly into Power Query and data modeling. Someone with a SQL background may already understand relational data and therefore benefit from focusing more deeply on semantic models, DAX, Power BI Service, and report design.
Professionals already working in BI may want to explore Fabric, Direct Lake, performance optimization, governance, deployment, and AI-assisted analytics. When evaluating what could be the best power bi course, learners should therefore focus less on the number of features listed on the course page and more on whether the program progressively develops problem-solving ability.
Can you clean unfamiliar data?
Can you design a reliable model?
Can you create measures that behave correctly?
Can you explain why a number changed?
Can you design a report around a business decision?
Can you publish and secure it?
Can you troubleshoot performance?
Can you understand how Power BI connects to Fabric?
Those questions provide a much stronger test of readiness than simply asking how many Power BI features someone has seen.
The Most Valuable Skill May Be Asking Better Questions
One of the most underestimated skills in business intelligence is the ability to ask better questions. A manager might say, “Why are sales down?” That sounds like a question, but it is actually the beginning of an investigation. A skilled analyst starts breaking the problem apart. Are sales declining everywhere or only in particular regions? Is the issue concentrated in specific products? Has order volume changed? Has average order value changed? Are high-value customers purchasing less frequently? Did pricing change? Have returns increased? Is the comparison period unusual?
Each question narrows the investigation. Power BI becomes significantly more valuable when it is used as a tool for answering these increasingly specific questions rather than as a tool for simply displaying information. This is also where AI can become useful. AI can help analysts explore possible explanations and move between questions more quickly, but the analyst still needs to decide which questions are relevant and whether the resulting evidence makes business sense. The ability to ask the right question will remain one of the most important analytical skills, regardless of how sophisticated AI becomes.
What Does the Future of Power BI Look Like?
The future of Power BI is unlikely to mean that dashboards suddenly disappear. Instead, dashboards are likely to become one component of a much larger analytical environment. The direction is already visible through the growing connection between Power BI, Microsoft Fabric, One Lake, Direct Lake, semantic models, real-time analytics, and Copilot. The broader trend is toward bringing data, analytical logic, AI assistance, and decision-making closer together.
This could change the daily work of BI professionals. Instead of spending most of their time manually assembling every element of a report, analysts may increasingly spend their time defining reliable business metrics, validating AI-generated insights, improving analytical models, designing decision experiences, and investigating more complex business questions. The mechanical side of analytics is becoming easier to automate. The value of human judgment is therefore becoming more visible.
Final Thoughts: Power BI Is No Longer Just About Dashboards
The easiest way to underestimate Power BI is to judge it by its charts. Yes, Power BI can turn spreadsheets into interactive reports. Yes, it can create dashboards that make business information easier to understand. But those are only the visible parts of a much larger analytical platform.
Behind the visuals are data transformation, data modeling, DAX, semantic definitions, security, governance, cloud architecture, and increasingly AI-assisted analytics. That is why learning Power BI in 2026 can be far more valuable than simply learning how to create a few attractive dashboards. The real skill is learning how to move from messy information to trustworthy insight. That skill can be applied across finance, sales, marketing, operations, HR, supply chain, manufacturing, technology, and almost any industry where organizations need to make decisions using data.
The most valuable Power BI professional of the future will probably not be the person who remembers every visualization by heart. It will be the person who can look at an unfamiliar business problem and understand how to find the right data, model it correctly, define trustworthy metrics, investigate what changed, communicate the result, and help people decide what to do next. That is the difference between building a dashboard and building business intelligence.