
How to Use Field Parameters for Dynamic Power BI Reports
Last updated on Nov 21, 2026
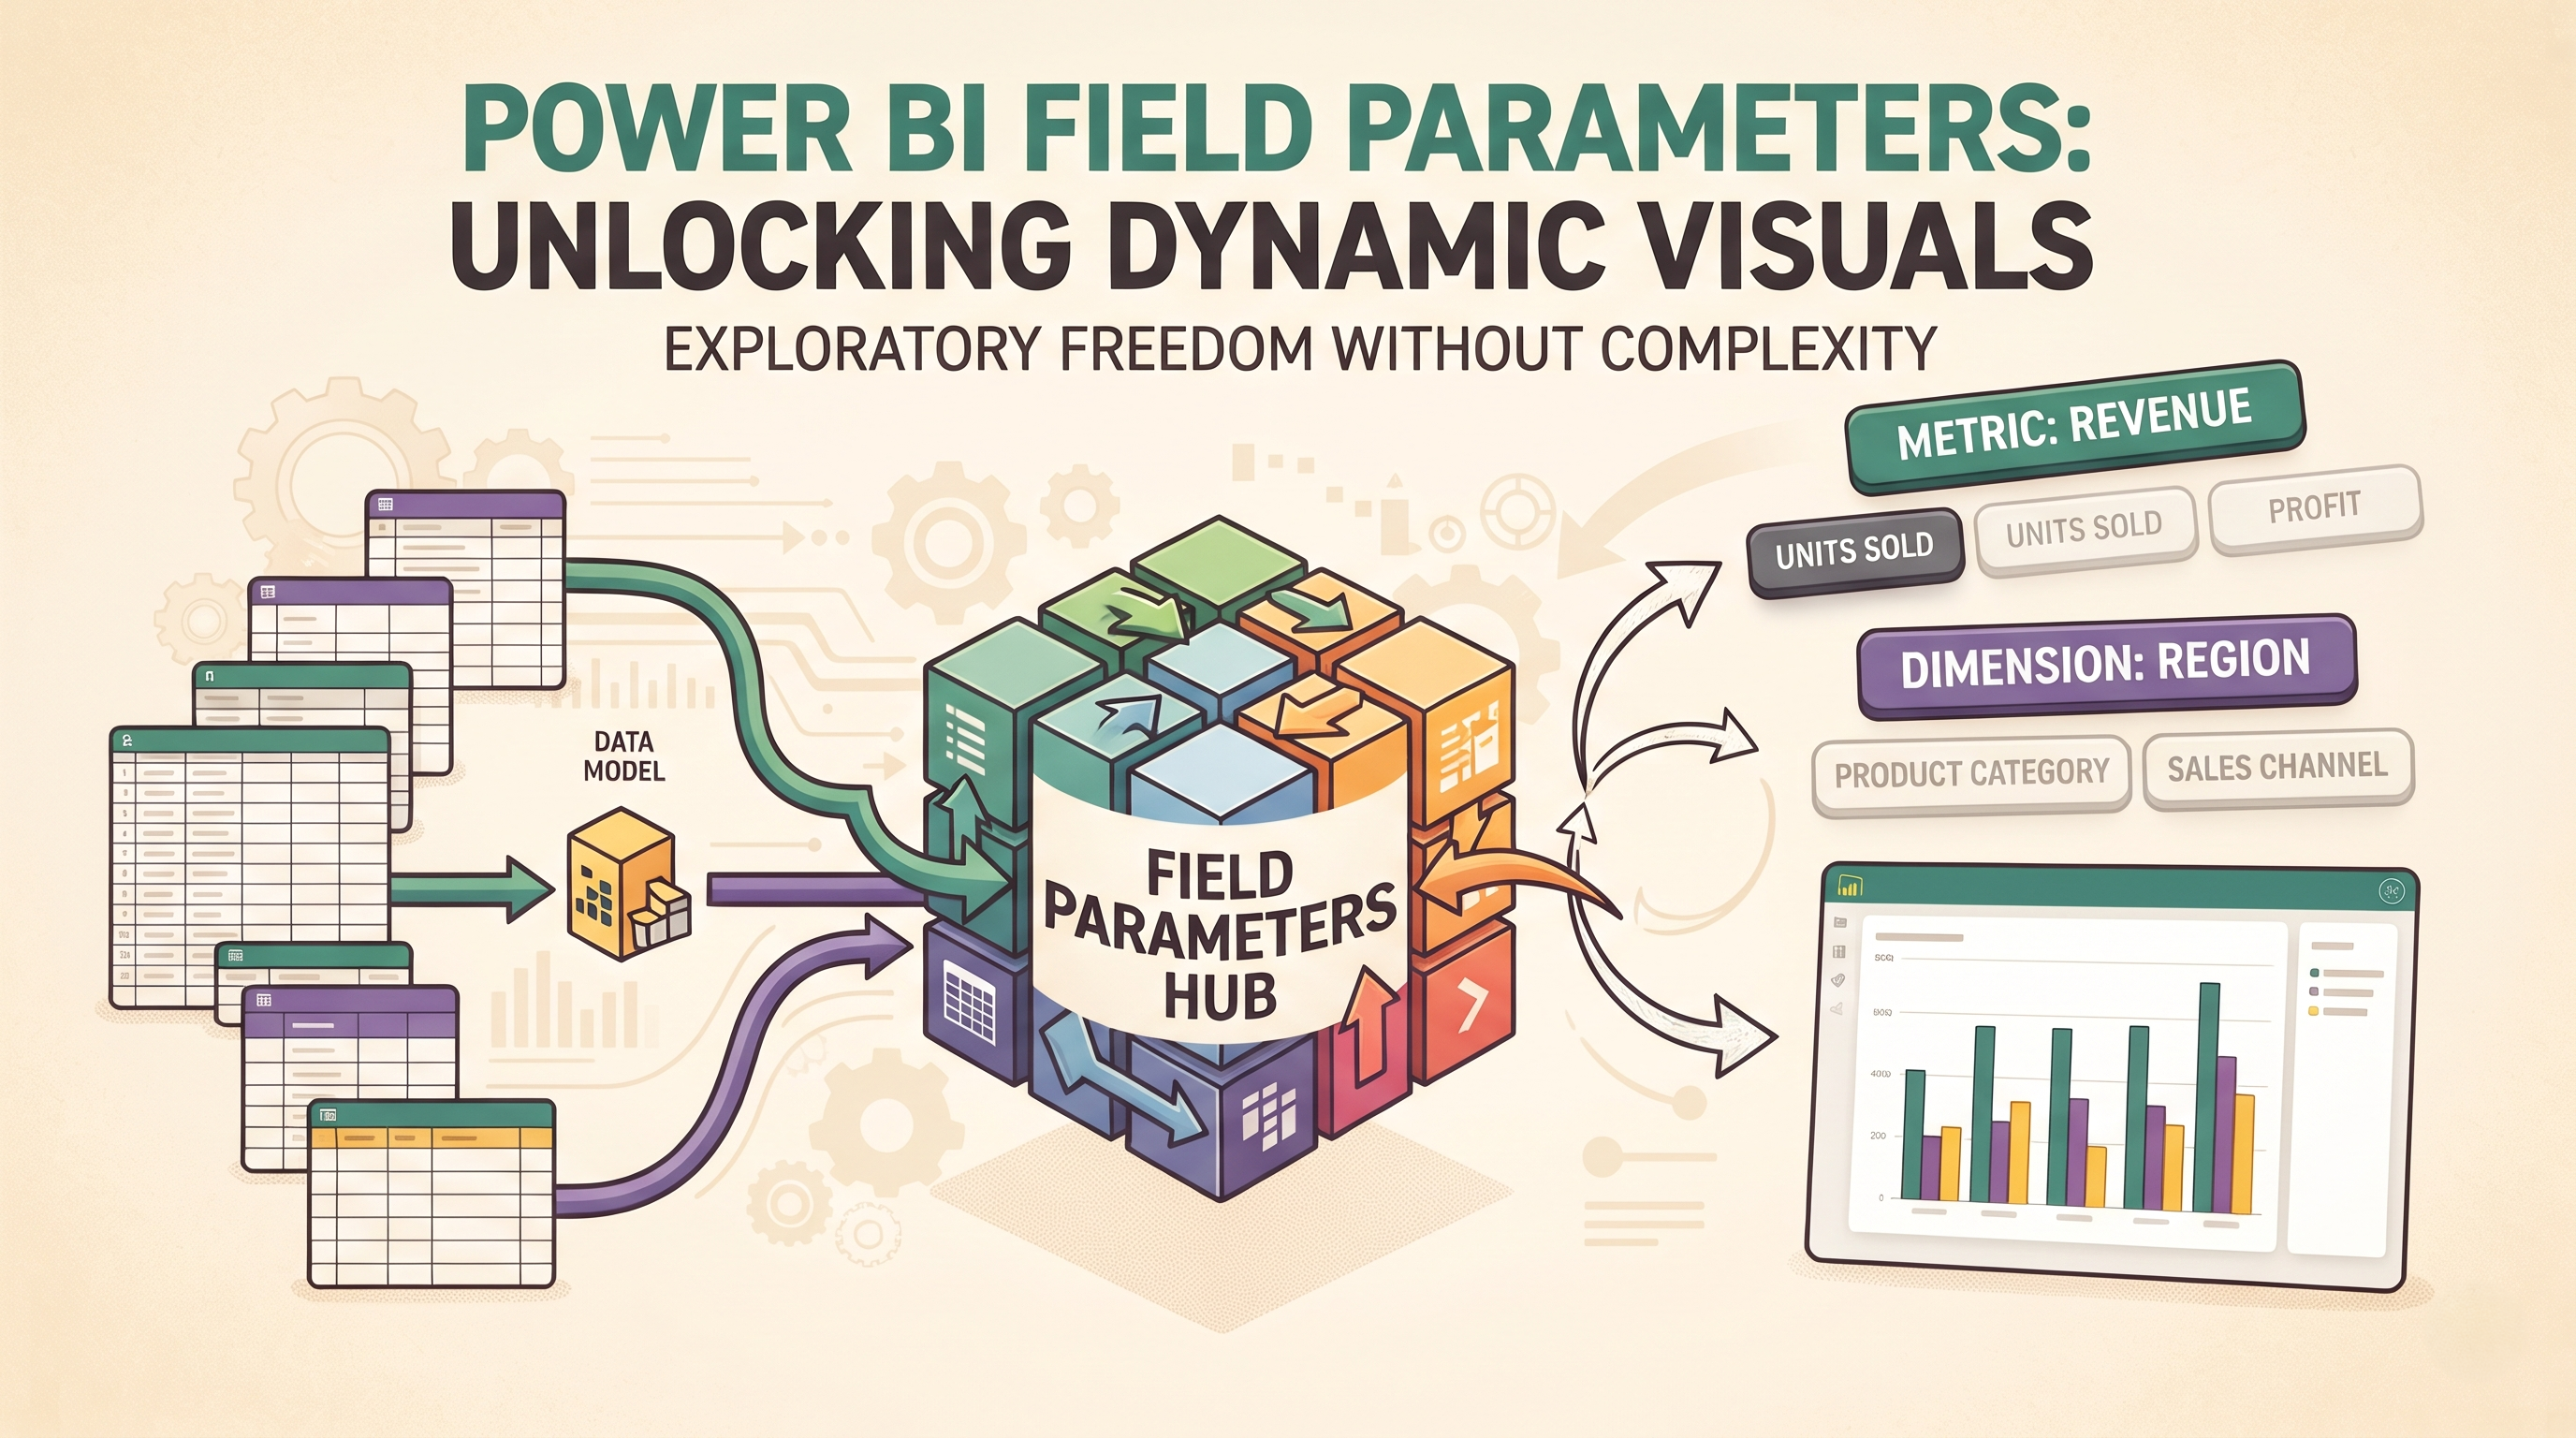
In today’s business intelligence environment, rarely does a static dashboard survive its first executive review. The sales director wants to see revenue by region, the marketing lead wants to change the exact same chart to see customer acquisition cost by channel, and the finance team wants to switch between total profit, gross margin percentage and unit volume, all on one screen and without cluttering the canvas with a dozen similar visuals. Historically, this level of self-service flexibility within Power BI required complicated workarounds, such as disconnected slicer tables combined with complex conditional logic, or stacked visuals controlled by dozens of overlapping bookmarks. Both approaches were maintenance nightmares and slowed down report performance.
Field Parameters changed the game in Power BI report design. Field Parameters were introduced to natively address the need for dynamic visual configuration. They allow report creators to allow end users to dynamically change the measures or dimensions being analysed in a visual, using a simple slicer. Instead of creating separate bar charts for each of the five different measures, you can have a single bar chart that will change according to your instructions. For all the professionals who want to master this kind of business level dashboarding from scratch, attending power bi online training sessions would be helpful.
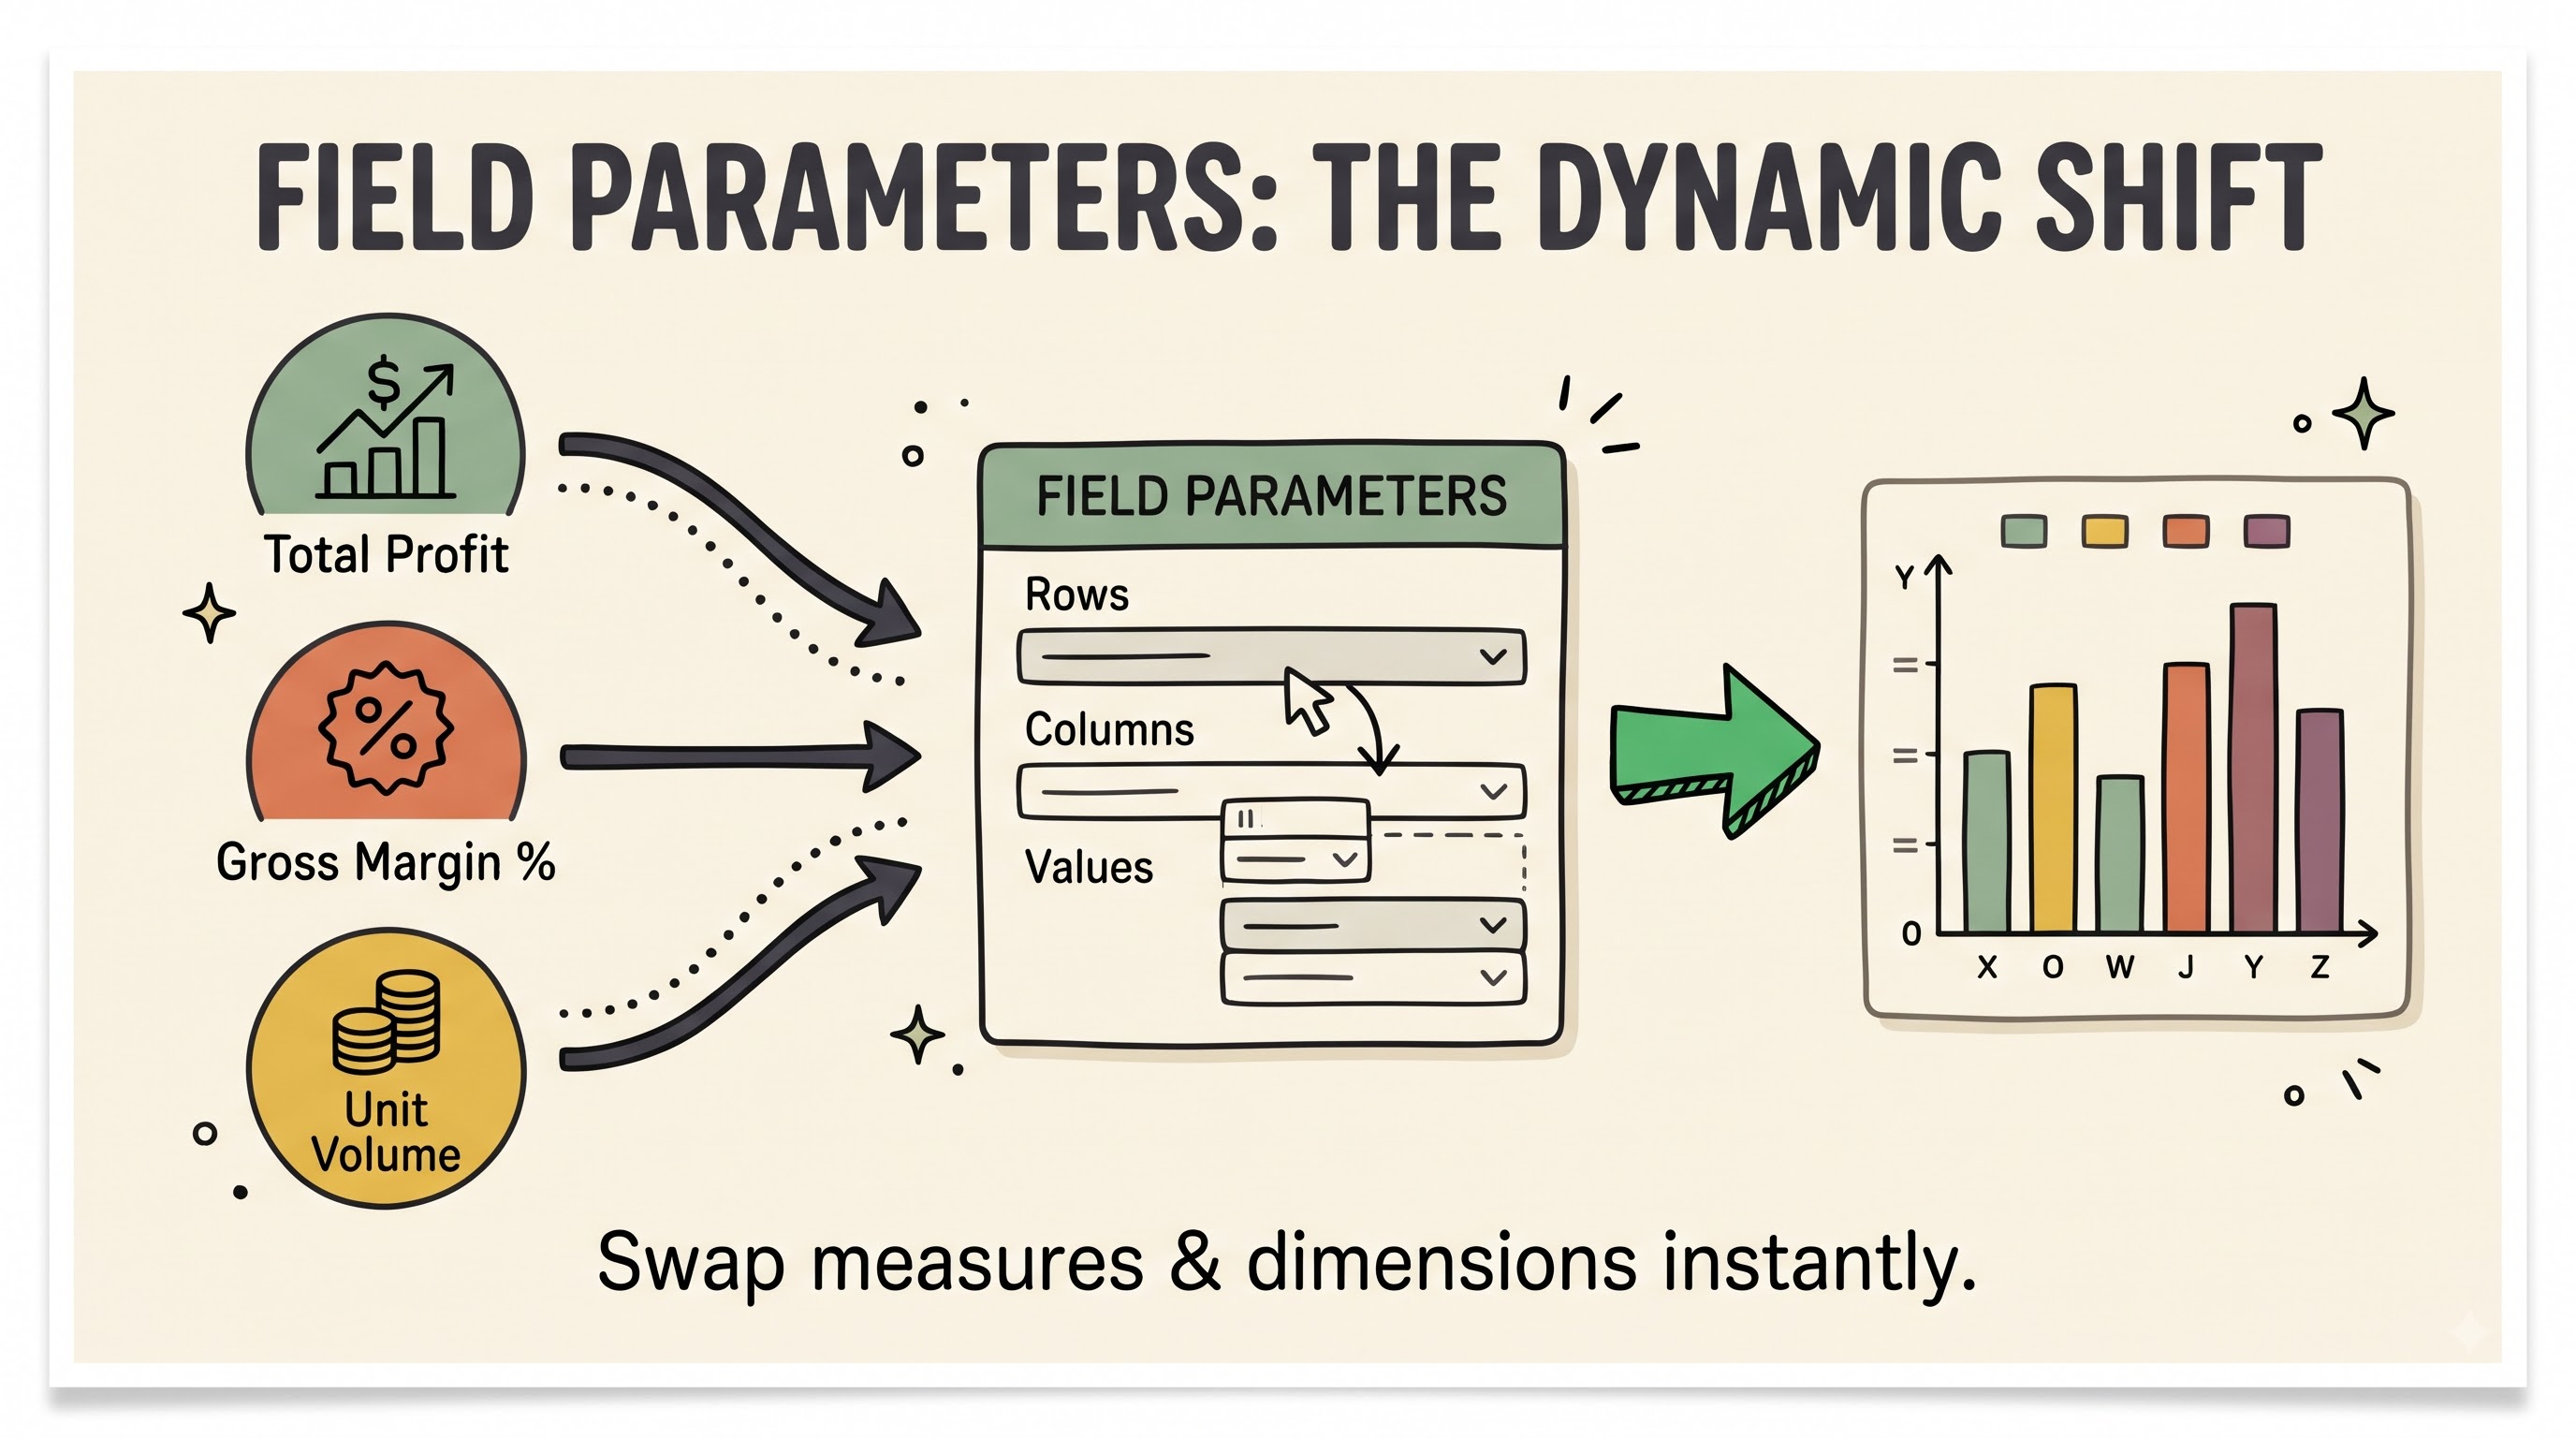
This manual will walk you through everything you need to know about Field Parameters in Power BI. We’ll explore the behind-the-scenes mechanics, step-by-step creation, advanced architecture patterns, performance considerations, and governance best practices.
Field Parameters: Understanding Why They Matter
A Field Parameter is basically a special table in your Power BI semantic model that serves as a dynamic reference to existing columns or measures. When a user selects an item from a slicer that is connected to this parameter table, Power BI will dynamically swap out the underlying field that is referenced in the visual’s axis, legend or values well.
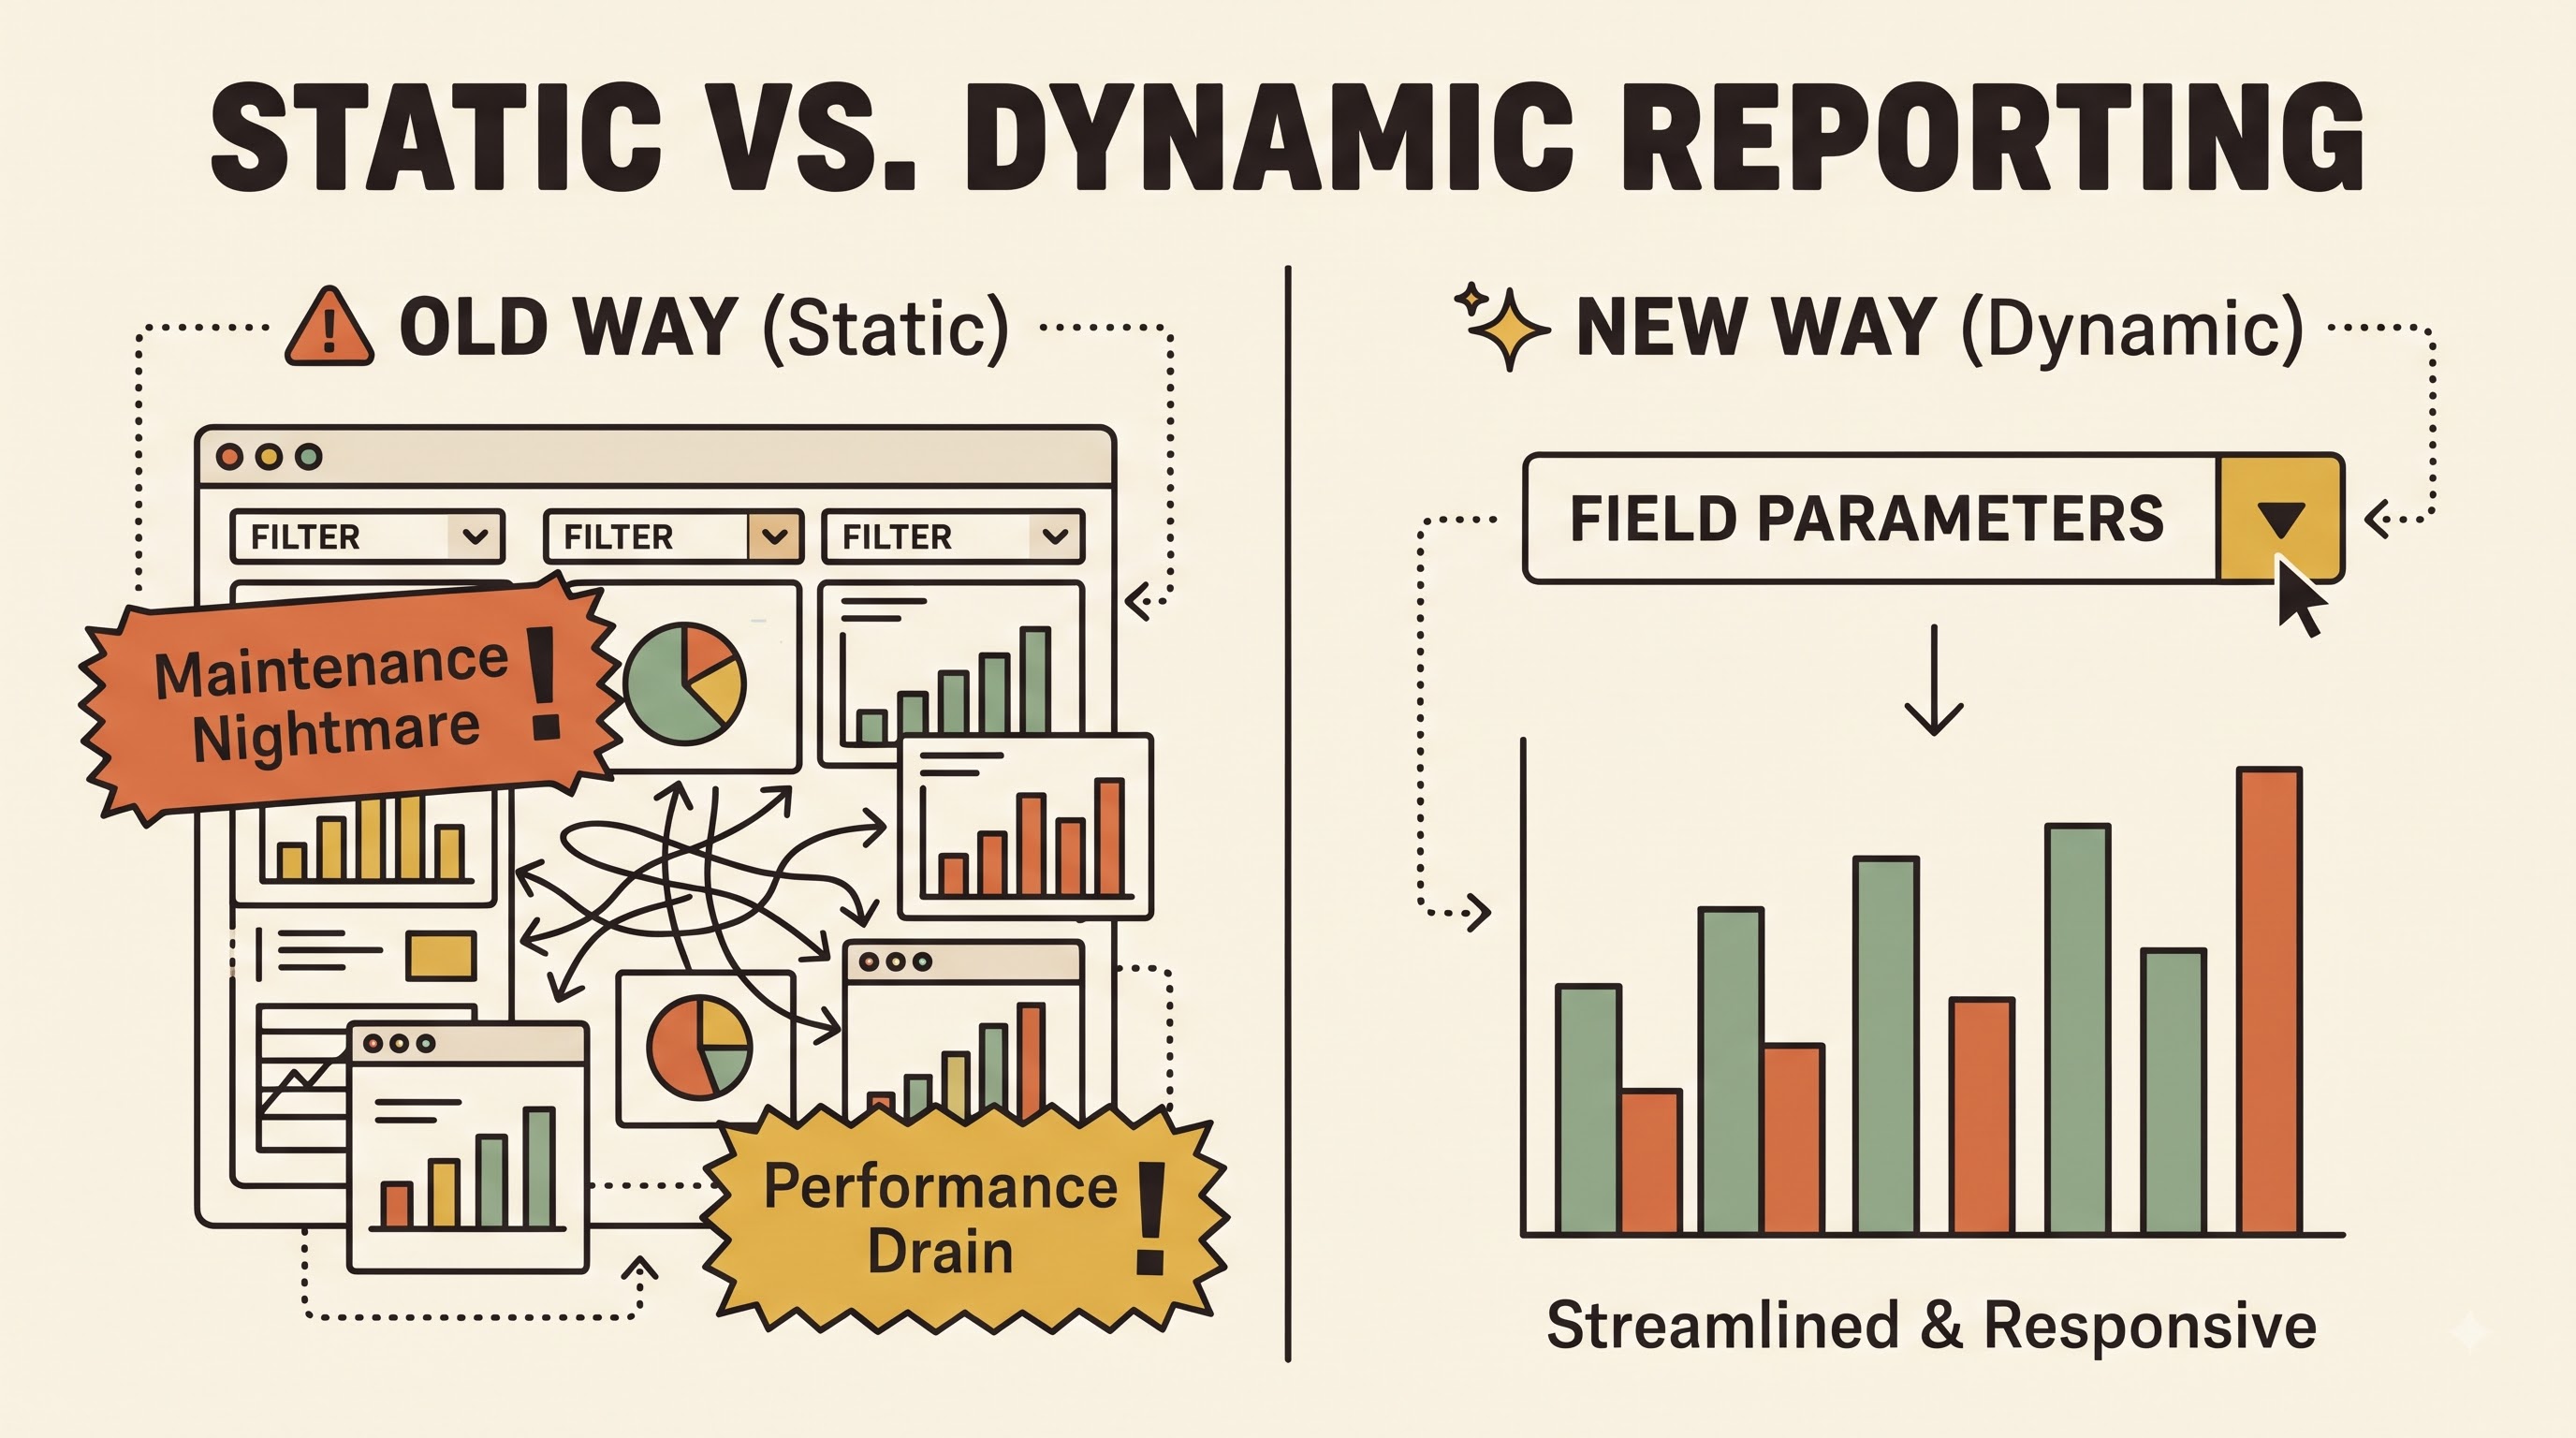
Prior to Field Parameters, developers have mainly relied on two techniques:
Bookmarking and Selection Panes: Creators would create multiple versions of the same visual and stack them on top of each other and build buttons that referenced bookmarks that toggled visibility. While this approach was seamless from the end-user visual perspective, it meant many more visuals on a page, degraded rendering performance, and any minor formatting change had to be copied to every hidden layer.
Disconnected Slicer Tables with Conditional Measures Developers would create a table manually that listed the names of the metrics and then write a long conditional expression that checked which metric was selected before returning the appropriate calculation. While it worked for swapping measures, it wasn’t as easy to swap categorical dimensions on an axis and it didn’t easily maintain individual number formatting across wildly different data types like currency, percentages, and entire numbers.
Field Parameters eliminates both bottlenecks. Because the parameter is directly referencing the actual metadata of your semantic model, each selected measure retains its native formatting, data type, and summarisation behaviour. Plus, since you only need one visual on the report canvas, report load times are drastically improved and ongoing maintenance is a snap.
Dynamic Reporting – Main Use Cases
Knowing how to build Field Parameters is as important as knowing when to use them. Great for business users who want exploratory freedom within a structured layout.
Dynamic Metric-Swapping
Executive dashboards are often over loaded with metrics. You can drop a Field Parameter that includes core Key Performance Indicators like Gross Sales, Net Profit, Operating Expenses, and Return Rate into the values well of a line chart or bar chart. This allows executives to inspect trends across multiple financial dimensions without having to scroll through endless pages. For each metric the correct currency symbol, decimal precision or percentage sign is shown automatically.
Dynamic Dimensionality Reduction
Analysts will often want to slice the same metric across different business hierarchies. For example, you could have a Field Parameter (based on a dimension) on the horizontal axis of a single column chart, so a user can swap between looking at performance across Country, Product Category, Sales Channel or Customer Segment. As the user selects other option in the slicer, the chart immediately re-aggregates the data based on the newly selected category.
Interactive Matrix Adjustment and Decomposition
For tabular reporting, finance and operations teams typically want wide, customisable tables. The secret to converting a standard Power BI matrix to a lightweight self-service pivot table is to place Field Parameters in both the rows and values sections of the matrix visual. Users can select which attributes to display as row groupings and which metrics to display as columns, customising the view for export to their immediate analytical needs.
Streamlining Dashboards for Different Audiences
With Field Parameters you can build one template for regional managers, product managers and marketing leads. We have 1 dynamic report that serves all 3 audiences at the same time instead of 3 different reports with the same layouts and slightly different groupings.
Step by Step: How to Make a Field Parameter
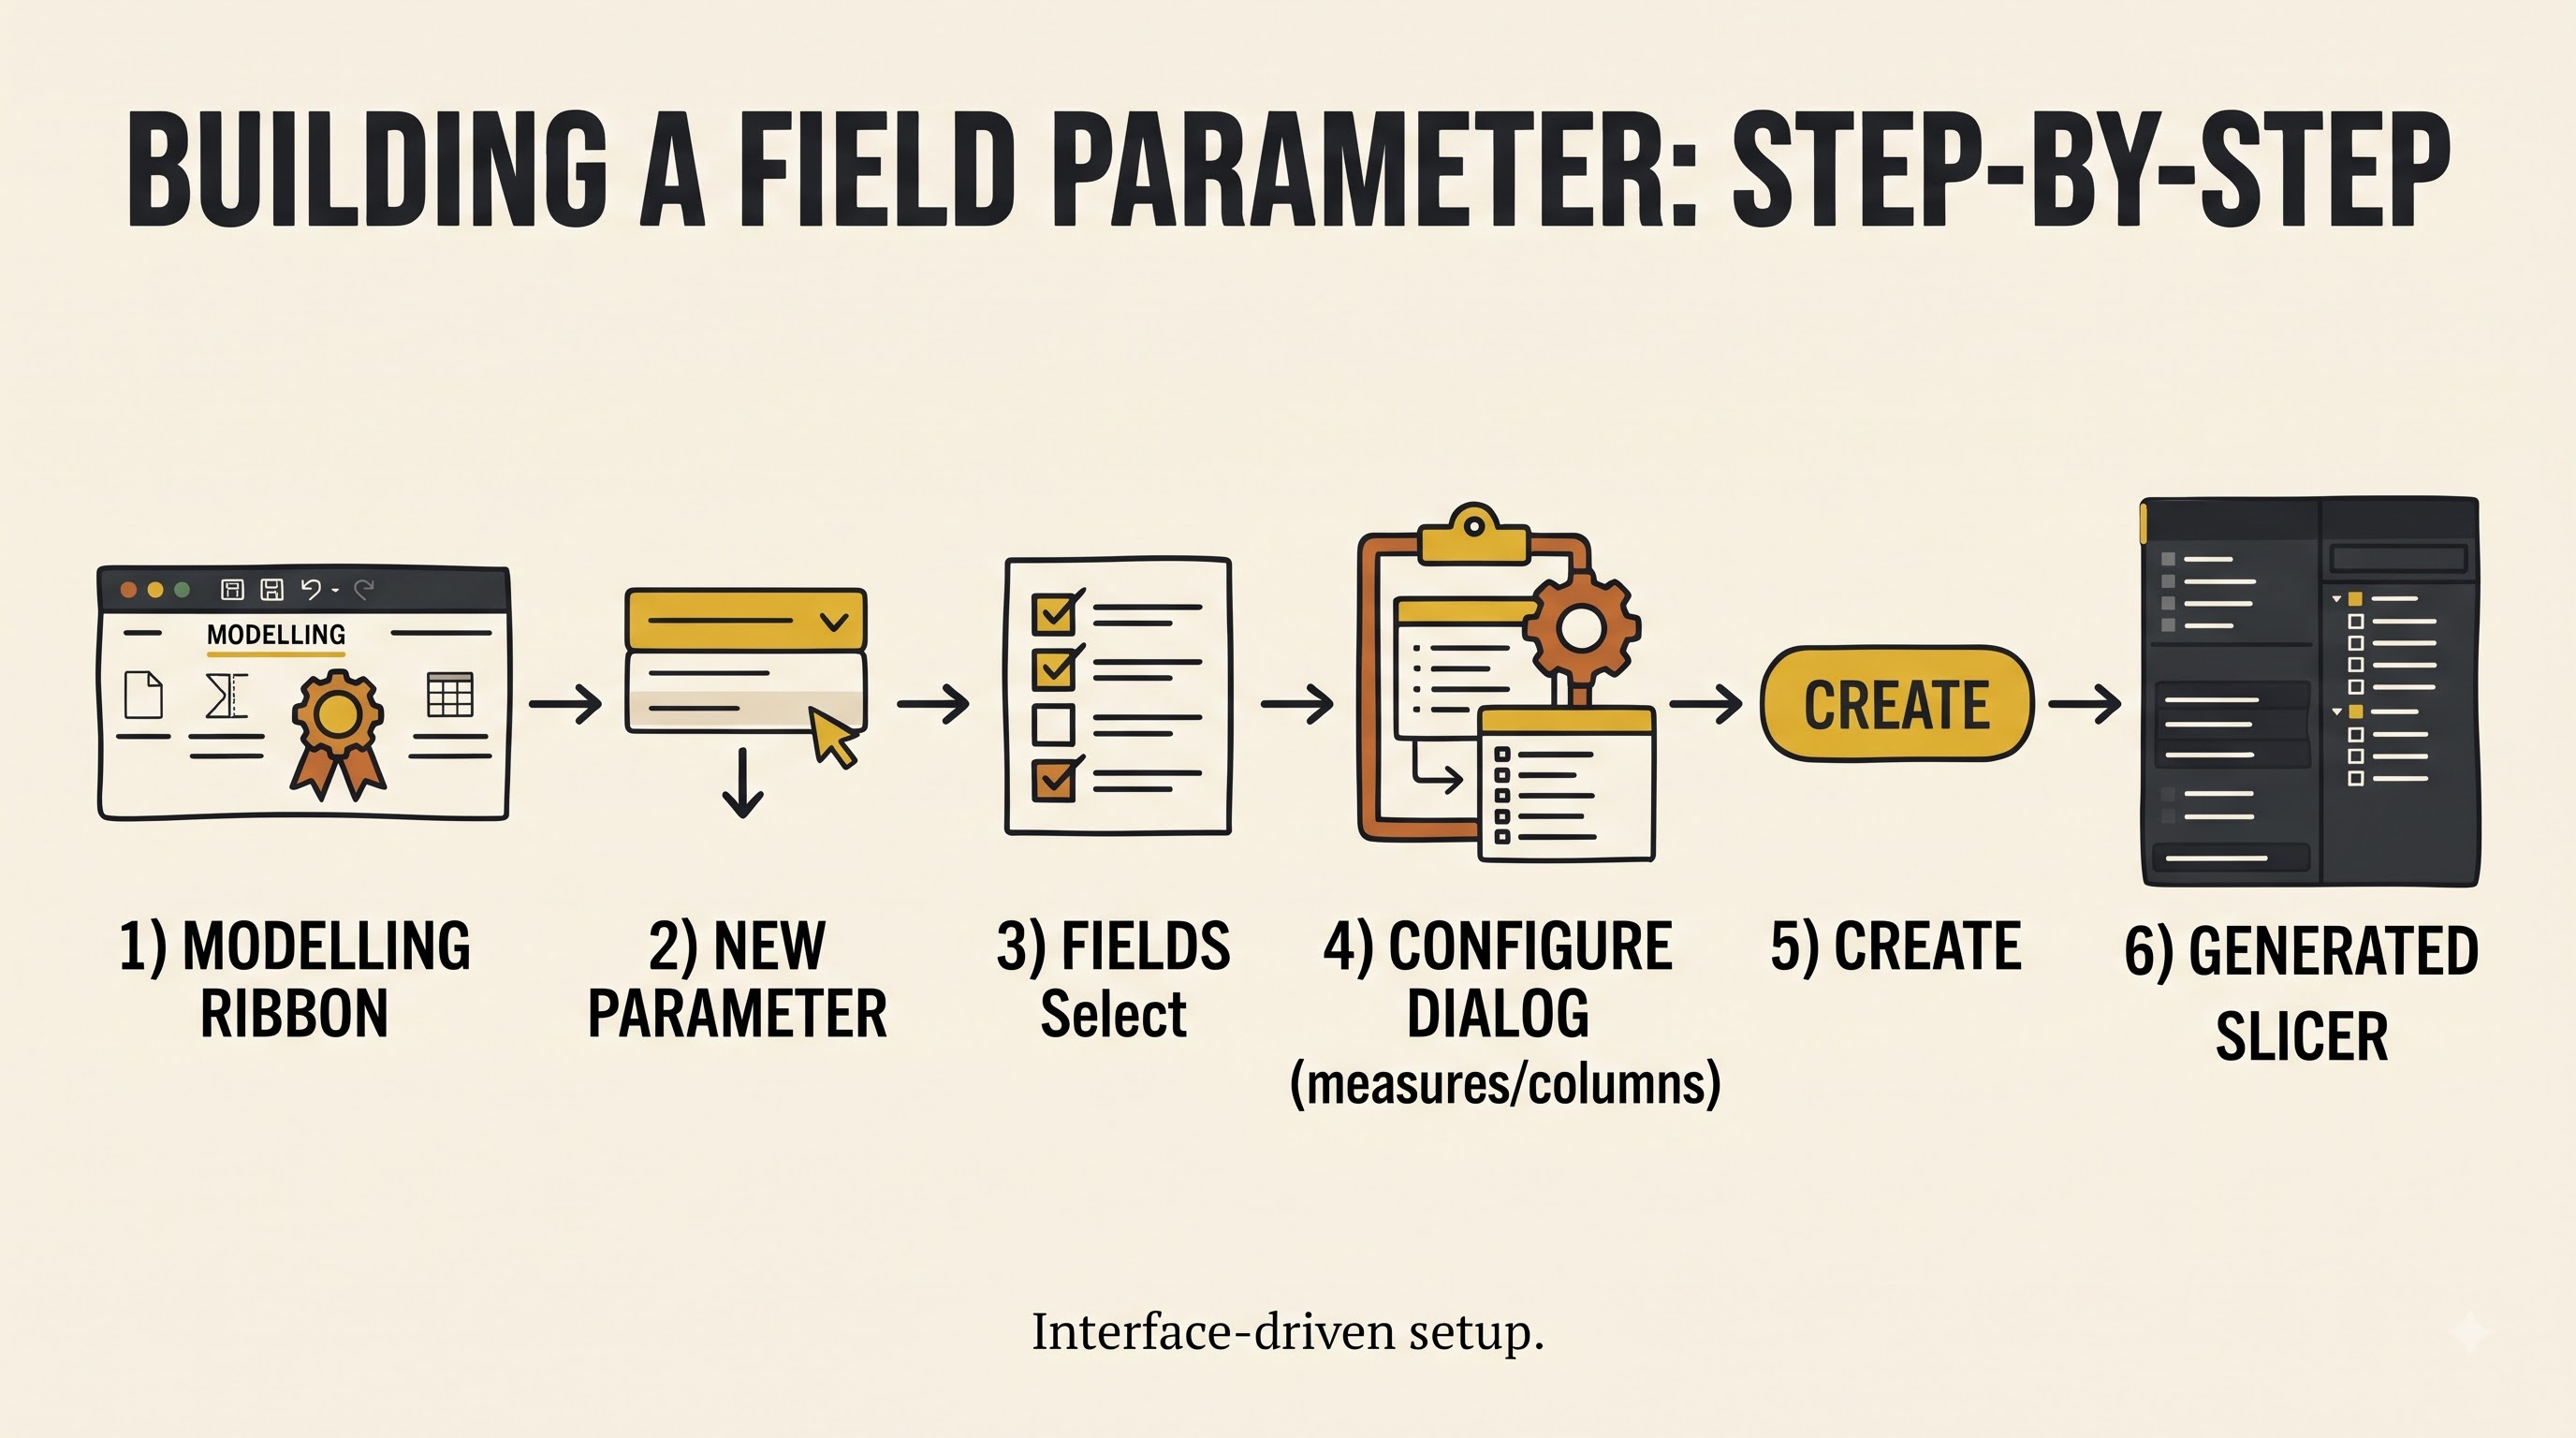
Creating a Field Parameter in Power BI Desktop is a guided, interface-driven process with little setup. Build your first dynamic visual following these steps.
Step 1: Ensure the feature availability
Field parameters are a standard feature in recent versions of Power BI Desktop. Make sure you are using a current release of Power BI Desktop so that the parameter creation options are available in the Modelling ribbon without having to enable legacy preview switches.
Step 2: Open Field Parameter Dialogue
Click on the Modelling ribbon at the top of Power BI Desktop. Under the What if or Parameters section, locate the New parameter drop-down menu, click it, and select Fields. This will invoke the Parameters configuration dialogue.
Step 3: Naming Your Parameter
In the Name box at the top of the dialogue, enter a clear, business-friendly name for your parameter. Note that this name will be used as the title of the generated table in your Data pane, and is often the default header on your report slicer. Names like “Select Metric” or “Analyze By” are good because they tell the end user how to interact with the control.
Step 4: Choose Fields or Measures
On the right side of the dialogue you will see the tables, columns and measures of your sematic model. Open the tables you want and select the tick boxes for the items you want in your parameter. You can pick and choose from tables - for instance, a Customer Region column from your Customer table and a Product Brand column from your Product table. When you select items they will appear in the box on the left under the Add and reorder fields section.
Step 5: Rename and Reorder display labels
In the Add and reorder fields list you can drag and drop items to set the exact order of how they will appear in your slicer. Also, if your underlying model columns have technical names like "Cust_Seg_Name" or "Total_Rev_YTD", you can double-click any item on this list to give it a clean, user-friendly display label like "Customer Segment" or "Year-to-Date Revenue". Changing the label name in the parameter won’t change the original field name in your semantic model.
Step 6: Setup Slicer Creation
To have Power BI add a configured slicer right away to your active report canvas, be sure to select the Add slicer to this page check box at the bottom of the dialogue window. Click Create to create the parameter.
Step 7: Binding the Parameter to a Visualisation
After you create it, you will see a new table icon on your Data pane with the name of the parameter you chose and a slicer on your canvas. Choose or build the visual you want to animate – a clustered column chart, a line chart... Drag the Field Parameter column from the Data pane to the appropriate field well of the visual. If your parameter is dimensional, then drag it to the X-axis or Legend well. If your parameter has measures, drag it to the Y-axis or the Values well.
Step 8. Test the interaction
Click through the various choices on your newly added slicer . Notice how the visualisation dynamically updates its axis titles, data points, tooltips, and number formatting based on each selection.
Field Parameters – Advanced Methods
With the basic concepts of Metric and Dimensional switches in place, you will find it easy to integrate the Field Parameters with the Data Modeling capabilities of Power BI, which are taught extensively in practical power bi classes online.
Categorised Slicers Grouping Field Parameters
In enterprise models, you might want to provide users with twenty different metrics across sales, inventory and customer service. Too many options, twenty on one flat slicer, is too much for the user. A Field Parameter is essentially a calculated table in your semantic model, so you can add another categorisation column directly in the parameter table definition. You can add a second slicer for the Category column by giving each metric a group name such as “Financials”, “Operations” or “Marketing” or use a hierarchical slicer so users can cleanly expand and collapse groups of metrics.
Multiple field parameters in a single visual
You can use more than one Field Parameter in a visual. You can add a dimension parameter on the X axis, a secondary dimension parameter in the Legend and a measure parameter on the Y axis. This transforms a single chart into a multi-dimensional exploration engine, enabling a user to analyse Profit by Region split by Customer Tier, and then instantly switch to Units Sold by Product Line split by Sales Channel.
Slicers synchronisation across report pages
If you have multiple pages on your executive report, for example an Overview page, Trend Analysis page and a Detailed Breakdown page, the Sync slicers pane allows you to sync your Field Parameter slicer across all pages. If the user selects “Net Margin” on the Overview page and then goes to the Trend Analysis page, all visuals using that parameter will automatically update to reflect Net Margin, giving a seamless, application-like experience.
Controlling Default Selections and Multi-Select
For single select Field Parameters, if nothing is selected in a slicer, Power BI will by default display the first item in the parameter’s sort order. Format slicer settings to allow Single select under Selection controls to stop users from accidentally clearing all selections and breaking visual layouts. However, if you are using a Field Parameter inside a Matrix visual or a clustered column chart where you want to compare two metrics side-by-side, keep Single select turned off so that users can hold the Control key and select multiple metrics at the same time.
Dynamic Visual Headings
When a Field Parameter changes, Power BI will automatically update axis labels, but custom visual titles may not update unless they are set up correctly. You can build a dynamic title measure that reads the current display label from the Field Parameter column and concatenates it with descriptive text. For example, if you select Net Profit, the title would show "Regional Performance by Net Profit." If you bind this measure to the Title text property of the visual, the narrative header will be always in sync with the data being displayed.
Architectural Limitations and Things to Consider
Field Parameters are very flexible, but they do have some rules that are dictated by the engine. Knowing these boundaries helps to avoid unexpected behaviour during development.
Constraints on the Drill-Down Hierarchy
When you add a multi-dimensional Field Parameter to an axis, Power BI will consider the active selection as a single field and not as an automatic drill-down hierarchy. However, if the user picks multiple dimensions in a multi-select slicer when the parameter is placed on a Matrix row or chart axis, Power BI automatically enables drill-down buttons such that the user can drill-down from the first selected dimension to the second.
DirectQuery and Live Connection Implications
Field Parameters work seamlessly in Import mode and Direct Query models. When creating a composite model that connects to a remote Power BI semantic model or Azure Analysis Services using DirectQuery, you must enable the creation of the local model so Power BI can store the metadata table that defines the parameter.
Conditional Formatting Details
If you plan to use rule-based conditional formatting (e.g., colour bars red if below target and green if above target) on a visual being driven by a measure Field Parameter, you need to plan this out. Since the underlying measure is dynamic, static rules based on thresholds might not be appropriate when going from a currency metric in the millions to a percentage metric from zero to one. In such cases, create a separate dynamic colour measure that checks the active parameter selection and returns the correct colour code for each specific metric.
Compatibility of visual elements
Almost all the core Power BI visuals such as bar charts, column charts, line charts, area charts, scatter plots, tables, matrices and cards support Field Parameters. Some custom visuals from AppSource specialists or third parties might not fully support the dynamic metadata switching protocol and might not render or display generic column headers. Always test your custom visuals thoroughly when used with Field Parameters.
Best practices for building dynamic reports
Complete freedom for users to swap out every axis and metric can backfire if not balanced with thoughtful user experience design. Use these best practices to make your dynamic reports intuitive and fast.
Purposeful and curated parameter lists
Don’t try to put fifty columns into one Field parameter. Choice paralysis hurts user adoption. Organise related metrics and dimensions logically, and restrict each parameter slicer to five to eight high value options that directly respond to the core business questions of that report page.
Maintain Visual Semantics Consistency
Make sure that all the items within a single Field Parameter make logical sense in relation to the visual. For example, do not stack additive metrics, such as Total Revenue, with non-additive ratios, such as Average Order Value, in a stacked bar chart because stacking percentages will lead to inaccurate visual proportions. Design your parameter items based on the mathematical type of the chart type you selected.
Build Clean Slicer Layouts
Field Parameter slicers are an important way to navigate your visuals, so make them look like modern user interface tabs rather than vintage dropdown filters. Set slicer orientation to Horizontal (or use the modern Tile slicer layout), position the slicer directly above the visual it controls, and use subtle background shading and border accents to signal interactivity.
Parameter Behaviour Documentation in Tooltips
People not yet familiar with dynamic Power BI reports may not immediately realise that clicking on a button above a chart changes the entire data set being plotted. Place clean header subtitles or subtle informational tooltip icons near your parameter slicers to guide first-time viewers on how to customise their view.
Common Problems And Their Solution
Even seasoned developers sometimes run into odd quirks working with Field Parameters. This is how to solve the most common problems.
Slicer displays technical column names instead of custom labels
If you have renamed a column in the Field Parameter dialogue, but the slicer still shows the original technical name, check which column from the parameter table is put into the Field well of the slicer. A Field Parameter table has three underlying columns. One is the visible display name, another is the hidden metadata reference to the actual field, and the last is the numeric sort order. Use the primary display name column in the slicer. Ensure that the Sort by column property of the primary display name column is correctly bound to the numeric order column.
Slicer change does not refresh visual
If clicking options in your Field Parameter slicer does not change the visual, go to the Format tab on the ribbon and select Edit interactions. Make sure that the slicer for the target visual is not set to “None” (the block icon). Also make sure that you dragged the Field Parameter itself into the visual’s axis or values well and not one of the individual base measures by accident.
Unexpected Sorting of Chart Axis
If you switch between different dimensions, for example from Month Name to Product Category, you may notice that the chart sorts by the metric value instead of chronological order. Note that sorting behaviour is tied to the Sort by column configuration in your data model for the underlying column. Ensure that chronological columns such as Month Name are sorted correctly by Month Number in the Data view so that they render chronologically when selected via a Field Parameter.
Conclusions
Field Parameters are a great new feature that enables you to build scalable user-centric PowerBI reports. They allow report developers to provide richer analytical experiences with far less maintenance overhead by replacing rigid, multi-visual workarounds with clean, metadata-driven interactivity. No matter whether you would like to enhance your KPI dashboard for executives, create an exploration matrix that would be self-service-oriented, or combine different departmental reports, knowing how to use Field Parameters effectively is extremely important. This knowledge can be gained either through experience or via a power bi course online.