
Masterclass: Building Enterprise Data Strategies with Tableau
Last updated on Jul 9, 2026

The reality today is that data is not the problem but clarity is. It is commonplace for businesses to capture millions of rows of transactions, logs, and interactions, yet much of this huge ocean of data can remain locked away due to query languages or even isolated inside spreadsheets.
Tableau becomes the very first stepping stone in this type of environment, where data in the form of rows and columns get converted into meaningful visual stories. In order to navigate through such an architecture, one needs structured learning, thus making basic learning of tableau developer training extremely important.
1. The Internal Framework: Behind the Scenes in Tableau
In order to create high-performing dashboards, one needs to know what goes on inside Tableau beyond the user interface whenever we drag-and-drop fields to the canvas. There are three major pillars on which the internal framework of Tableau is built.
VizQL (Visual Query Language)
A core feature of Tableau software is VizQL, a proprietary language used to convert user actions using drag-and-drop technique into semantic database queries. Conventional business intelligence systems operate under such a principle that the user needs to create a query, receive an organized data table and select a type of chart he/she wants to build on this data. VizQL integrates all three processes. The moment you drop a dimension on the shelf, VizQL generates both, a backend query (e.g., SQL SELECT statement with AGGREGATE and GROUP BY clauses) and visual geometry (bars, marks, lines) on the screen.
Hyper In-Memory Data Engine
Hyper technology is a solution developed to work with large amounts of data in the modern age. It represents Tableau’s high-performance in-memory data engine. Hyper uses optimized columnar data storage format. Traditional databases store data in row format and perform excellently in transaction processing (adding one client record, for example). While a columnar database stores data in columns that makes the process of analytical processing significantly faster. If you need to calculate the average sales price out of 50 million records, a columnar database will read only the "Sales" column from the hard drive, completely ignoring the address, name and date fields entirely.
Live Connection or .Hyper File?
While building the data source in Tableau, you will be faced with an essential decision:
Live Connection: The queries generated by VizQL in Tableau are sent directly to the source database in real-time. Live connections are ideal when dealing with constantly changing data (e.g., live dashboard) or working with highly scalable cloud data warehouses like Snowflake, Google BigQuery, or Amazon Redshift.
Extracts (.hyper files): In this case, the queries run on the data source only once, and then Tableau makes snapshots of this data and saves them in the compressed columnar format (.hyper file). Extracts can dramatically improve performance in case you work with slow legacy databases or complex file-based data sources (e.g., Excel), or offline analysis is required.
2. Advanced Data Modeling: Going Beyond Simple Joins
Traditional enterprise reporting does not use simple flat files. Previously, analysts used to join complex data through writing complicated SQL joins or denormalizing data, causing problems of duplicated data and different levels of detail. With Tableau, you have a multiple layers data modeling solution for that problem.
Relationships (Logical Layer)
Relationships were created as replacements for inflexible physical joins. Relationships appear in the "Logical Layer" of Tableau's data modeling canvas. In the case of the creation of relations between tables, there will be no flattening joined table immediately but the unique identity and Level of Detail (LOD) of each separate table will be saved.
Tableau automatically determines which type of join should be used depending on your analysis requirements based only on the fields present in your worksheet. It ensures that there are no data duplication mistakes when many-to-one relationships result in a fine-grained table duplicating parent records.
Joins and Unions (Physical Layer)
After double-clicking on the logical table, you access the "Physical Layer," where you can apply physical operations:
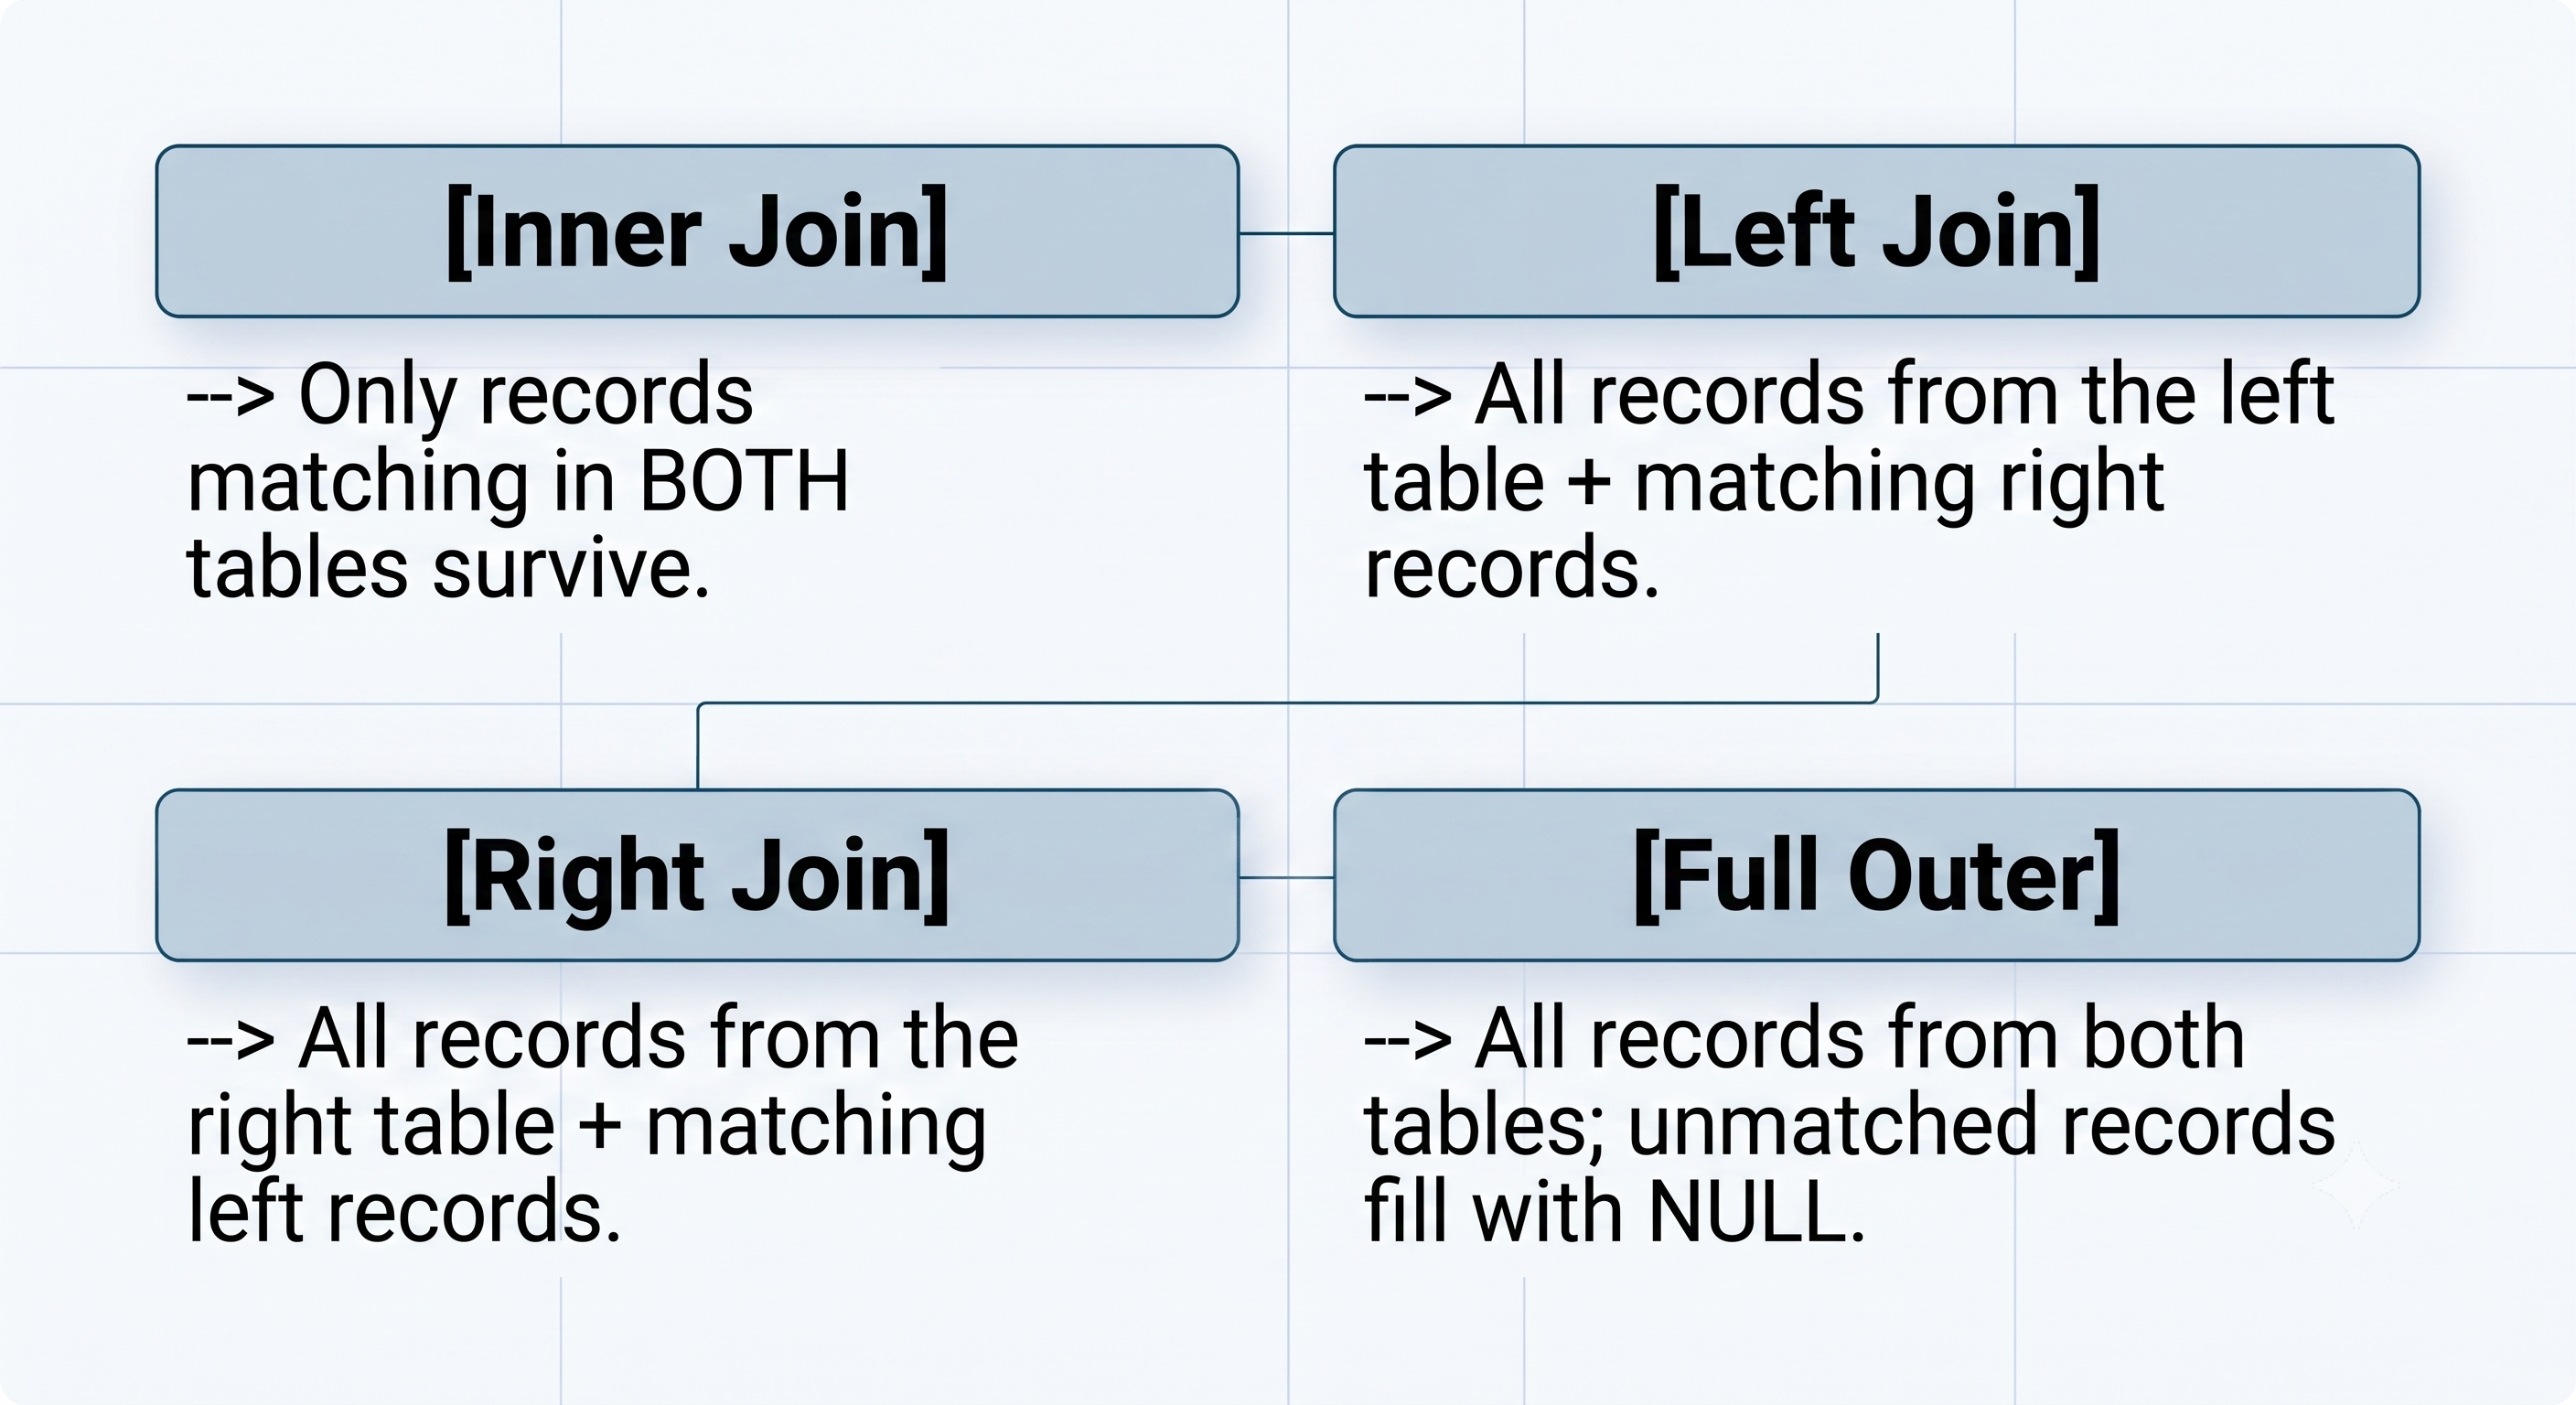
Unions join rows of tables together. This feature can come in handy when there is a need to combine data which is spread out in identical structures. For instance, one can have twelve Excel files on monthly sales data like Sales_Jan.xlsx, Sales_Feb.xlsx and unite them into one unified data set.
3. The Order of Operations: Tableau's Execution Pipeline
One of the most frequently asked questions by development engineers regarding Tableau is related to filtering. Why did not the Top 10 filter update once one chose a specific region? It all comes down to Tableau Order of Operations, the specific order in which Tableau evaluates operations.
Pipeline order:
1. Extract Filters
2. Data Source Filters
3. Context Filters
4. Set Filters / Fixed LOD Expressions / Conditional Filters
5. Dimension Filters
6. Include & Exclude LOD Expressions
7. Measure Filters
8. Table Calculation Filters / Forecasts / Trend Lines
The Order of Operations
Knowing how this order works is key to solving most filter problems:
The Top N vs Dimension Filter Issue: Say that we are trying to get "Top 10 Products by Sales" with a restriction to "Europe" only. If we use two filters in the Filters Shelf - Product Name as a Top N filter and Region as a regular filter, Tableau will do these operations concurrently at Step 5. The Top N operation will calculate the top 10 products and after that Region will remove those which were not sold in Europe, resulting in less than 10 products. The way out here would be right-clicking the Region filter and choosing Add to Context, thus moving it to Step 3 and getting our desired result.
Filters based on Table Calculations: These types of filters happen to run at Step 8, which is the last step in Tableau's pipeline. Using table calculations (such as LOOKUP(), WINDOW_SUM(), TOTAL(), etc.) as a filter means that we don't actually filter the data from the underlying cache, but rather hide the marks from the visualization. It is important to understand when working with running totals or month-over-month growth, when we need to hide some months from the view but still have historical data for calculating the current month percentage change.
4. Masterclass Calculations: LODs & Table Calculations
Calculations transform the data inputs into useful metrics that can be used to make decisions. Tableau categorizes calculations in three forms of calculations, which include: Row level calculation, LODs calculation, and table calculation. Understanding these various advanced calculation techniques can be learned through structured learning of the tableau course online.
Difference between Row Level & Aggregate Calculations
A row level calculation gets computed independently for each record in your data source. In other words, [Profit] / [Sales] when computed row level, results in computing margins for each individual transaction. On the other hand, an aggregate calculation is computed depending on the grain level as dictated by your dimension variables on your worksheet. SUM([Profit]) / SUM([Sales]) tells Tableau to sum up profits for your current level, sum up sales, and then divide.
Level of Detail (LOD) Expressions
LOD expressions make it possible to perform calculations based on a certain level of detail irrespective of the current dashboard dimension context.
FIXED: The result of the aggregation is calculated using only the explicitly mentioned dimensions within the formula.
FIXED [Region] : SUM ([Sales])
In this case, the sum of sales is being calculated per region regardless of whether the sheet calculates cities or the whole world.
INCLUDE: The result of the aggregation is calculated based on the dimensions on the sheet as well as the dimensions listed in the formula. Great tool for calculating average sales per customer per region since the calculation goes down to the individual customer level.
EXCLUDE: Excludes the dimensions from the calculation in order to aggregate the results.
Table Calculations
Table calculations do not use the backend database for data extraction; rather, table calculations operate solely using the local data cache provided back to your computer browser or desktop environment through the calculation of values by looking at the results table.
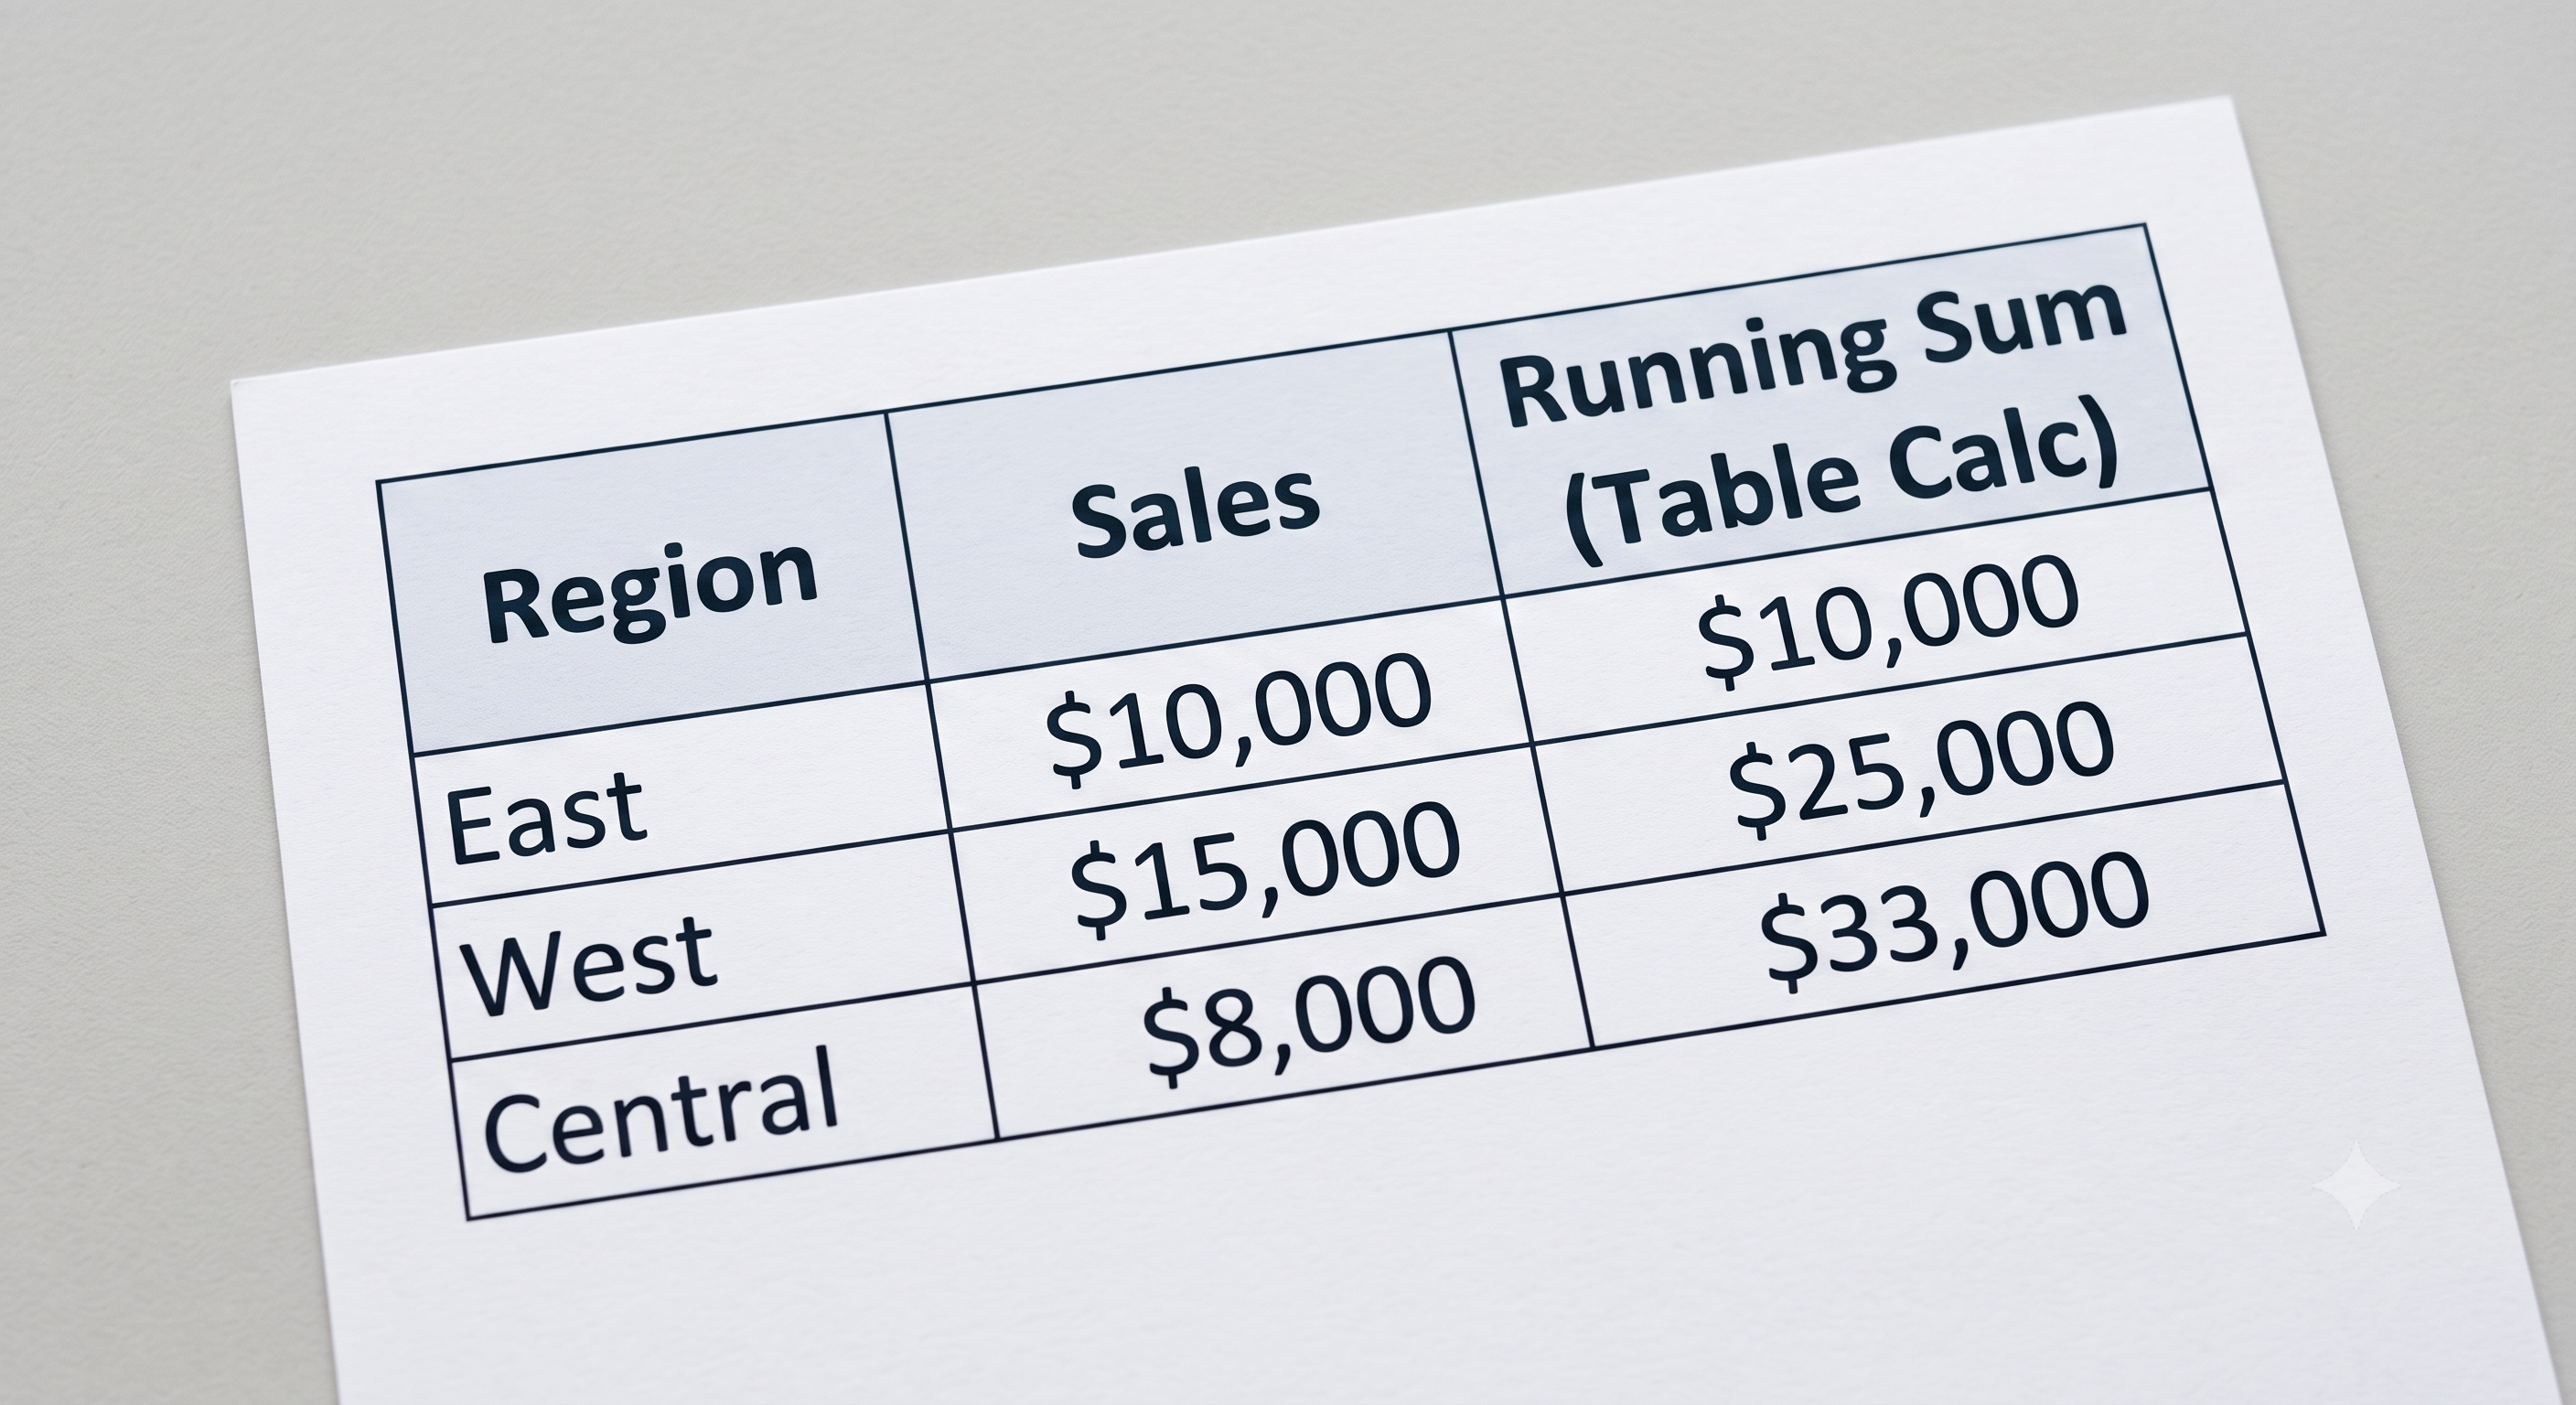
Table calculations utilize functions such as INDEX(), RANK(), LAG(), or WINDOW_AVG() but are highly dependent on how you configure the settings for Addressing (the orientation of the calculation) and Partitioning (the reset point of the calculation).
5. Performance Optimization Engineering
A dashboard which fails to work fast is a dashboard that is not used. When it comes to dealing with thousands of business records, design inefficiencies are bound to cause problems with regards to speed. Business institutions seek to avoid such challenges by enrolling in specific tableau developer training at OnlineITGuru.
Optimizing Your Data Source
Make It Narrow: When dragging in a source data set that has 150 columns while you have just 8 on your dashboard, your memory performance will degrade. You can hide all unused fields using the Hide all unused fields button in the data pane.
Aggregate Data for Extraction: Your source database might collect your data in seconds, but your dashboard will be showing monthly trends; therefore, check the box “Aggregate data for visible dimensions” when extracting the data.
Strategic Approach to Calculations
Booleans & Integers are Faster: Computers operate faster on numeric values (1, 0) and booleans (TRUE, FALSE) rather than string variables ("High", "Medium", "Low"). Replace your string operation by converting them into:

CASE Optimized from IF-THEN: In situations where you need to do simple evaluations for equality with a single variable against several static options, consider using a CASE statement instead of nested IF/ELSEIF logic. This lets the VizQL compiler create more efficient database code.
Dashboard Layout Optimization
Lower Your Mark Count: Take a look at the bottom left of your Tableau window for the mark count. A scatterplot of 400,000 data points means that you need to render 400,000 vectors in your browser. Make sure to keep your mark count low using aggregation, heatmaps, or guided action filters.
Guided Tooltips Usage: Adding complex, multi-sheet nested tooltips (viz-in-tooltip) forces Tableau to spawn hidden background worksheets dynamically on hover events. Use these features sparingly on valuable summary dashboards and not densely packed data tables.
6. Enterprise Deployment & Governance
While building the best dashboard is one part of the battle, deploying it in an enterprise environment involves secure distribution to thousands of users on Tableau Server or Tableau Cloud.
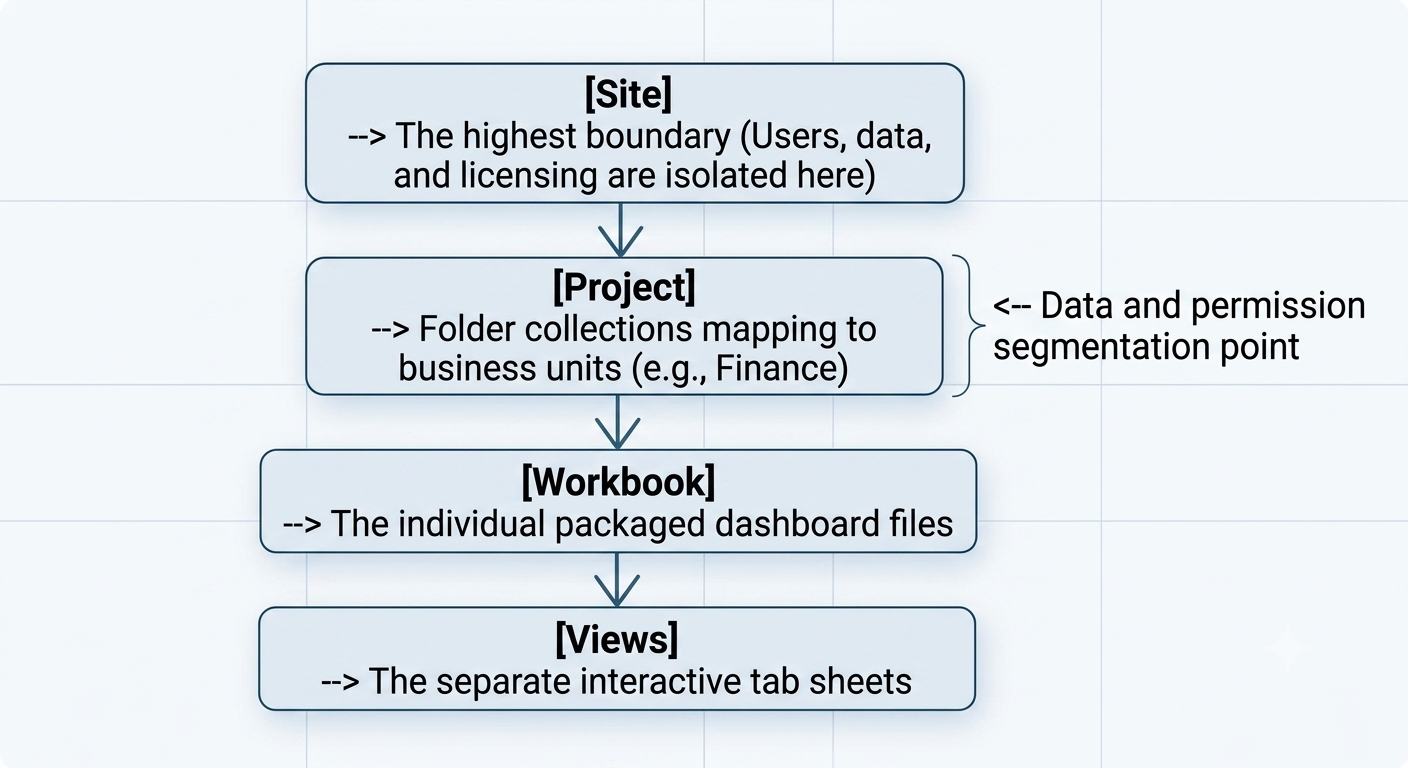
Content Hierarchy
To ensure security compliance across your enterprise network, create a clean structure in your deployment space using nested server containers:
Row-Level Security (RLS)
The enterprise-level data platforms need robust security policies; for instance, the sales manager of California should not have access to performance metrics of the team leader in New York. Tableau implements row level security using calculated fields:
// Row Level Security Filter Check
[Regional_Manager_ID] = USERNAME() OR ISMEMBEROF("Executive_Admins")
Putting this formula in the Data Source Filter window makes sure that at login, Tableau catches the connection on a foundational level and tacks on a secure WHERE statement to all backend data pulls, stopping any records from reaching the device if they do not have permission.
7. Advanced Analytics: Adding R, Python, and Predictive Modeling Capabilities
While there is much more than aggregation and basic business intelligence involved in some enterprise-level strategies, Tableau brings together the gap between data visualization and full-blown data science through the native statistics options and the code execution provided by analytics extensions.
Native Predictive Modeling Features
Prior to developing a code-based model, take advantage of the out-of-the-box predictive modeling features of Tableau in the form of MODEL_QUANTILE() and MODEL_PERCENTILE() functions, which use linear regression, regularized linear regression, or Gaussian process regression to find trends and predict data points.
For example, in order to use [Sales] as your target and independent measures such as [Marketing Spend] and [Seasonality], you can express:
MODEL_QUANTILE(0.5, SUM([Sales]), SUM([Marketing Spend]), ATTR([Seasonality]))
Python (TabPy) and R Integration
In the cases where native statistical models fail to provide solutions, such as utilizing pre-trained machine learning models (e.g., XGBoost, Random Forests, and neural networks), Tableau resorts to external plugins such as TabPy and RServe.
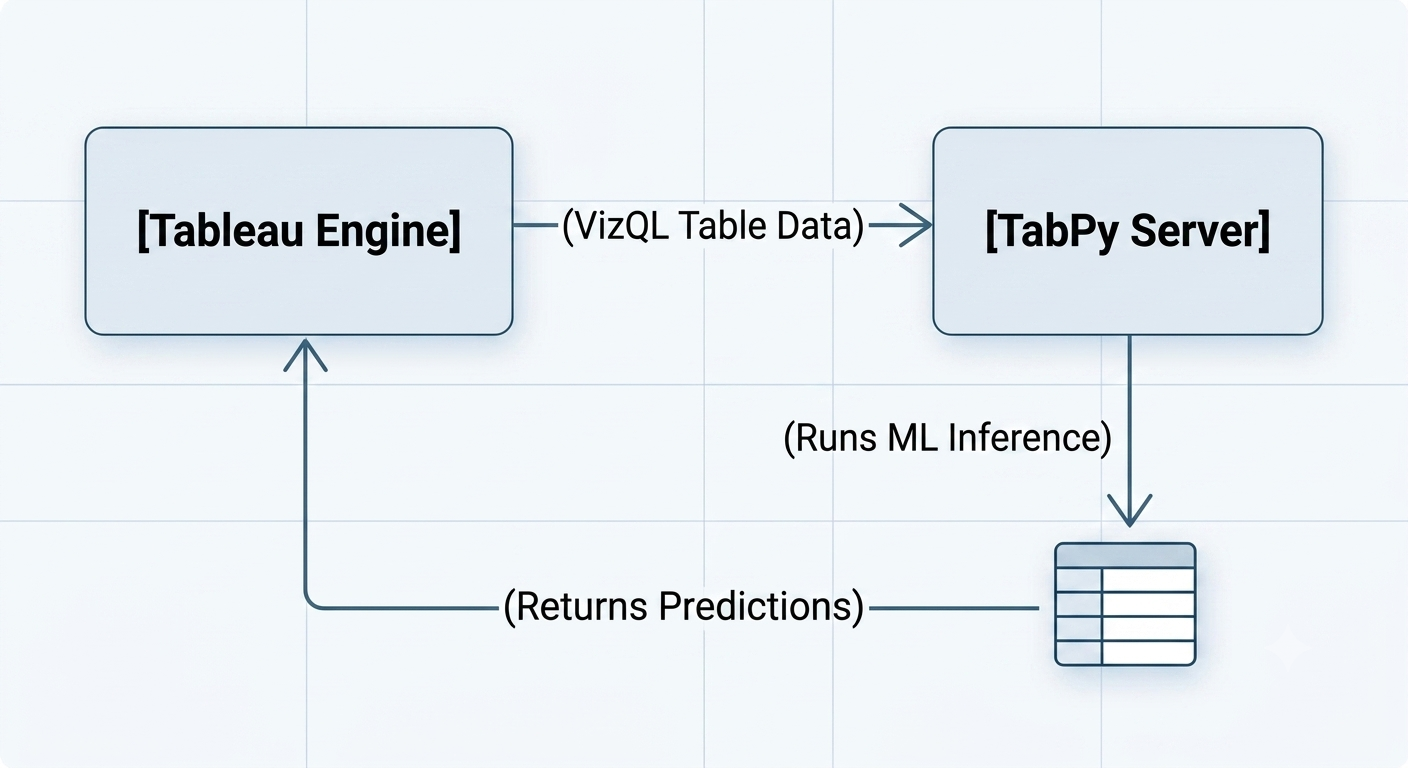
Whenever there is an update of the worksheet which makes use of the Python script, Tableau sends the necessary data vectors to TabPy through an API connection. TabPy performs the evaluation of the script or invokes the model at the endpoint and then returns the array of results to Tableau.
For this purpose, create a table calculation with the help of script wrappers (SCRIPT_REAL, SCRIPT_STR, SCRIPT_INT, SCRIPT_BOOL). Below is an example of a k-means clustering in Python within a Tableau calculation:

8. Tableau Pulse and the AI-Enabled Future
In the conventional business intelligence approach, the analyst is solely responsible for accessing the dashboard, applying filters, and seeking anomalies. With increasing enterprise data volume, the pull approach leads to analytics challenges. The industry has progressed towards the push approach of automated intelligence, which is represented in Tableau through Tableau Pulse.
Metrics Layer & Personalized Digests
Utilizing the power of Tableau Cloud architecture, Tableau Pulse separates metrics from individual visual worksheets. In the Metrics Layer, the analyst defines the metrics structure (how Net Revenue/Customer Retention is computed, for example).
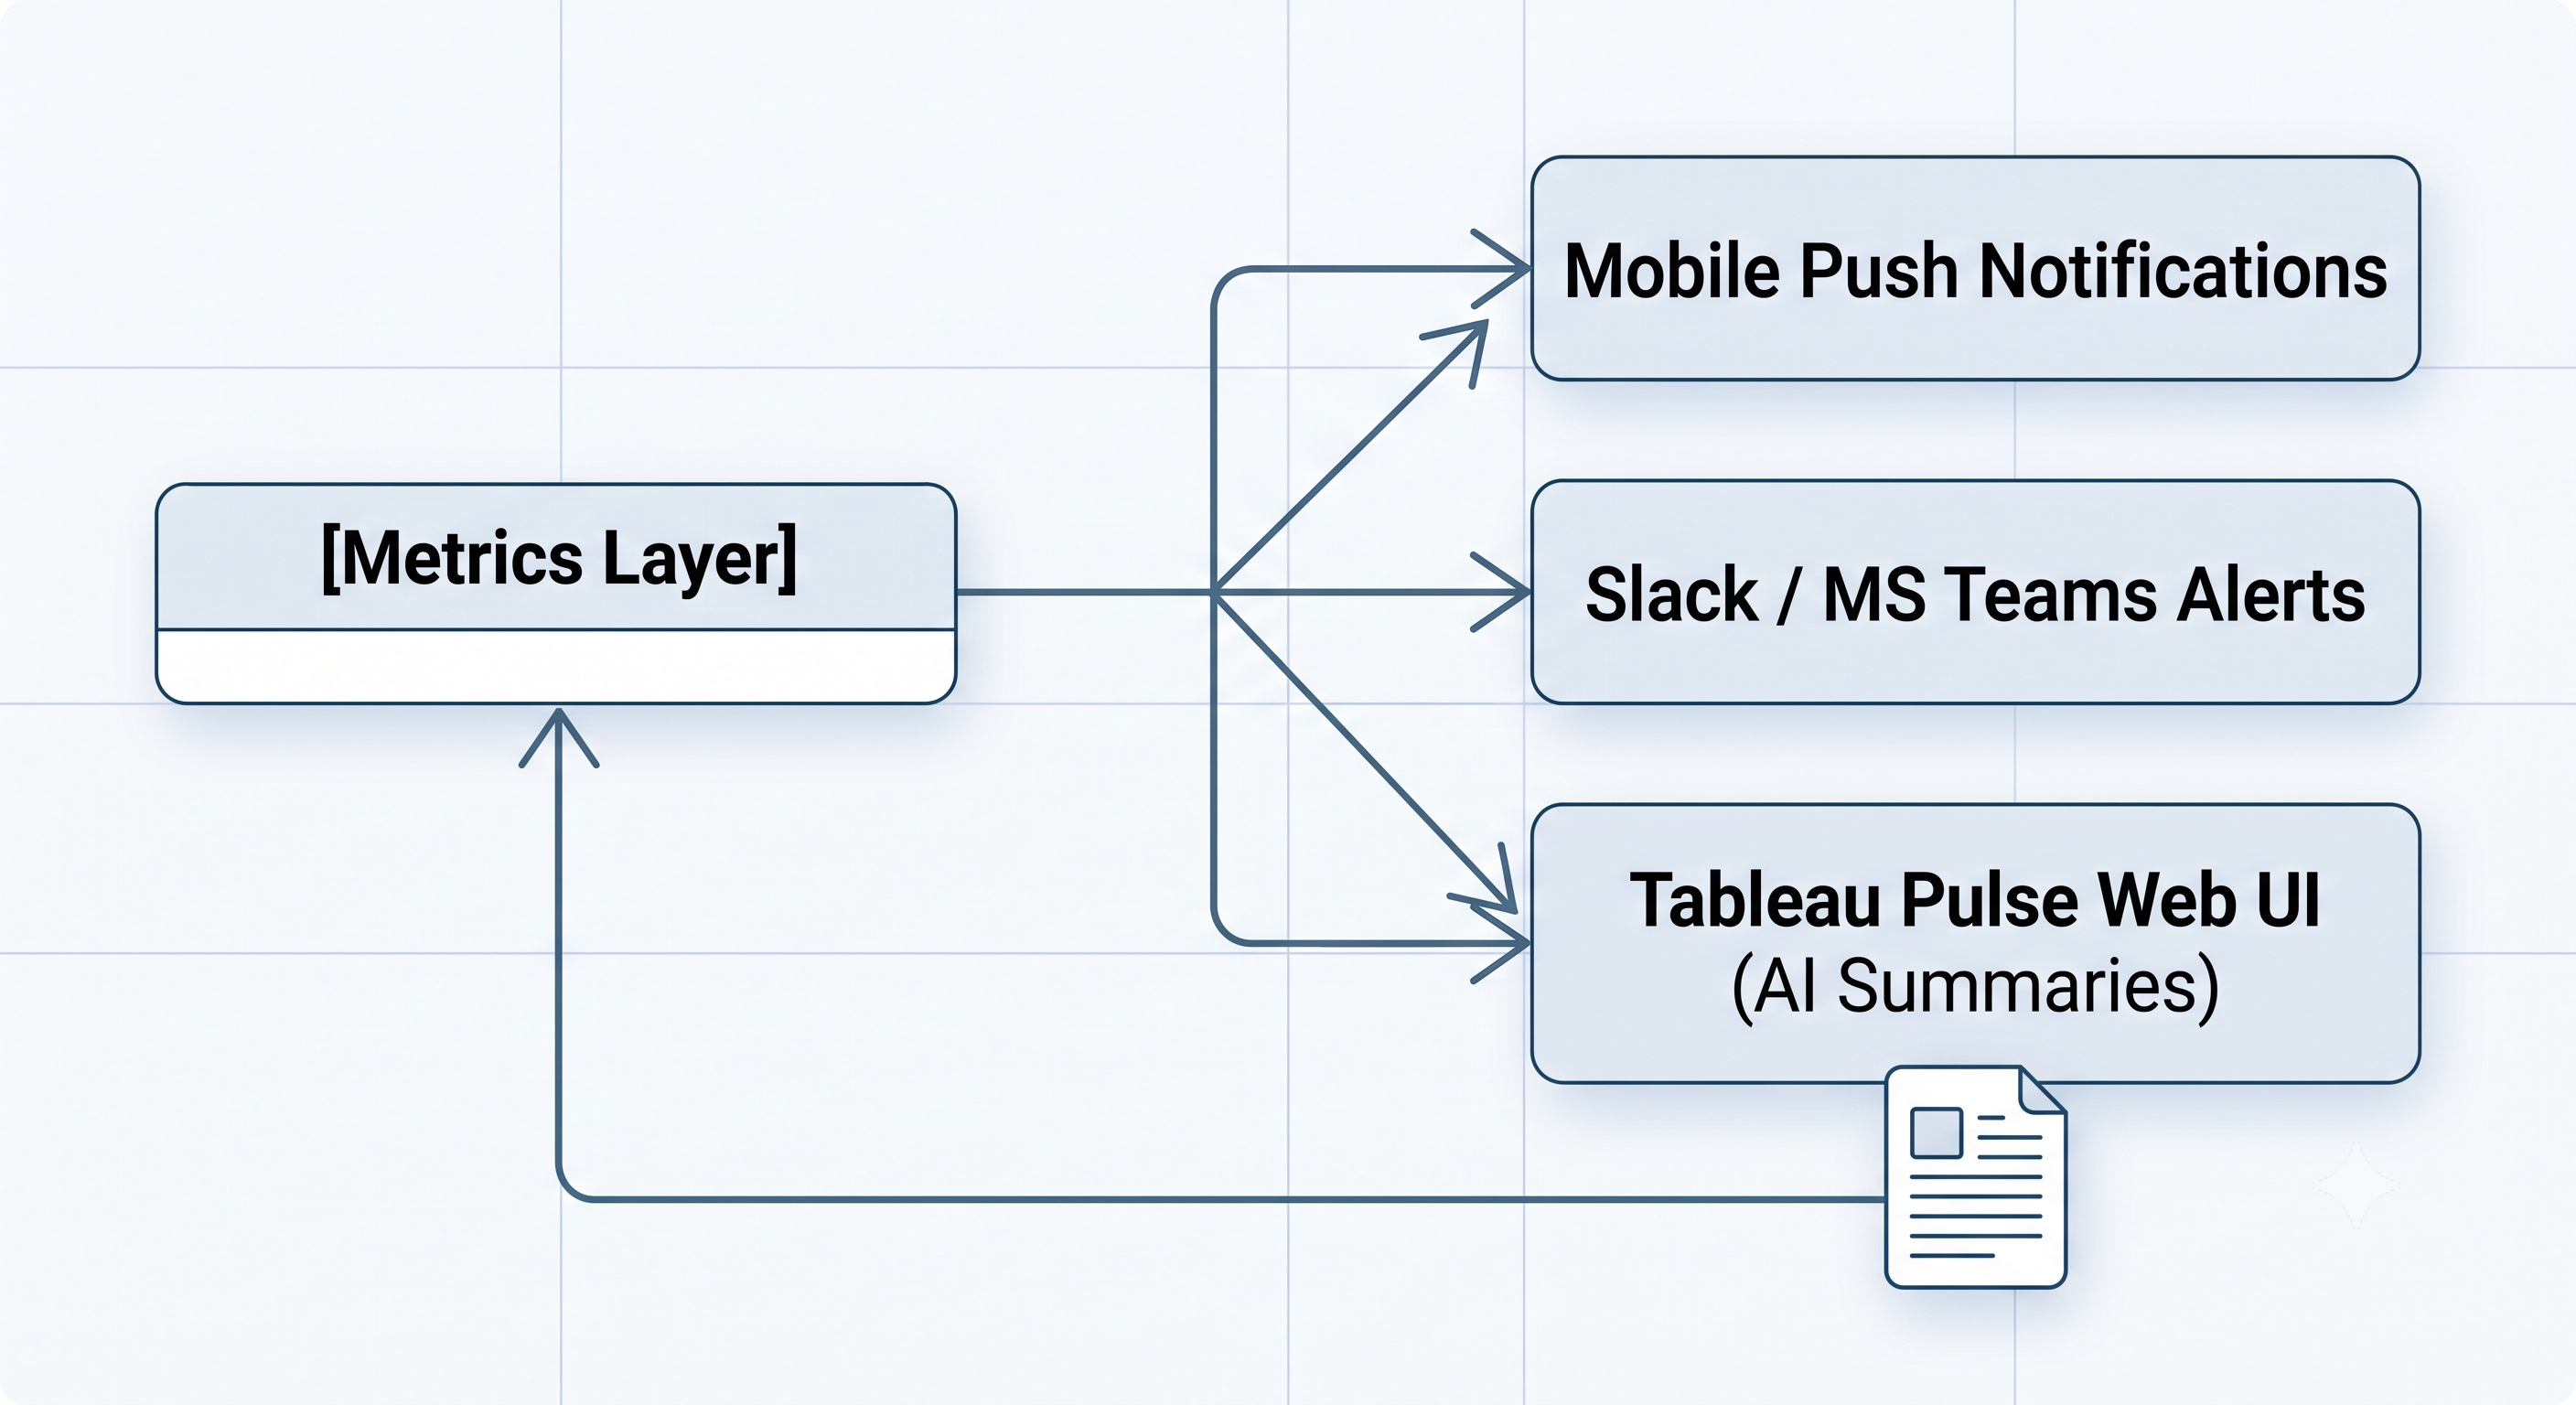
After being defined, "business users" get notifications of the metrics they should pay attention to. It is not necessary to dive into the complicated dashboard – instead, they get automated emails, messages on Slack or in mobile apps about performance changes and spikes in their relevant metrics.
Automated Insight Creation & Einstein Copilot
In case you do not know it yet, Tableau Pulse uses natural language generation (NLG) and machine learning techniques to provide insights automatically. In case there was a dramatic change in any of the selected metrics, an insight card will be generated with all the explanations – why it happened and which exact dimensions led to such change (for instance, some decline in a particular product line or region).
Moreover, Einstein Copilot for Tableau works as a generative AI assistant for the platform. Creators do not have to build calculated fields and struggle with the Order of Operations pipeline anymore; instead, they could just state their intention in plain language ("show me top 5 customers in Europe by profit margins with shipping problems excluded") and get results quickly.
Conclusion: Business Intelligence for Today’s Competitive Edge
With the progression of Tableau from a visualization software to a comprehensive intelligent data solution platform, it becomes clear that there is a shift in the thinking of corporations when it comes to data strategy. With all the capabilities shown in the architecture of the software, it can be seen that business intelligence is no longer merely about making reports.
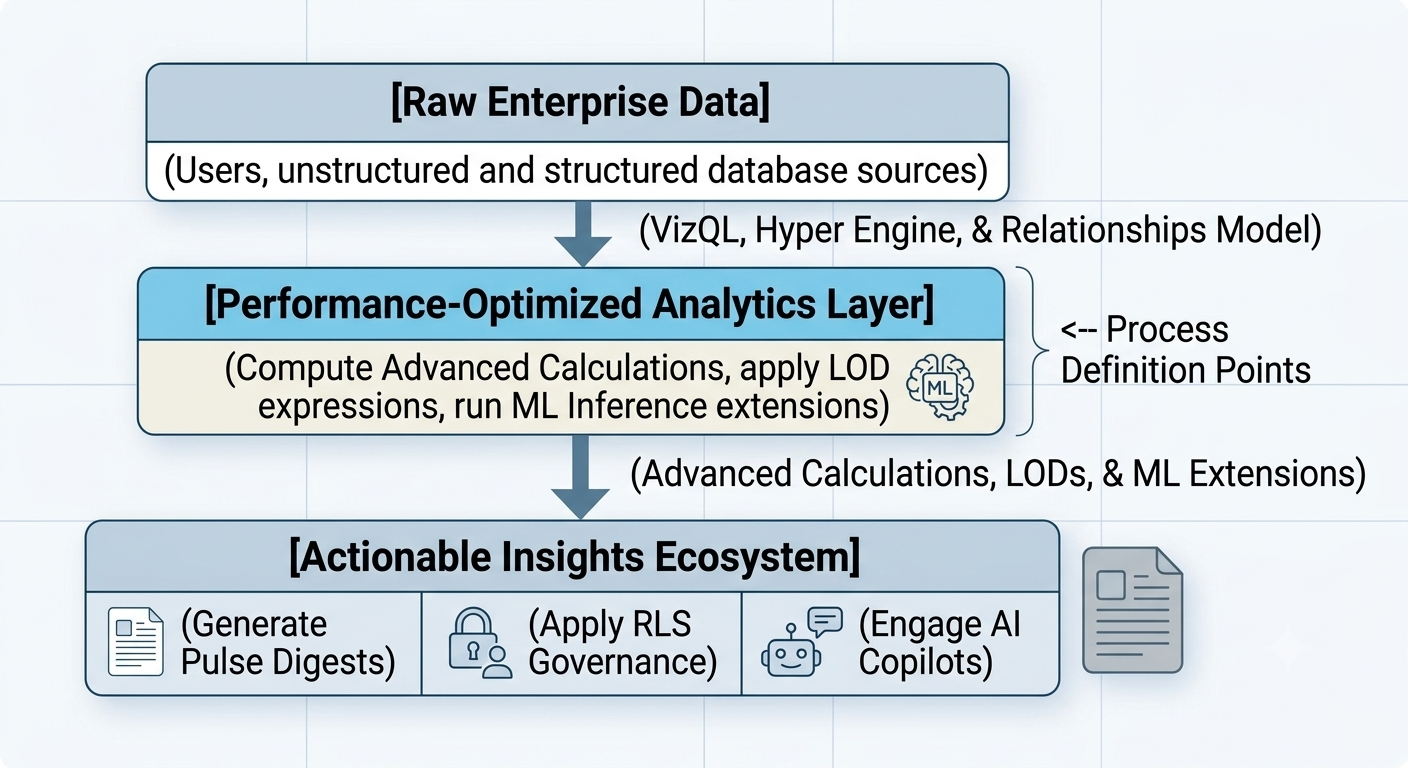
By developing their proficiency in the internal systems - from accurately following the Order of Operations to utilizing LOD expressions and machine learning tools such as TabPy - companies can avoid the inherent challenges associated with the process of data analytics altogether. Additionally, strict data governance in the form of Row-Level Security guarantees that the process of data democratization will not jeopardize corporate compliance.
In terms of future possibilities, one should mention the incorporation of generative AI and push analytics enabled by innovations such as Tableau Pulse and Einstein Copilot, which is going to be the next step in data maturity. Transitioning from the "pull" paradigm, which requires users to seek out answers themselves within complex visualizations, to the automated "push" paradigm that provides personal metrics-based insights is going to bridge the remaining distance between complex data sets and human decision-making.
Ultimately, the formulation of a corporate data strategy involving Tableau is what will enable everyone to transcend the chatter that emanates from the transactional row level and make decisions instantly. For those who wish to acquire this competence, there are various training modules offered in formal tableau course online websites such as OnlineITGuru, which teach tableau for teams transitioning into the modern data world.