
Mastering Business Intelligence: The Ultimate Guide to QlikView Training and Certification
Last updated on Jul 10, 2026
In the modern corporate world, data is often compared to oil. However, just as crude oil needs to be processed to become valuable, data should go through some transformation to be useful. To make strategic decisions, optimize processes, understand the behavior of customers and other factors in the market, raw data should be mined, collected, transformed and visualized. The technology that makes such transformation possible is called Business Intelligence (BI). One of the pioneers and the cornerstone in this field is QlikView, which is a revolutionary data discovery application developed by Qlik.
Within the last ten years, some self-service visualization tools focused on automation appeared. Still, QlikView remains one of the most important applications used in BI environments driven by developers due to its special architecture that is based on proprietary associative data engine and in-memory processing, making it possible to link different datasets without imposing hierarchical structure typical for databases on them.
Since there is a lot of structural flexibility involved in the use of QlikView, it becomes important to have proper training in the syntax and expressions of QlikView. If you would like to understand how to convert raw data into a business plan using QlikView, then taking advantage of the qlikview course online that can be taken from the Internet becomes a good way of doing so. A program such as the one offered by OnlineITGuru can help professionals in their career development journey.
This guide covers everything from key concepts behind QlikView, its architectural design, syntax, scripting options, and practical benefits of training sessions.
Introduction to QlikView: Innovator of Associative Data Discovery
Traditionally, Business Intelligence solutions have relied on relational database design, which means that before being able to access data, a user had to define a proper query pathway, develop dimensional hierarchy and craft complex SQL queries to get information about multiple tables. Such an approach often left business people helpless because when managers tried to ask questions unrelated to the existing query pathway, the whole data cube had to be redesigned by the BI team.
QlikView has revolutionized the industry by introducing the unique Associative Data Engine.
Core Concept: Associative vs Hierarchical
In contrast to the traditional relational systems where queries are executed linearly, QlikView creates associations between fields in a data model dynamically. By clicking on a particular point in a dashboard object—like a geographical region—a user can instantly see how the whole application responds and filters the selected item across all open sheets.
It helps build a unique color-based vocabulary for data visualization, providing an intuitive way to instantly interpret the connections:
- Green – the user selection.
- White – the related data points.
- Gray – unrelated data points.
A team working on an analysis gains the ability to recognize unexpected relationships. For example, instead of only viewing those products, which have been selling best in the quarter in question (white data), the manager will easily understand which products didn’t yield any sales income at all (gray data). The knowledge of what has not happened in a business operation may be equally important for corporate diagnostics.
In-Memory Computing Power
QlikView’s speed performance is based on two things, the second one being fast In-Memory Computing Architecture. Instead of sending queries to physical hard drives or remote relational databases, QlikView compresses the source data sets to about 10% and stores the whole volume in the RAM of the server. Thereby, the system does not suffer from the disk I/O bottleneck at all, providing subsecond query responses for millions of operational records.
In-Depth Discussion on the QlikView System Architecture and Components
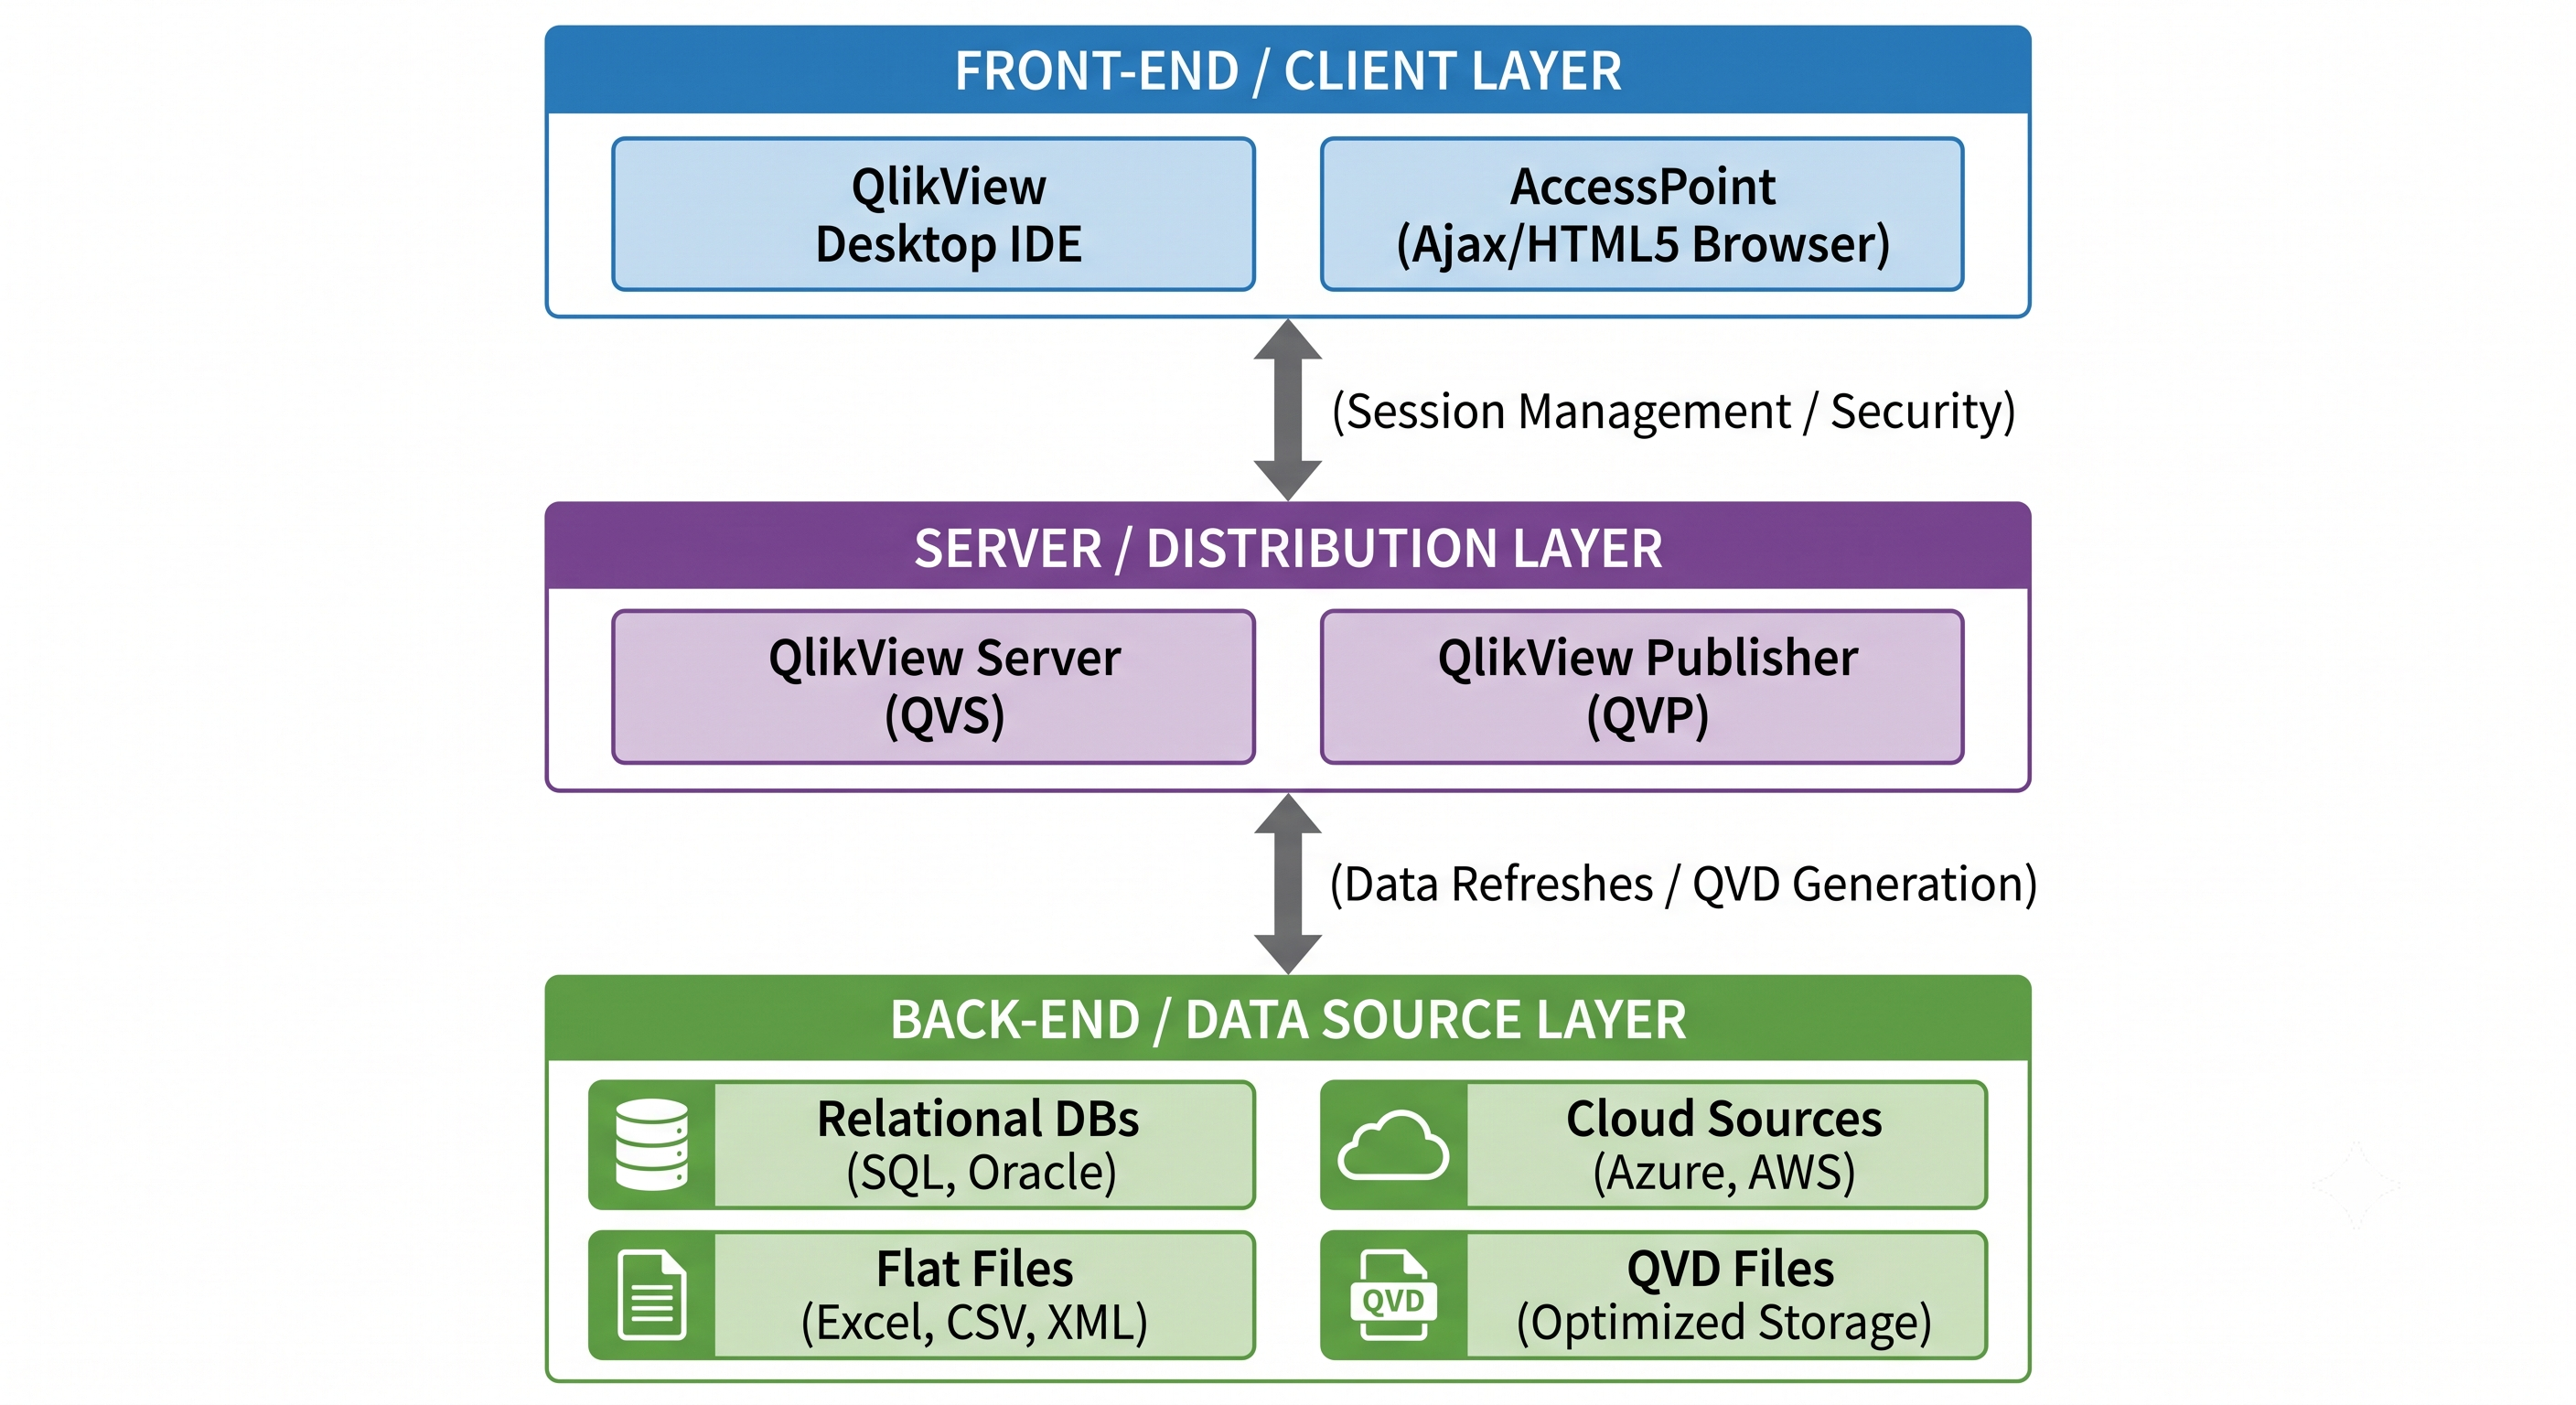
In order to develop a robust BI ecosystem, it is important to understand the three fundamental layers of architecture of the QlikView environment: the desktop development layer, server layer, and the data distribution layer.
1. QlikView Desktop
This module is used as an integrated development environment for the Windows-based computers. It serves as a place where developers write ETL (Extract, Transform, Load) script statements, create a connection to the databases using ODBC/OLEDB drivers, fix any structural data problems, and design sheets for users to see. The module integrates both a graphical user interface as well as a dedicated script editor component for writing scripts.
2. QlikView Server (QVS)
Upon the development of a dashboard file (.qvw), it needs to be distributed from a central location to make it accessible in the entire enterprise. QlikView Server does just that. It distributes the application to serve as a host as well as an internet web server. This component is responsible for managing sessions, setting up data security across various organizational roles, and hosting the application files directly inside the server memory through the QlikView AccessPoint portal.
3. QlikView Publisher (QVP)
The Publisher acts as a means of automation for administration of data distribution on a big scale. It schedules data refreshes, manages the process of reloading the source systems, and distributes huge corporate dashboards into several small files for departments according to the users' permissions. This means of automated distribution will ensure that a regional sales representative receives his/her dataset only.
The Technical Spectrum: Scripting, Syntax, and Data Modeling
One of the popular myths of beginner QlikView analysts concerns the fact that this technology can be considered merely a drag-and-drop charting tool. In fact, using QlikView means having a good understanding of the principles of data engineering, which implies learning its syntax rules, data transformations, and optimization strategies due to the usage of developer-written scripts.
Script Expressions and Traps
The QlikView scripting engine uses its own syntax standards for data loading and transformation. One of the distinguishing features is the strict approach to the use of quotation marks:
'Value' (single quotes): Strictly for enclosing literals, date, or string constants in load statements only.
"Field Name" (double quotes): For denoting table field headers, particularly those having space(s), special character(s).
[Field Name] (square brackets): Another form of the use of double quotes in denoting the field designation, particularly those having space(s).
Incorrect usage of these quotation marks will result in errors in script syntax, stopping the entire data reload.
Interpretation Variables – The Most Important Part of Scripting
Once you open a new script file (.qvw), automatically, at the beginning of your script, the system creates a list of interpretation variables that define how the application interprets the data from underlying data sources, independent of the regional operating system settings on the server:

When transactional databases use European formatting for storing monetary figures (period for thousands and comma for decimal places), developers have to change these interpretation settings manually in order to avoid numerical distortion upon loading data.
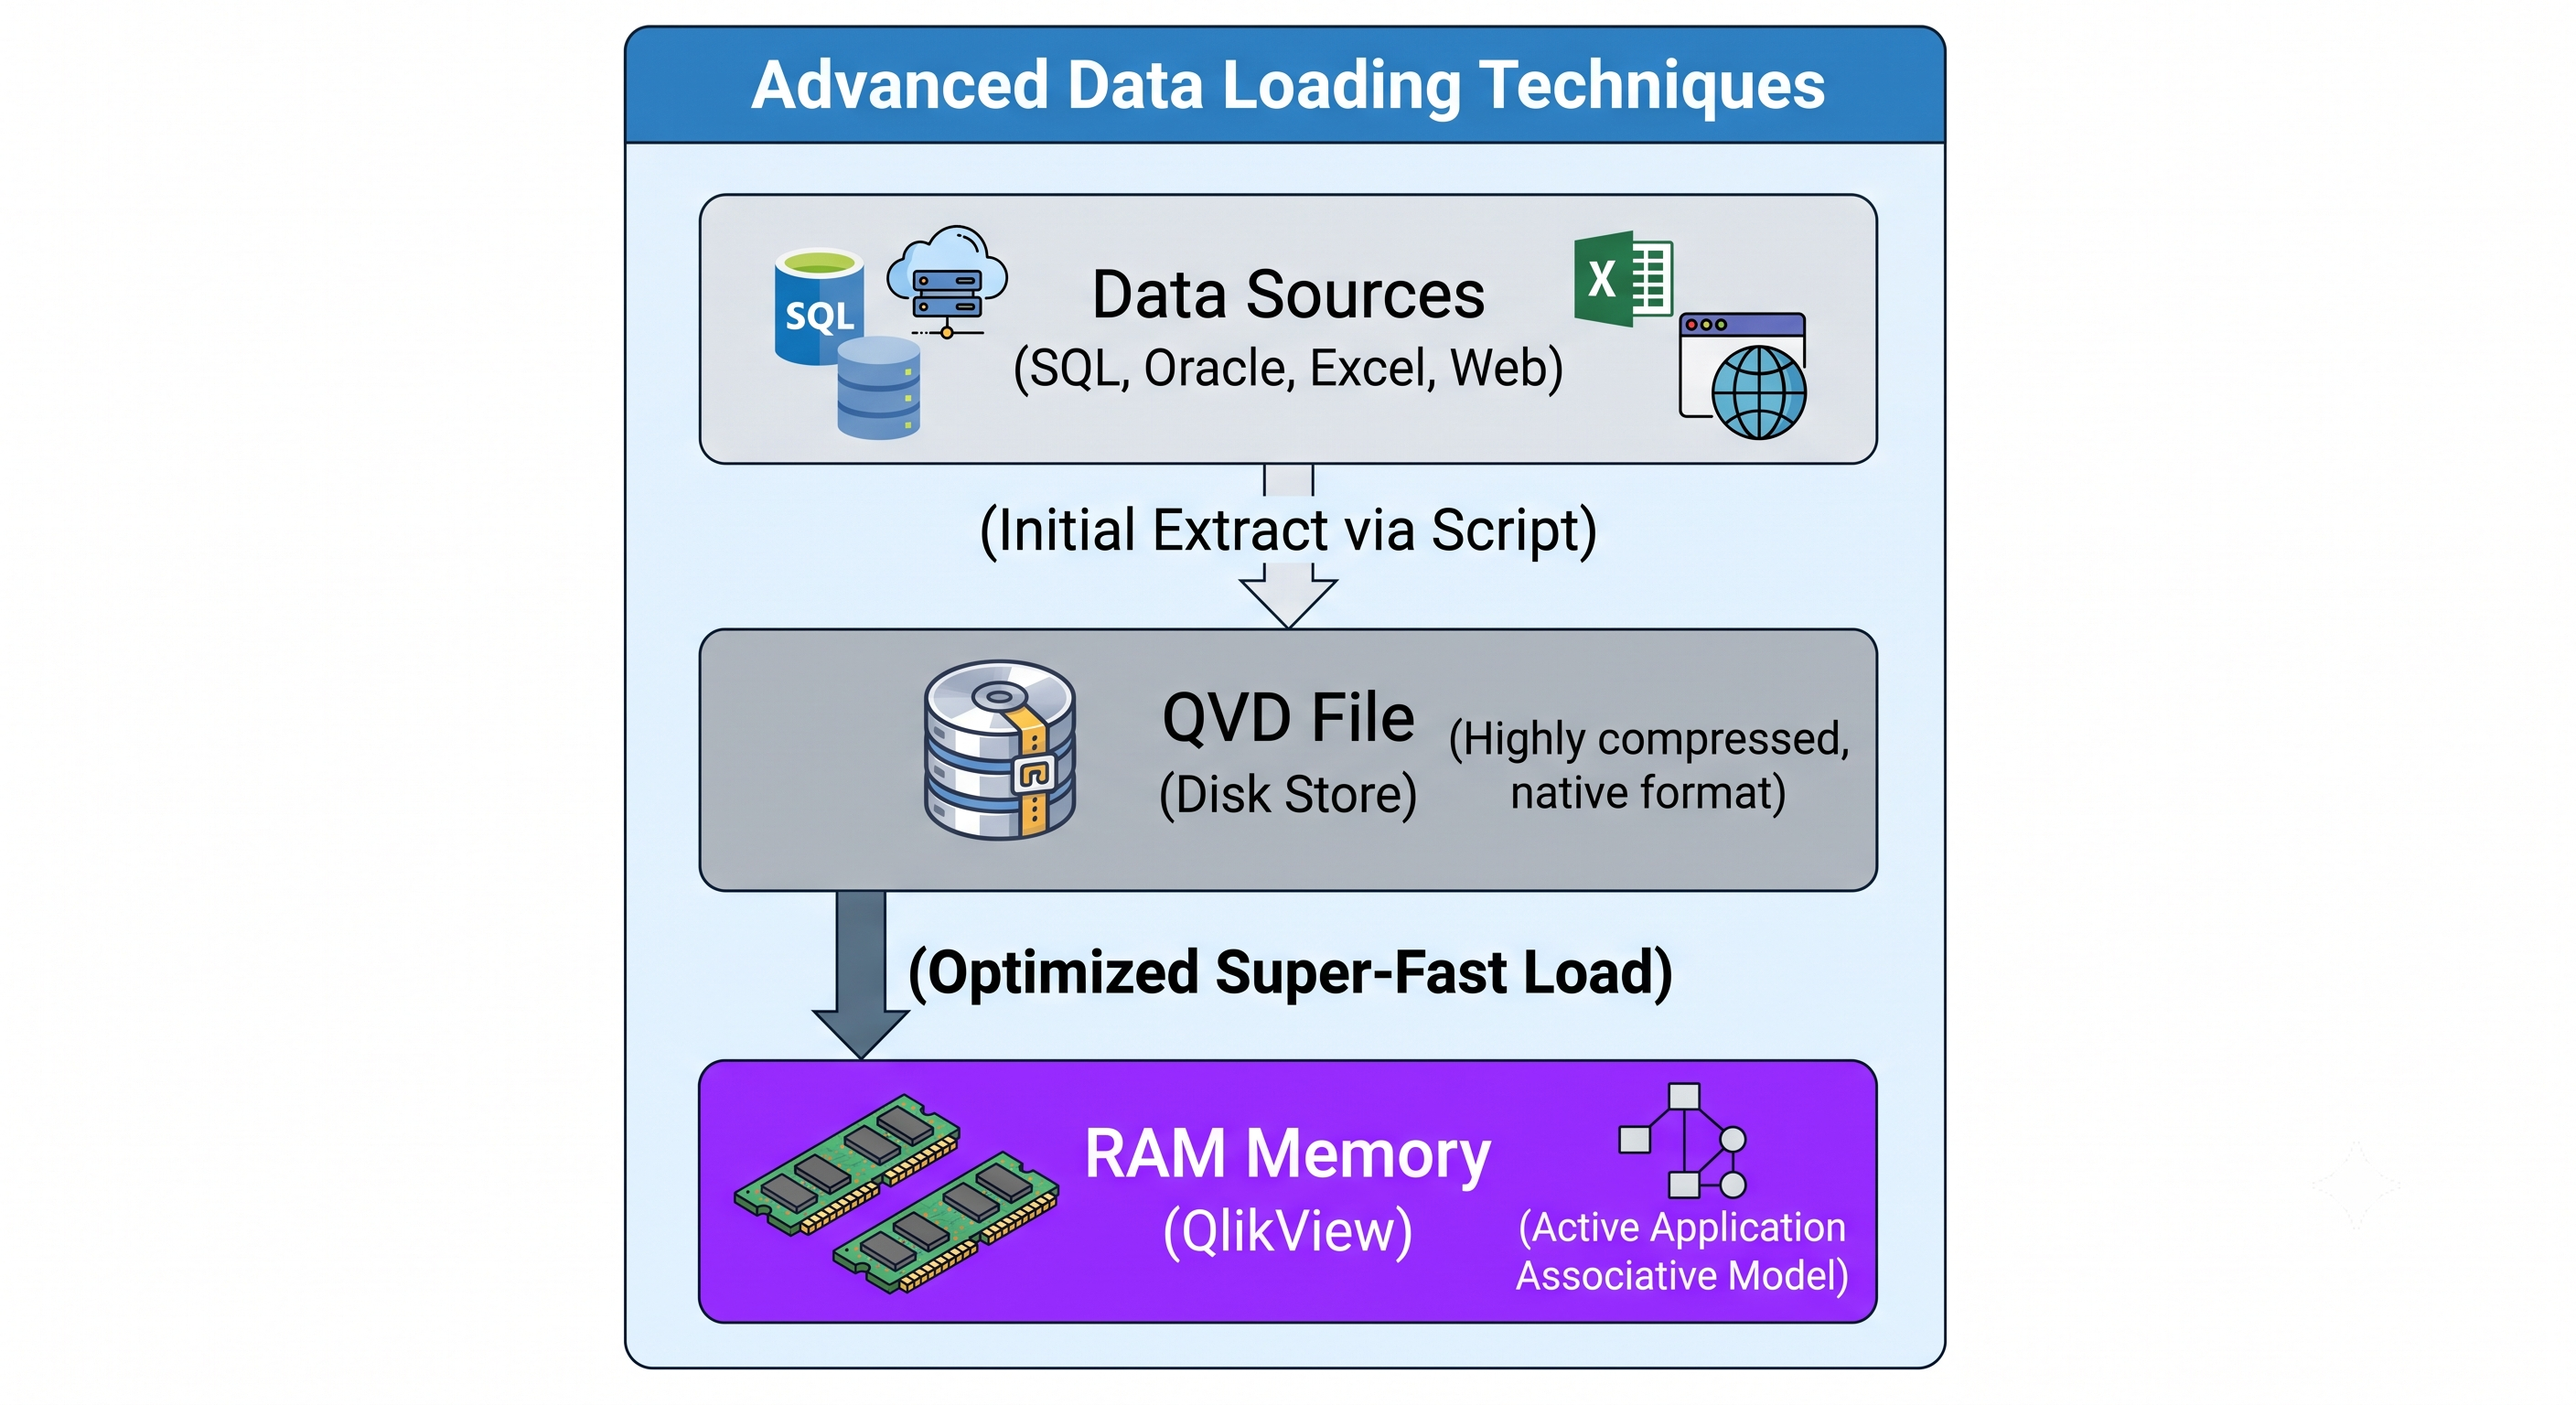
Several different methods of loading data must be learned by developers to ensure good application performance:
Resident Load: This method allows developers to load data from an existing QlikView table and create a new table structure, carrying out additional transformations without the need to query the source database again.
Preceding Load: It allows setting up transformation stages right above a source data retrieving command, thus enabling multilevel cleaning of data with just one execution of the script.
Incremental Load: This approach is critical for working with huge amounts of data and is based on using QlikView Data (.qvd) format to collect only new and changed rows from the source system and add them to historical data storage.
How to Avoid Common Architectural Flaws
In designing complex data models using different data sources, there can be layout problems as follows:
Synthetic Keys: Arise when several distinct tables have common column names. The problem is solved by QlikView's creation of a hidden lookup table which defines the relations between them. While helpful for small amounts of data, the synthetic keys take up more space in memory when the data set is large, and thus, need to be removed manually through composite keys or AS aliases.
Circular Dependencies: Are created when there is a linking of data tables in a closed circuit, hence making the filter pathways of the associative engine confused. It is solved by either using link tables or explicitly stating concatenations.
Front-End Development and Advanced Analysis
When the data model is done properly, developers work on developing dashboards to analyze the data.
Advanced Front-End Object Controls
Pivot Tables & Straight Tables: Straight tables provide multi-dimensional sort functionality and direct viewing of rows. Pivot tables help users slice, dice and regroup structural metrics in a multi-dimensional manner, providing cross-tabs functionality.
Table Boxes: They are used to display simple, non-aggregated, row-level information for multiple associated fields within the current data model.
Selection Indicators: They offer useful feedback when working in dashboards. They use color indicators on objects’ borders indicating if a value in a list box is locked (blue), explicitly selected (green) or not selected (gray).
Advanced Chart Expressions and Analytical Functions
For creation of responsive KPIs and metrics, developers can utilize advanced QlikView front-end expression language including advanced logical and aggregate operations:
The AGGR() Function: This function creates a dynamic virtual table of aggregate values grouped by certain dimensions. It gives developers the ability to do nested aggregations, such as finding an average sales per month per region by aggregating transactional sums per store first.
Set Analysis: QlikView’s most powerful feature – set analysis helps developers to define a custom scope for an aggregation expression, which operates independently from active selections of the user in the dashboard. For instance, the following expression:
Sum({<Year = {2026}, Region = {'North'}>} Sales)
determines the number of sales only for the North region in the year 2026, even if the manager is looking at 2025 sales numbers for Western regions right now in the dashboard. This is necessary for creating yearly comparison graphs and fixed corporate trend indicators.
Structured Learning: The Fundamental Curriculum of Professional Training
Because of the complexities within QlikView’s enterprise solutions, self-learning can only lead to a poorly constructed data model and a sluggish dashboard along with synthetic keys. Participation in a qlikview course online by OnlineITGuru becomes vital in overcoming this difficulty.
The professional training covers all aspects starting from installation up to enterprise deployment:
Phase 1: Installation, Environment Setup, and UI
Downloading and registration of the installation source files from the repository.
Configuration of the Installation wizard, license directory setup, and target file paths.
Understand the Desktop environment workspace and list box usage.
Phase 2: Ingestion basics and connections with data sources
Connection to the relational database level via ODBC and OLEDB connection strings.
Basic ingestion of unstructured text files, .csv delimited records, XML hierarchy, and web based file table structure.
Structure of the basic script layout, interpretation settings, and quotation syntax.
Phase 3: Advanced data modeling and structural optimization
Identification and correction of problems associated with data modeling such as synthetic keys and circular references.
Implementation of optimization workflows with the help of Resident Loads, Preceding Loads and Incremental Refreshes.
Usage of the transformation tools such as Crosstable wizard, table rotation, and Mapping table function to resolve null field values issue.
Phase 4: Master analytics and dashboard development
Creation of complex calculation expression by using Set Analysis and nested AGGR() functions.
Creation of dynamic pivot tables, straight tables, KPI gauges, and auto alert block.
User access path design, data visibility rule setup, and configuration of the security settings through section access script.
Phase 5: Server Architecture and Automated Distribution
Deploying finished .qvw applications in the QlikView Server interface.
Setting up automatic data and system reloads through the QlikView Publisher application.
Creating the QlikView AccessPoint portal that allows users to access QlikView applications from a web or mobile browser environment.
Power BI vs. QlikView: Selecting a Proper Strategy
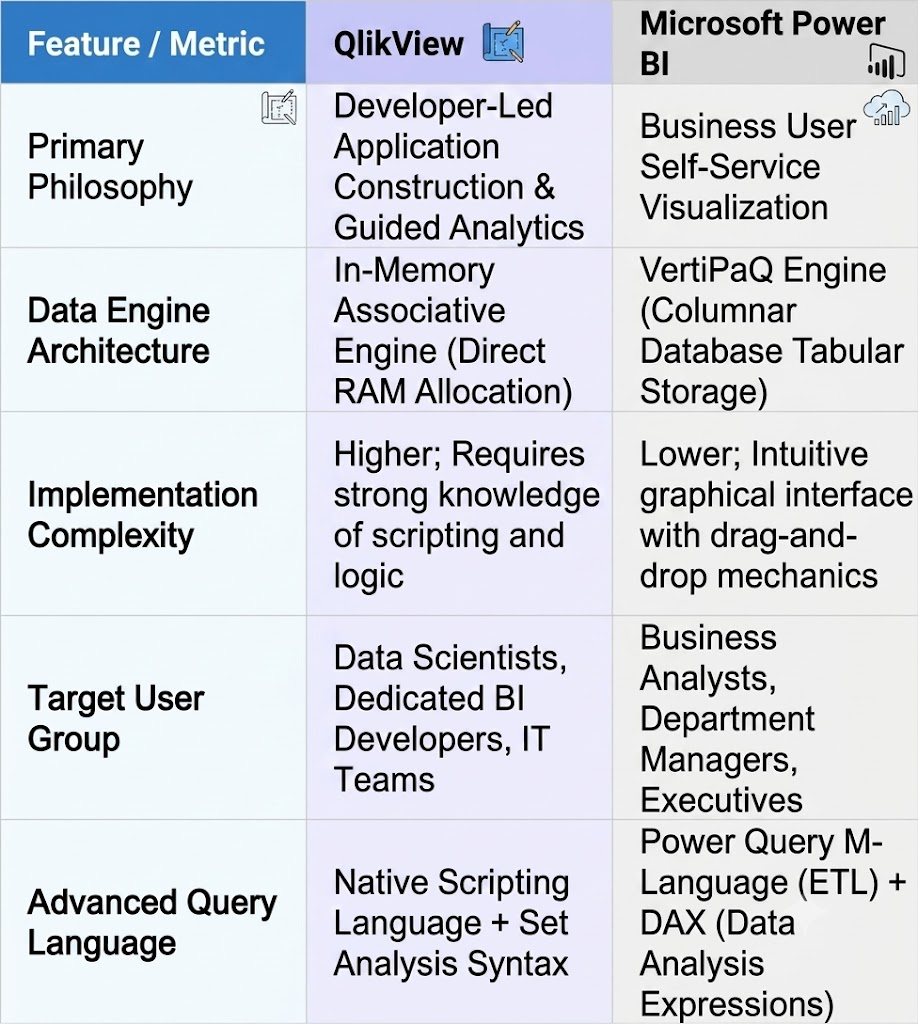
One of the most frequent questions asked by individuals new to the field of business intelligence is whether QlikView competes against other modern platforms such as Power BI developed by Microsoft. Even though both products are intended for the same purpose, they play distinctively different roles in the organization.
When to Opt for QlikView
For those organizations that have to work with very complicated and disparate data architecture which requires some custom data modeling prior to any visualization, QlikView is the right choice. What's more, QlikView performs better in cases when users should go through predefined guided analytics journeys, and therefore they can browse data and avoid accidental disruption of its logic.
The fact that QlikView needs profound knowledge of scripting language, data modeling techniques, and expressions makes professionals who possess this skillset extremely popular. All the mentioned above makes the demand for the developers who are capable to manage and tune up the corporate QlikView installations extremely high.
Unique Advantages of OnlineITGuru's QlikView Courses
In the case of gaining proficiency in advanced developer-led analytics systems, self-guided documentation is not sufficient by itself. Learning needs to be guided through a more structured approach in addition to practical implementation. This is why OnlineITGuru is a unique name in the field of IT training services.
OnlineITGuru is focused on providing a unique training environment that addresses the gap between theoretical knowledge and industry expectations. The specialized qlikview online training offered by them involves:
Live Classes with Industry Experts
In contrast to other online programs based on video materials, OnlineITGuru offers live classes. In such classrooms experienced BI architects conduct the training, providing their vast practical experience of data engineering.
Hands-On Training Projects
The entire learning program comprises hands-on learning projects. The training sessions don't consist of merely demonstration of the techniques but actual creation of BI systems from scratch by the students themselves. Some of the projects are as follows:
Attaching to actual database layers and importing raw transactional data.
Coding efficient ETL codes to process the raw data.
Fixing data model problems such as synthetic key creation and circular referencing.
Creation of advanced analytical dashboard with Set Analysis Expressions.
Technical Support Services & Mock Interview Sessions
Complex concepts of programming might sometimes cause difficulties for the students, especially after working hours. OnlineITGuru provides students with continuous project support services so that the students could fix script errors and configurations swiftly. Near completion of the course, the program also helps the students in preparing resumes and conducting mock interview sessions.
Career Paths and Market Potential
Having obtained a professional certification in QlikView, graduates may look forward to varied career paths within the technology and corporate sectors worldwide. Since QlikView is widely used by organizations within various industries, including banks, hospitals, retail, logistic, and manufacturing industries, for managing their information assets, there will always be a demand for certified experts in QlikView.
Here are some possible positions one may get after graduating:
QlikView Developer: Developing back-end data models, writing ETL execution script and building front-end user dashboards.
Business Intelligence Architect: Designing the complete data integration architecture and managing performance and data security on the server.
Data Analyst / Insights Consultant: Working together with business management in translating complex data dashboards into effective business strategies.
As more and more information is being produced by businesses every day, turning raw data into effective business strategies is becoming increasingly important.
Conclusion: How to Ensure Your Future as a Data Engineer
Modern Business Intelligence entails more than mere creation of charts and visualizations. In order to create robust analytics environments, one needs to know about data extraction, optimization, modeling, and security. Although self-service visualization has become easier, enterprise-scale data environments still use professional tools like QlikView to perform advanced data processes.
The understanding of the associative engine in QlikView, along with the advanced scripting language and analytic expressions, is achieved only through focused learning and practice. Taking up the exclusive qlikview course online offered by OnlineITGuru will give you the perfect way to learn. With a blend of effective teaching, project experience, and career assistance, it provides all the necessary tools to succeed. Irrespective of being a database administrator seeking knowledge on analysis, a business analyst looking forward to data engineering, or a beginner venturing into IT, QlikView is the platform that can help you achieve your goals.