
Optimizing MuleSoft vCores to Cut Enterprise Licensing Costs
Last updated on Sep 15, 2026
The adoption of integration platforms by enterprises mostly follows a familiar path. They implement a modern integration platform such as MuleSoft to eliminate point-to-point infrastructures, disconnect the outdated systems and speed up API-based development. In the first stages of adoption, the main metric is engineering speed, with projects being launched ahead of their timelines while systems communicate clearly, leading business people to praise an agile new model of operation.
As time passes, the focus changes, and with the emergence of tens of applications and eventually hundreds, the realities of the platform's economy start taking shape. The licensing model of MuleSoft, which is closely connected to the amount of computational power generated measured in virtual cores (vCores) in CloudHub, Runtime Fabric and on-premise environments means that any careless architecture leads to the emergence of unnecessary operational expenses. The teams that consider capacity to be an infinite resource will experience high renewal costs and problems with getting enough allocated cores, which will eventually slow down the launch of their new initiatives.
Cost optimization in MuleSoft is more than just a financial review or a stop-gap measure taken prior to renewing an annual contract; it is an essential discipline in architecture. Understanding how Mule execution operates, how concurrency models work with memory, as well as relationship between architectures and costs is needed to maximize the efficiency.
Determining your deployment footprint calls for thoughtful strategies involving consolidation, tuning, traffic management, choice of deployment topology, and strict governance.
The Business Structure of MuleSoft Licensing and Computing
To enhance utilization of the compute resource, a business needs to first analyze the meaning of the virtualization core across runtime environments. In the previous CloudHub 1.0, one virtualization core served as a single virtual machine that hosted one instance of the Mule runtime engine. Provisioning of virtualization Core 1.0 occurs in a variety of sizes, which include proportions such as 0.1 and 0.2 vCore alongside full-core measures such as 1, 2, 4, etc. The boundaries of each size are strictly formulated, prescribing proportions of CPU with definite amounts of memory and a finite volume of ephemeral storage.
In the case of CloudHub 2.0 and Runtime Fabric (RTF), the basic building elements are no longer virtual machines but container orchestration built on top of Kubernetes technology. Even though tighter margins for the allocation of CPU and memory resources are possible, one has a limitation that the fractional cores can also impose certain limits regarding the type of resources used and the way CPU computes threads or allocates memory.
The main economic mistake that many companies make is allocating too many computing resources to deal with bad applications and excessive defaults in regards to availability. For instance, when a development team creates an API that only processes two requests every minute, the application will use two 0.1 vCore servers to provide redundancy even though the API is not using any processing power. When this is repeated across 300 simple APIs, the company is wasting 60 vCores only in idle times.
Proper optimization of the usage of cloud services does not imply any risks for operational stability, suspending the applications from operating properly, or risks for the company. In reality, the problem might be solved through aligning the computing resources with the type of load on the system. This requires that the architects analyze the costs connected with taking the decisions about the system architecture rather than just using the default settings of the software.
The Main Structures of Overconsumption
The phenomenon of excessive core overconsumption does not occur due to a single overwhelming mistake. The process of excessive core overconsumption is the result of an accumulation of different bad practices that occur in distributed teams working on software development.
The issue of vCore proliferation
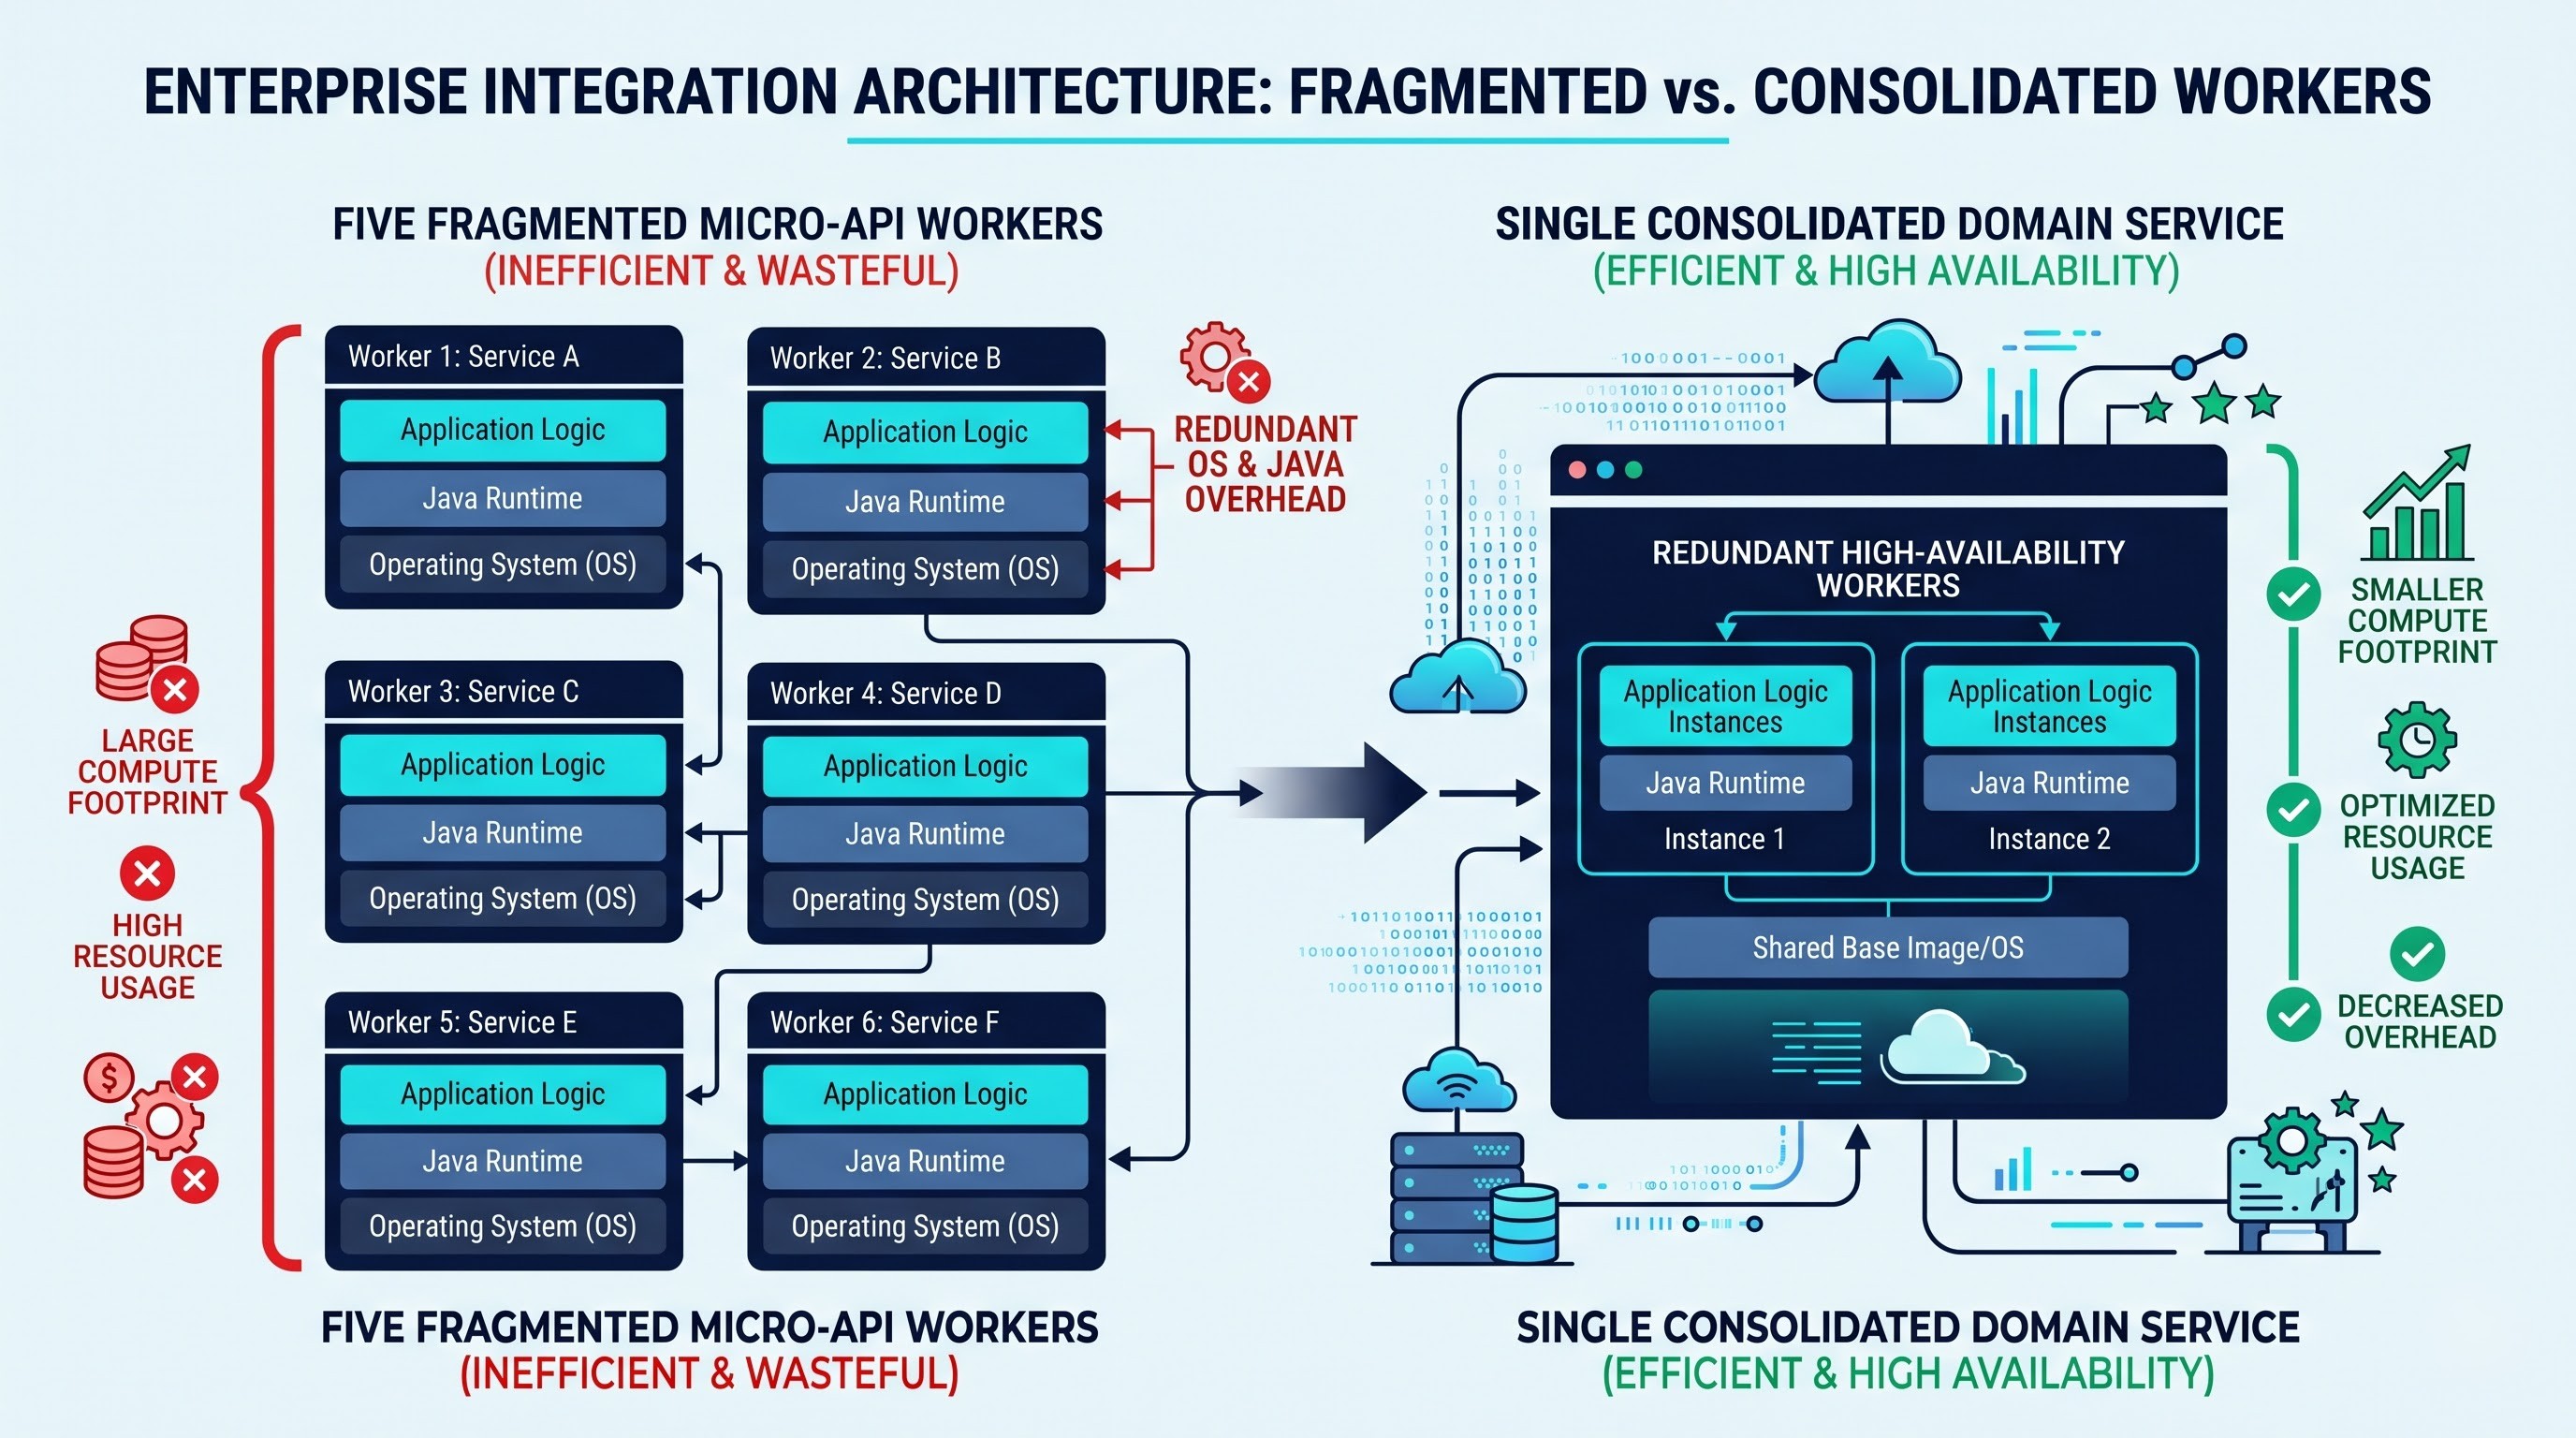
MuleSoft’s principles of API-led connectivity specify three different layers: systems APIs, process APIs and experience APIs. When taken to the extreme, the idea means that developers design separate deployable Mule artifacts for each micro-resource in any ecosystem, which leads to, for example, having ten different System APIs in the organization that execute the same function of reading a particular database table, each of which is running as an independent worker in Cloudhub.
The deployment of separate micro-interfaces to various fractional workers comes with the penalty of huge platform overhead. Each CloudHub worker operates on an underlying guest OS, logging daemons, monitoring agents, and an independent Java Virtual Machine. If an application is given a little 0.1 vCore slice, a large chunk of the allocated CPU and memory will simply be consumed maintaining the runtime engine itself. There will be very little left for any real payload transformation and message routing. The more small deployables an enterprise creates, the more it incurs infrastructure tax on each and every instance, wasting subscription costs on idle runtimes.
Mixing Up Throughput with Core Count
A common myth in integration engineering is that slow API responses require instant computation scaling. When an API goes through latency, developers will often call for moving up the worker size from 0.2 to 1 vCore or doubling the number of workers.
However, the majority time integration runtimes are waiting for the external dependencies: third-party SaaS endpoints, queries to relational databases, responses from legacy mainframes, or network I/O. If a database takes 4 seconds to answer a query, increasing the compute power in MuleSoft will have no effect at all, as the thread performing the Mule flow will move into waiting status sooner without being able to influence the enterprise costs.
Ineffective Payload Management and Memory Leakage
The Mule 4 reactive framework uses asynchronous I/O operations and dynamic threads pools to ensure effective event processing. Nevertheless, if a developer creates flows where payloads are mishandled, the benefits provided by the underlying platform are nullified.
Storing large XML or JSON payloads in memory, performing unmarshalling operations for huge documents at the borders of flows, or repeating pointless data in flow variables puts an undue strain on the heap of the JVM. Once the heap starts filling up, the JVM invokes frequent cycles of garbage collection, thus overwhelming the CPU. The teams that see the CPU spike think that there is a need for moving to a higher number of vCores, but in fact, the issue lies in the bad handling of streams and uncontrolled memory consumption in the business logic.
Misconfigured High-Availability Procedures
High-availability procedures are permanent parts of business-critical fundamental systems, including processes for order placement and financial transfers. At the same time, however, the use of the active-active type of scattering along with that of multi-worker redundancy indiscriminately in all types of environments incurs profound financial costs for the platform.
The reasons behind the assumption that staging, user acceptance testing, or development environments should have the same number of workers as production environments can also be found in the belief that consistency in architecture must always be preserved. The same principle leads to the assumption that Experience APIs are supposed to be treated as critical systems directly affecting company’s profit and should therefore be equipped with multi-work mode, merely doubling or tripling the platform amount yet without bringing sufficient value to the company.
Right-Sizing Methodologies of the Mule Runtime
Right-sizing is the technique of identifying the lowest compute needed by the application to meet its SLA (Service Level Agreement) regarding performance and reliability in the most cost-effective manner, covering peak-load margins as well. To move from guessing right-sizing towards accurate sizing involves serious analytical work, based on factual data.
Finding out about Peak and Sustained Processing
Sizing must never be based on annual averages. If the application works with the average of five hundred transactions per hour, computing that based on eight transactions per minute will cause the system to fail during sudden peaks. Alternatively, providing permanent computing capacity for peak spikes that occur just once per quarter will result in unnecessary expenditure over the whole period of time.
Teams have to monitor their traffic by means of two clear profiles: ongoing base traffic as well as peak traffic speed. Ongoing base traffic determines the minimum memory allocation needed to run steady-state sessions, cache data, and maintain runtime state. Peak traffic means the performance of the CPU required in order to process incoming events without queuing or losing connections. By separating ongoing traffic from temporary burst traffic, architects can apply specific optimizations—from balancing the workload between queues and auto-scaling systems to avoiding the need for being a permanent peak infrastructure.
Profiling of JVM Heap Dynamics and Garbage Collection
The size of the memory determines the stability of the performance on the lower vCore tiers since the Mule runtime runs on Java. For instance, a CloudHub 1.0 worker with a vCore of 0.1 has 500 megabytes of heap memory, while a 0.2 vCore worker has about 1 gigabyte of heap memory.
To figure out if an application can operate on the fractional core tier, engineers must gather telemetric information when running a load test. The profiling shows the traditional sawtooth behavior of the heap allocation and garbage collection recovery. If the metrics after garbage collection rise with time under the load, it shows that the application has the retention leak or it stores the payloads in memory.
If the metrics post garbage collection fluctuate around a constant level leaving from thirty to forty percent of the allocated memory free for some unexpected peaks, the compute tier is right. Applications that run in the environment of 1 vCore but consume about 10% of the memory under peak synthetic load will be ready for downsizing to 0.5 or 0.2 vCores shortly.
Analysis of CPU Saturation and Thread Starvation
CPUs with fractional cores utilize hypervisor-level time-sharing to manage capacity. When an application is given a worker with 0.1 vCores and uses more than allocated, the hypervisor restricts the CPU cycles available to it. This does not need to mean that the application will fail but that the time taken to carry out tasks will increase, periodic switches between threads are made less frequently, and arriving HTTP requests will queue in the network layer.
When testing the application, it is crucial for engineers to analyze CPU usage curves. In the event of a CPU usage of 100% and low memory usage, a developer must define the reason for this increase.
If it comes from the complicated logic of the application (for example, complex cryptography or huge data transformations), it would be necessary to increase the given amount of vCores. Nevertheless, if the application is mainly I/O-bound, the bottleneck might be due to the management of threads, waiting for the service response, or synchronous flow design.
Optimizing Architectural and Code Issues
These types of efficiencies can only be realized if the design team knows all the necessary design patterns before even starting to write any transformation logic code. Enrollment of the engineering team into formal mulesoft classes guarantees that the integration team is familiar with memory-efficient design and streaming from day one.
Though infrastructure changes allow for savings in vCores, it is better to optimize the architecture of integration applications in order to reap significant savings. Optimization of the application’s code will help reduce CPU usage significantly, thus enabling the systems to work properly even with smaller amounts of computing power.
DataWeave is the sophisticated transformation language used in Mule 4 that is ideal for working with streaming data, but poor DataWeave scripts do not take advantage of streaming capabilities, which makes the application process the whole document.
One major cause of memory exhaustion is the re-reading of an input stream. Whenever an expression traverses an unindexed payload several times or operations that call for random access over a huge file have to be done by a script, the engine will be obliged to cache the whole input set on disk or in the JVM heap. In addition, the developers will be required to design transformations to navigate the streams in sequence order. By using streaming compatible expressions, data is transformed incrementally while traversing the network. This ensures that memory peaks are avoided, thus allowing the passage of huge payloads through small vCore instances.
Additionally, developers should refrain from unnecessary transformation to intermediary formats. For example, when an incoming JSON payload is converted to Java objects, to XML, and again to JSON, this consumes much processor time and generates a lot of short-lived objects for the garbage collector. The flows will require retaining binary or streaming format until the final transformation point is achieved.
Exploiting the Reactive Execution Engine
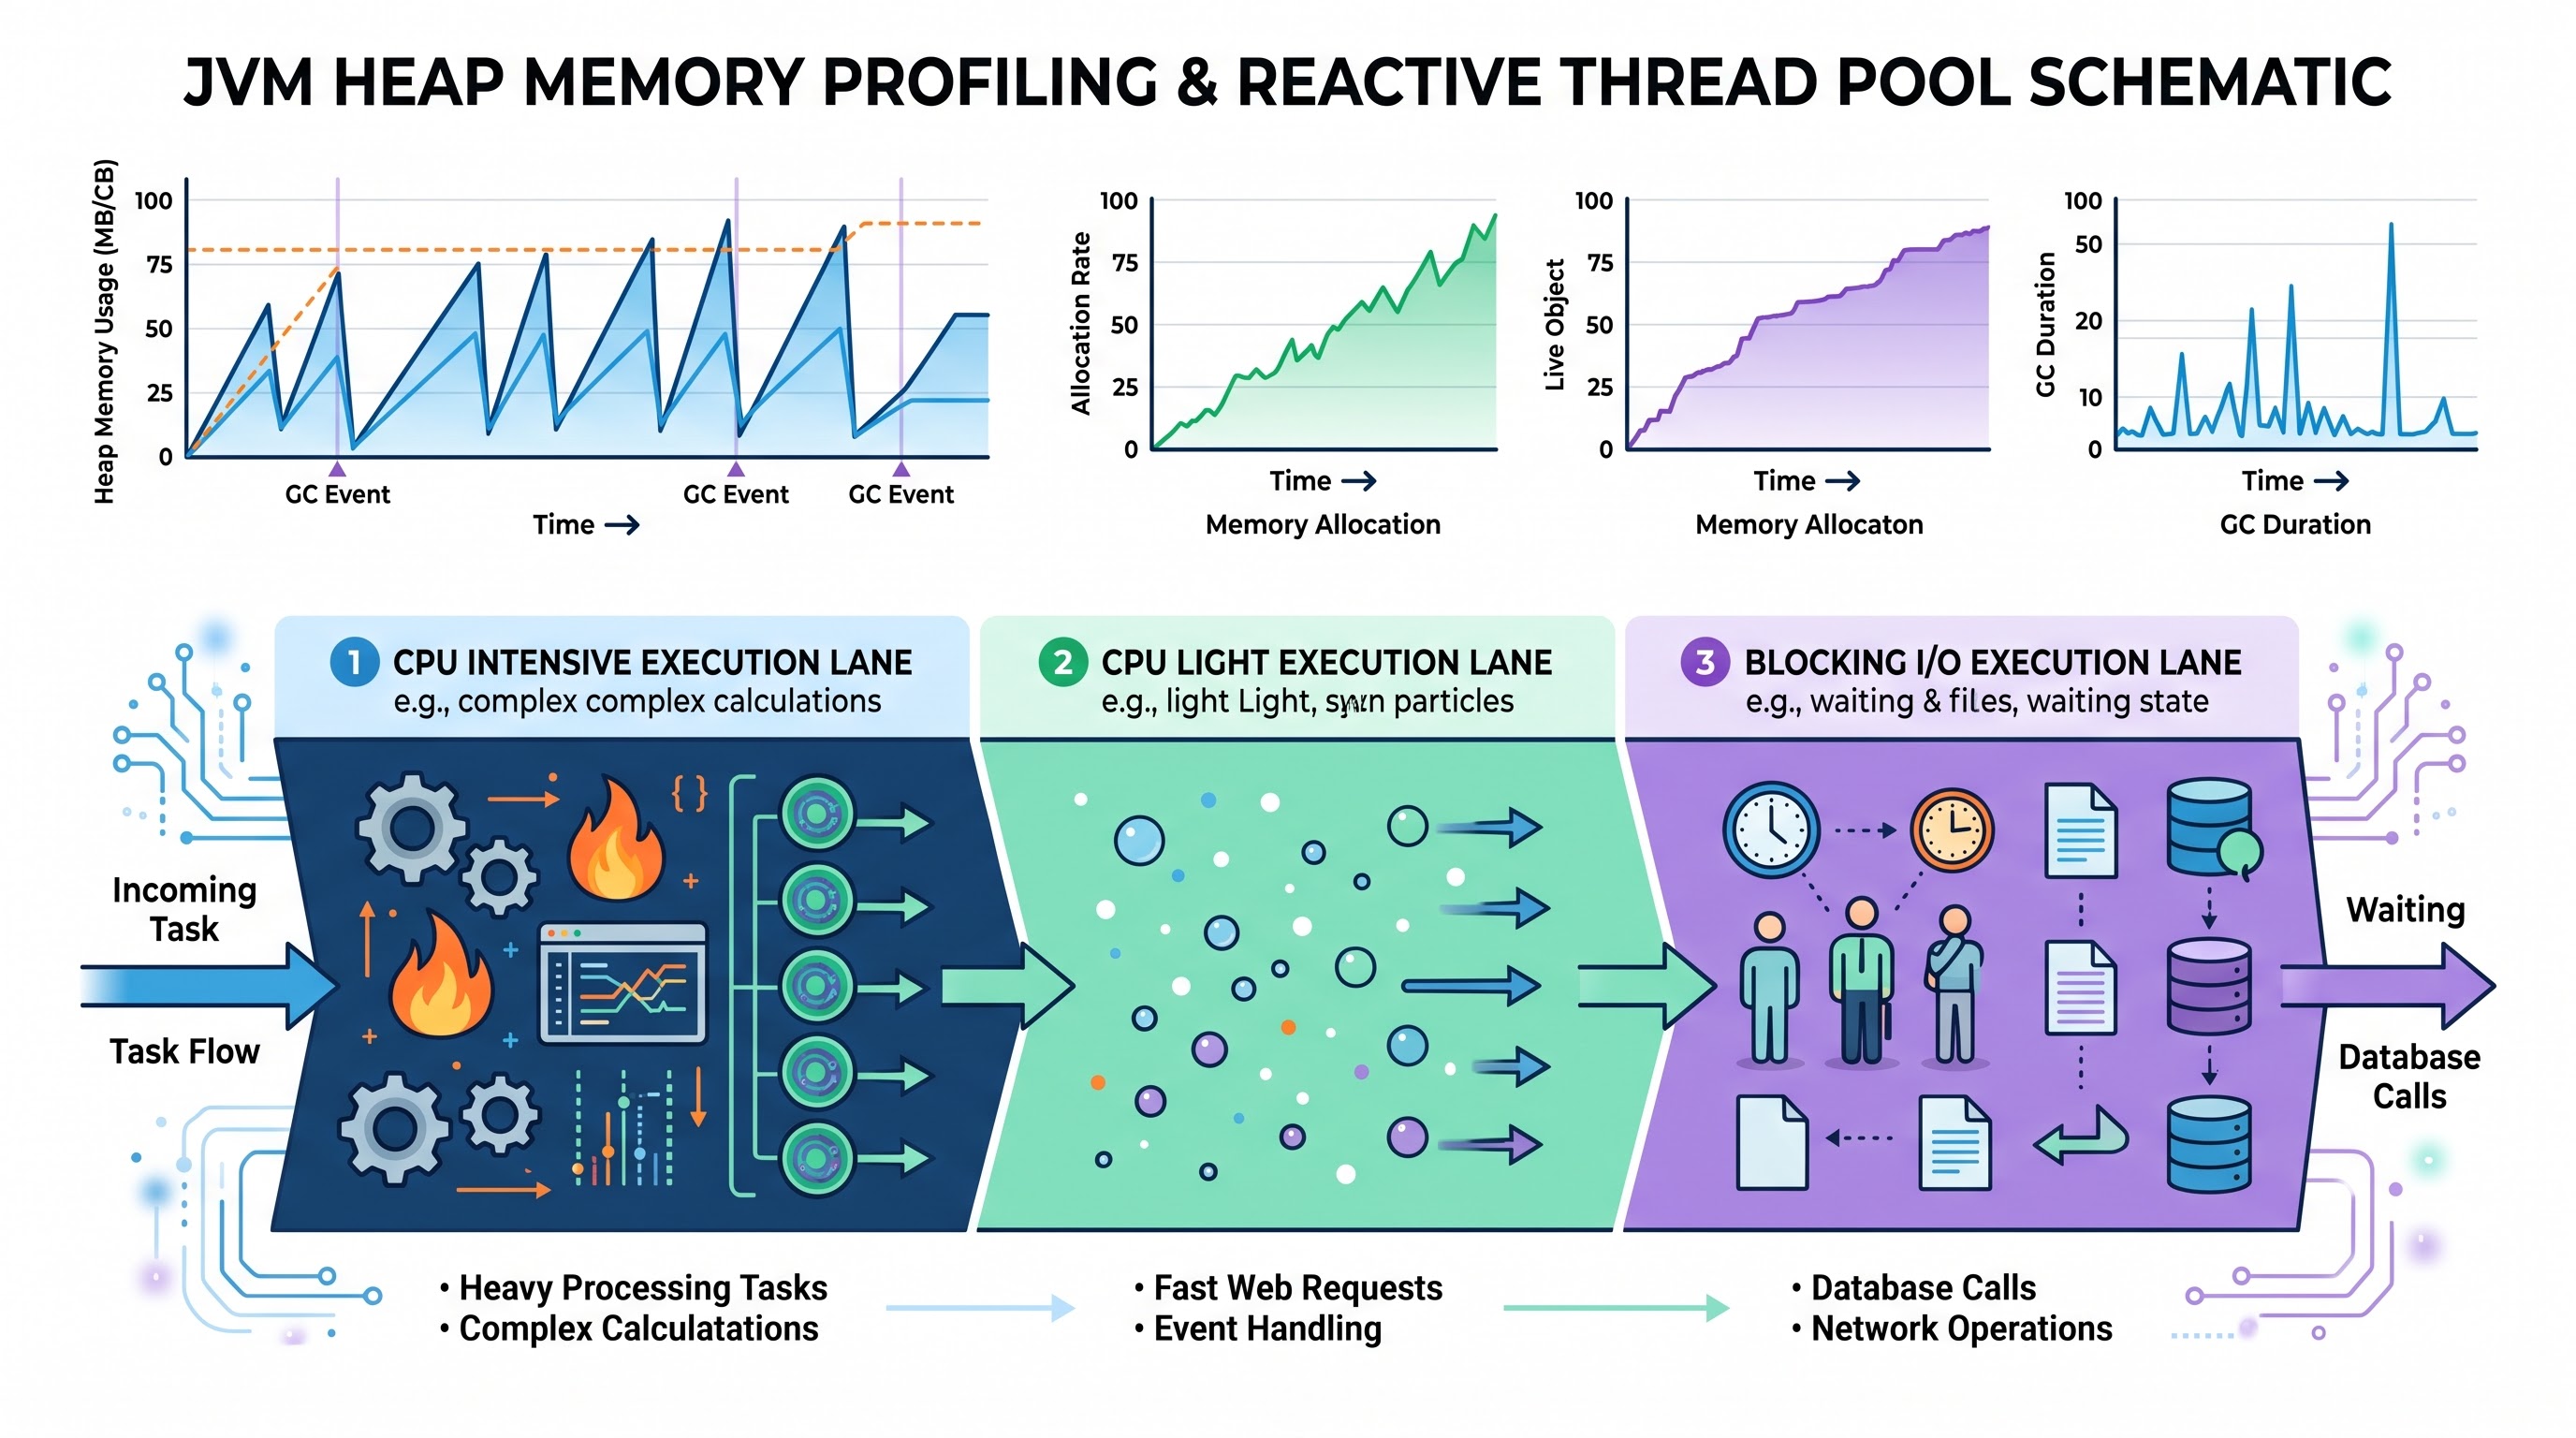
Mule 4 came up with the reactive execution engine that can route work between three main thread pools: CPU Intensive, CPU Light, and Blocking I/O. This is critical for understanding the low footprint nature of Mule applications.
Whenever an application does intensive transformations, the runtime executes such transformations in the CPU Intensive pool that scales linearly with the number of cores. However, on fractional cores configurations, the CPU Intensive pool has limitations to ensure that the host is not over-subscribed. When an integration flow combines intensive DataWeave transformations and slow external requests in a suboptimal loop, the runtime wastes a lot of processing budget in switching thread contexts.
Architects must separate the intensive data transformations from I/O operations by using asynchronous dispatchers, internal VM queues, or processing per stage. By doing intensive processing in chunks in a non-blocking way and offloading transport-related I/O requests to the Blocking I/O pool, the runtime works effectively.
Given that the knowledge of thread pools and non-blocking I/O depends on a proper understanding of the runtime engine, having completed a complete mulesoft developer course ensures that developers possess the necessary know-how to build efficient flows that operate reliably using minimal vCores.
Elimination of Polling Anti-patterns
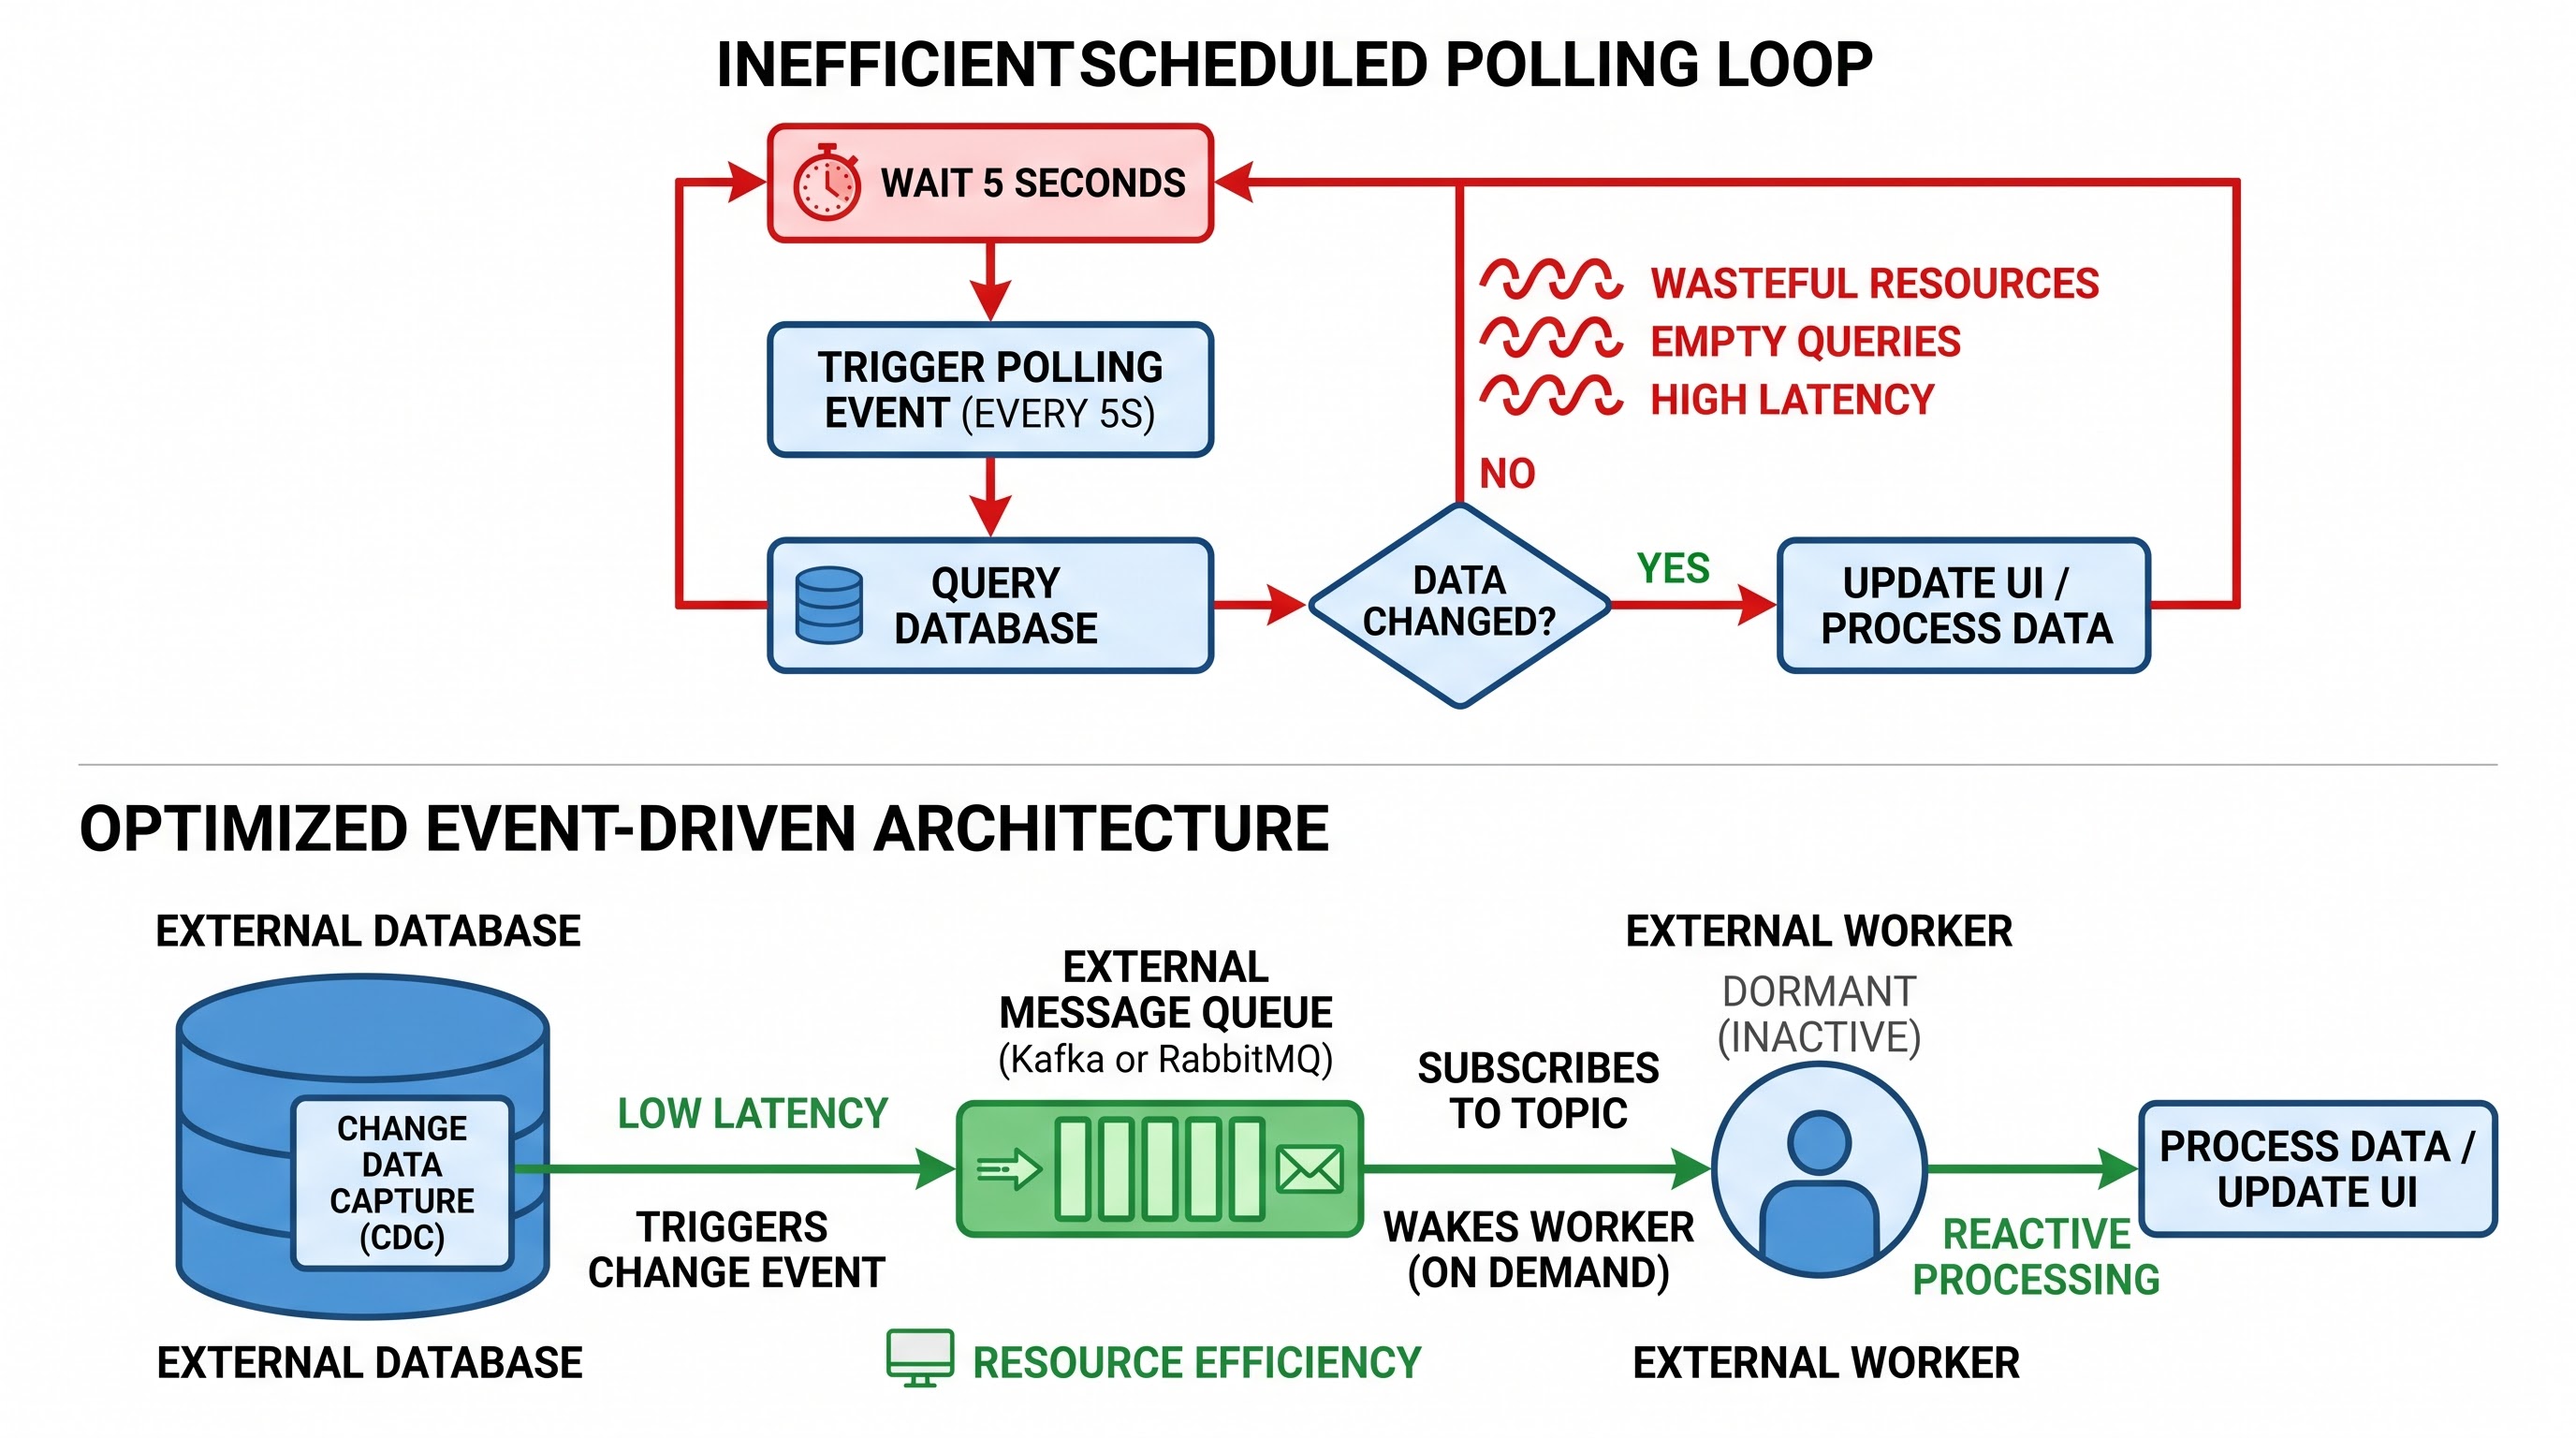
Polling connectors like scheduled database requests, file-drop listeners, and queue readers are commonly the sources of wastage of core resources. A polling source that executes a request every five seconds to look for new entries takes up CPU cycles consistently for processing connections, empty responses, and initializing transactional context for execution.
A reduction in the footprint of platforms can be achieved through a shift from polling architecture to push architecture. Triggers on relational databases, CDC pipelines, and webhooks send the events into lightweight message brokers that in turn inform the Mule application only when there is something to do. The elimination of continuous polling ensures that the idle CPU consumption of the integration application becomes close to zero.
Handling State External to the Application
Applications which handle state internally through use of persistence object storage, grid storage in the memory space, or even big in-memory caches need more memory to be allocated and thus can’t be used in the fractional core setup.
Externalization of state from the compute layer to use external stateful components to manage caching, idempotence check, and session state, such as enterprise Redis layers, Anypoint MQ, or external key value storage, cuts down on the memory consumption of the Mule application to a great degree.
Deployment Architecture and Structure Consolidation
Apart from fine-tuning individual apps, the high-level structure of your deployment architecture controls your overall platform cost. Consolidation of applications together with the environment to which they are deployed based on organization-specific factors may result in considerable savings in licensing fees.
Micro-Services Versus Macro-Services: Practical Application of Structure Consolidation
Integration community’s adoption of microservices architecture resulted in the excessive fragmentation by development teams. Each API endpoint treated as a separate project with a separate deployment process often produces hundreds of underused single-purpose apps.
One of the highly efficient approaches to licensing footprint reduction is practical application of structure consolidation. Close interface grouping into one unified deployment provides opportunities to reuse the same runtime, JVM, and OS environments.
For instance, five different System APIs that interface with the same ERP system—managing stock, order lookup, price inquiries, invoice verification, and shipments—can be combined into an ERP System Service. Rather than having five separate 0.1 vCore workers (using up a minimum of 0.5 vCores or 1.0 vCore for failover), the service can be hosted on two 0.2 vCore workers for full redundancy in just 0.4 vCores.
This consolidation will increase the efficiency of memory baseline usage, reduce network latency between interconnected processes, and greatly simplify monitoring, while maintaining the logical separation of contracts with defined routing policies.
Transfer of Processing to CloudHub 2.0 and Runtime Fabric
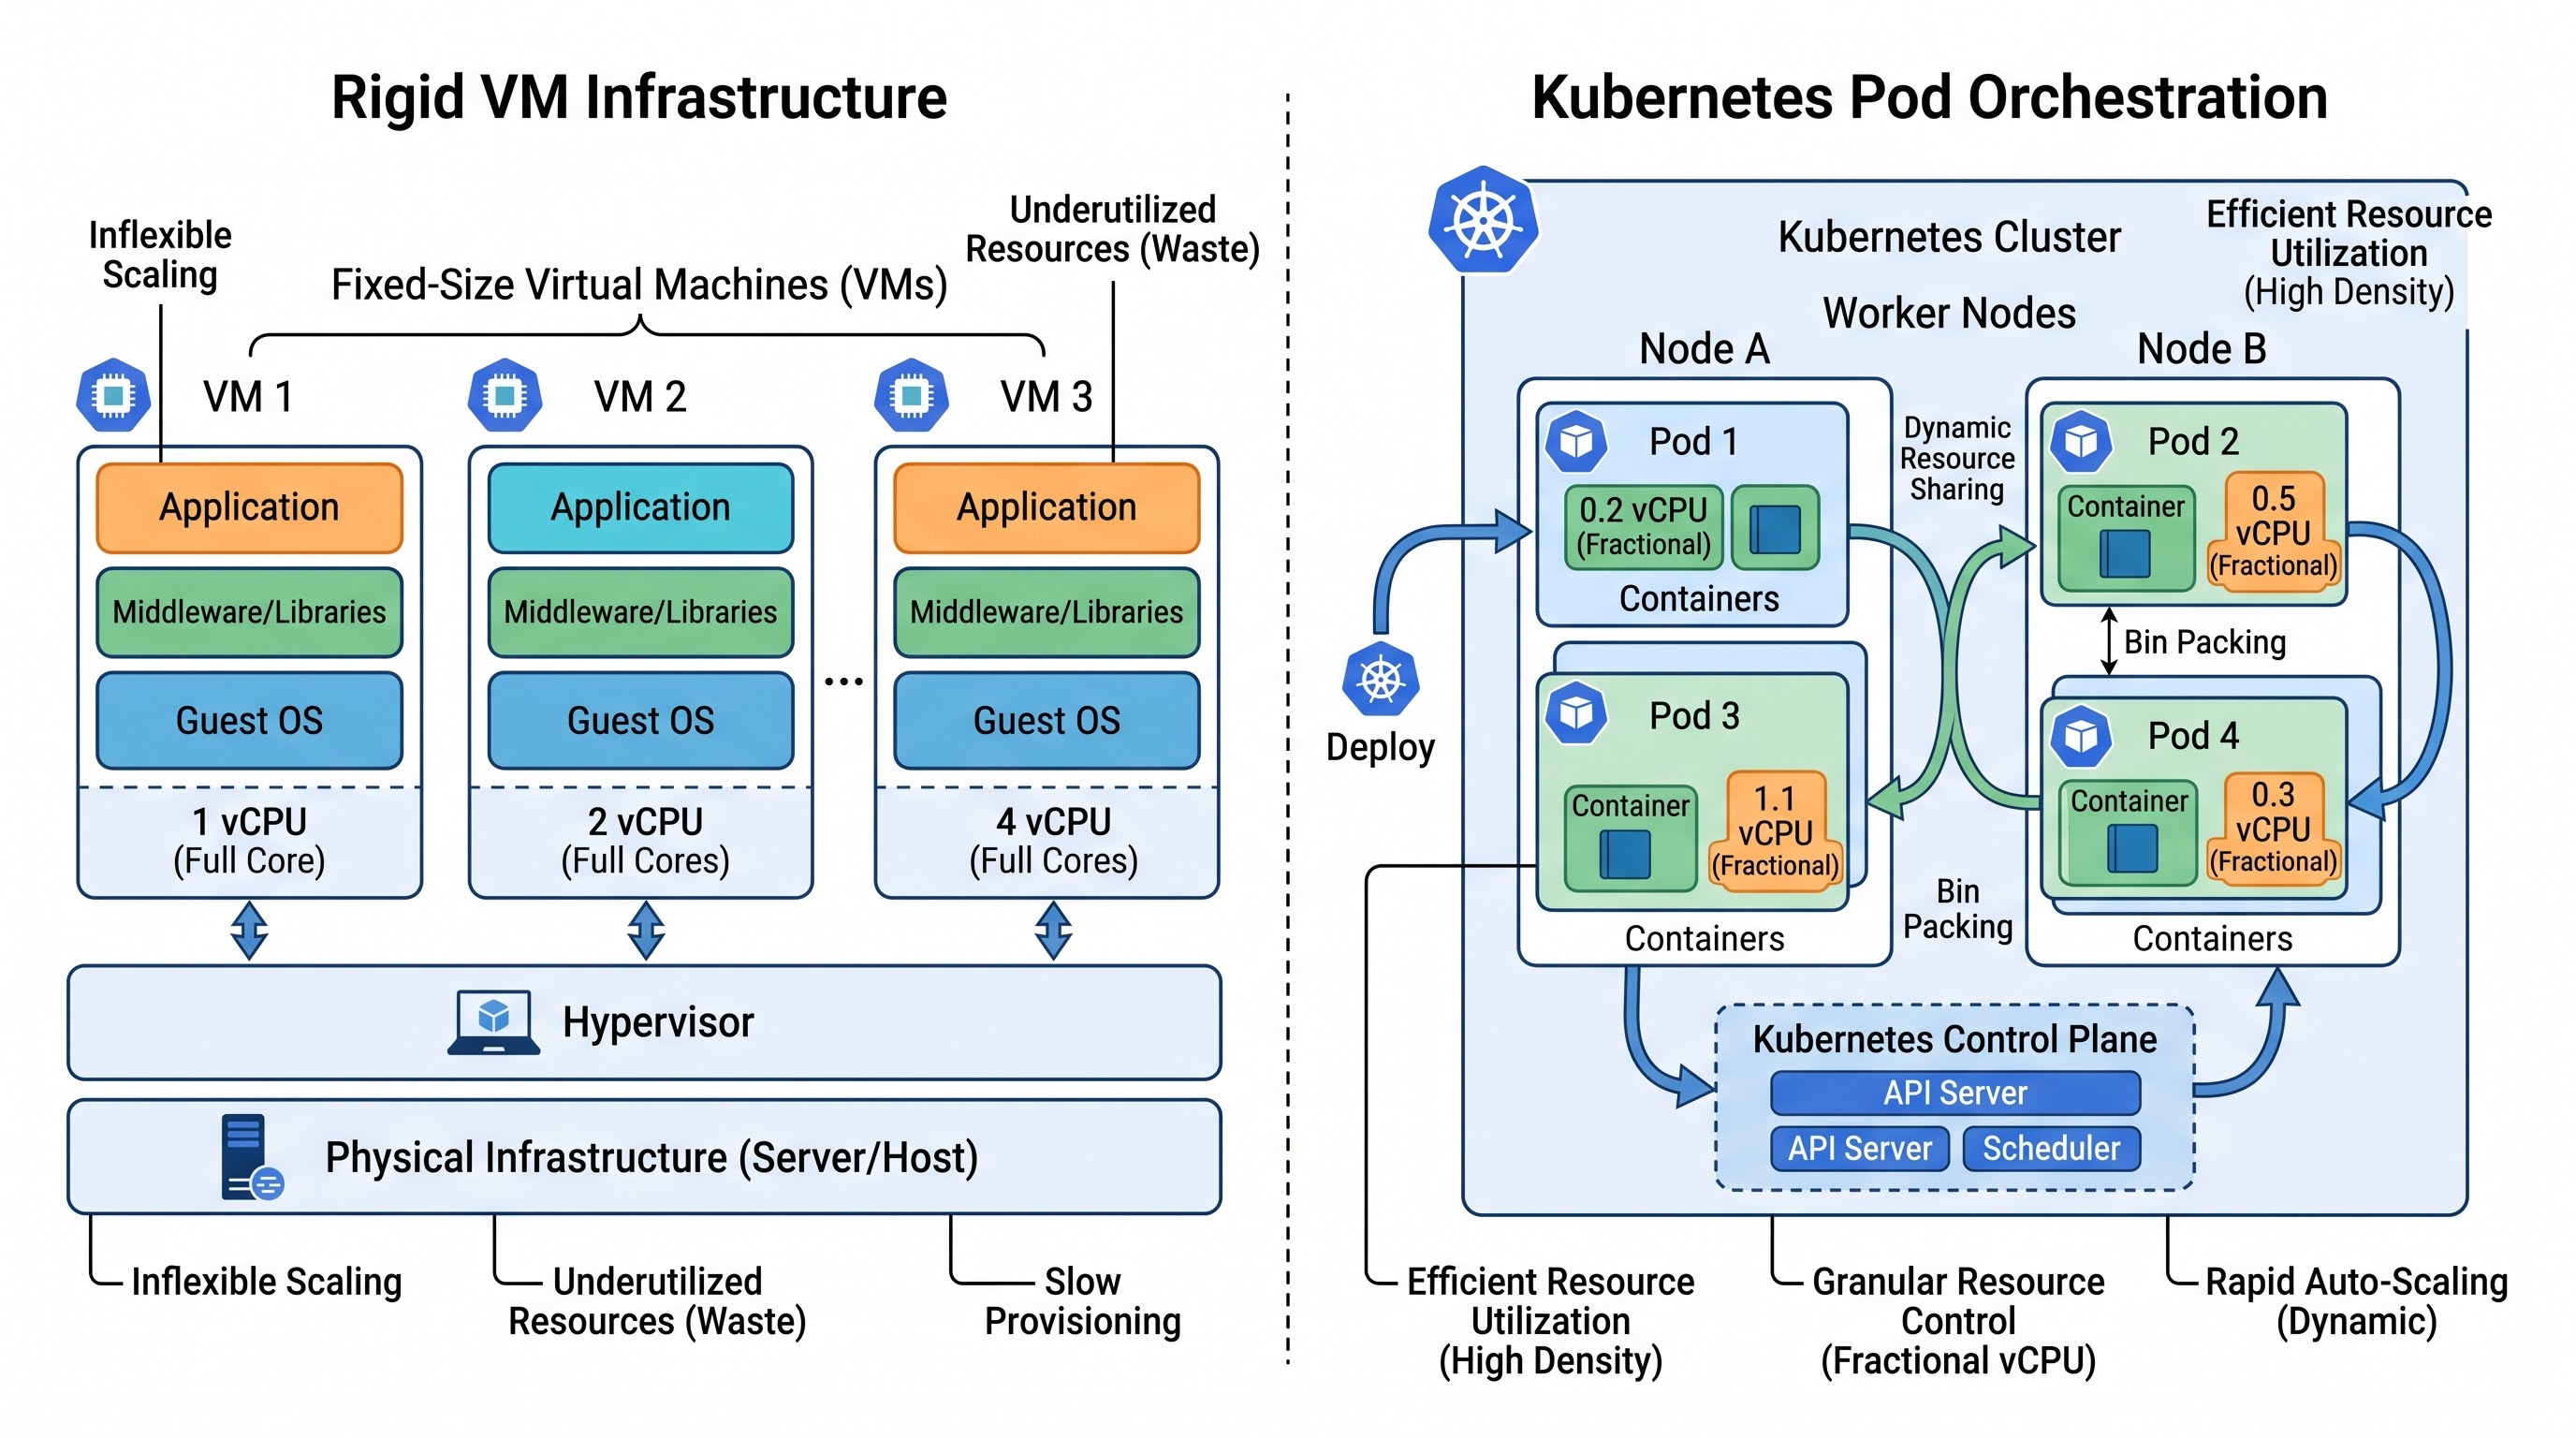
Companies working extensively with CloudHub 1.0 experience difficulties related to structural sizing constraints. The inflexibility of fractional tiers offered by CloudHub 1.0 causes issues for architects, as the need for a 0.2 vCore worker and 1.0 vCore worker leaves no way out for intermediate load sizes.
Transitioning to the more contemporary approach of hosting services using containers, either CloudHub 2.0 or Runtime Fabric, changes everything. With the help of containers, CPU limits and requests can be set in far greater detail than in CloudHub 1.0.
In addition, Runtime Fabric provides the possibility to deploy several runtime copies onto one high-density compute node. Instead of overpaying for operating system licensing as well as virtual machine management for hundreds of CloudHubs, containerized orchestration allows for high-density workload processing. Idle host capacity is dynamically allocated to surging pods, increasing work performed per each core license.
Separation of Real-Time APIs from Batch/ETL Processes
Running large batch synchronization tasks on compute resources that are allocated for low latency real-time APIs will result in over-allocation. As soon as the multi-gigabyte data synchronization process starts, CPU and memory usage become excessive, forcing engineers to permanently over-allocate the worker in order to avoid timeout errors of incoming REST API requests.
First of all, MuleSoft is a platform for enterprise service buses and API management, but not for batch ETL tasks. High volume data transfer, migration and other long running ETL processes must be separated from MuleSoft and moved to a different batch processing solution.
In cases where batch processing cannot be avoided in MuleSoft, the process has to be architecturally separated from the rest of the synchronous API architecture. Isolating these processes into separate workers enables teams to increase computing power for specific batch processes in designated time frames and reduce it right after processing is finished.
Governance, Observability and Automated Utilization Cost Management
Sustainable cost and employee optimization needs solid governance controls. Otherwise, optimizations performed today will be undone within several development cycles when new applications are added without sizing controls.
Continuous Telemetry and Monitoring
Developer competence standardization across distributed teams is one of the vital pillars of governance. This can be achieved through the mandatory acquisition of mcd level 1 certification by integration engineers, thereby proving that teams understand profiling of memory, setting up of connectors and avoiding capacity issues.
Optimization of an organization’s footprint involves granular and longitudinal visibility into the performance of compute instances. Simply putting faith in default platform dashboards that report average usage of CPU and memory instances hides the brief but highly intensive bursts of processing that degrade performance.
Organizations need to push their Anypoint Platform metrics through the Anypoint Monitoring telemetry APIs or streaming log collection services into enterprise observability systems such as Datadog, Dynatrace, New Relic, or Splunk. Aggregating such metrics over weeks and months allows architects to create automated utilization baselines that address crucial questions:
What applications do not use more than twenty percent CPU capacity in a rolling ninety-day period?
What applications show signs of heap exhaustion indicative of memory leak?
What worker allocation was doubled for a production issue that occurred several months ago and has not been scaled back yet?
The power of continuous observability enables the transformation of sizing into a science rather than a subjective discussion, giving architectural review boards the facts needed to make sure downsizing happens.
Automated Lifecycle Management and Non-Production Environments Management
Non-production environments (e.g., Development, Testing, Integration, QA, and Staging) are often the largest source of inefficiencies in compute usage for an enterprise. In many companies, non-production environments take up forty to sixty percent of the total core licensing.
Organizations have to set up infrastructure-as-code and scheduled pipeline automation in order to retrieve non-production resources back. By means of Anypoint Platform REST API and using orchestration tools such as GitHub Actions, Jenkins, or Terraform, companies will be able to automate the management of their testing environments:
Reduce the size or decommission all non-production applications outside work schedule, during weekends and holidays.
Create ephemeral environments which would automatically provision and tear down once the pull request is merged, end-to-end integration tests are performed and completed.
Restrict non-production worker sizes strictly to 0.1 or 0.2 vCores, except in the case of obtaining consent from senior architecture who grants an exemption to use larger instances in non-production environments.
The aggressive automation of shutting down and dynamic provisioning in non-production environments will help to get huge capacity of computing resources back and redeploy them for production or eliminate them from future renewals.
Conclusion: Converting Architectural Expertise into Competitive Advantage
Modern enterprise software economics require that integration architecture cannot exist in a vacuum from the point of view of infrastructure costs. If one assumes that compute resources are plentiful and of no real consequence, then budget growth will quickly become unsustainable, and the platform itself becomes overly costly to operate.
Optimizing the MuleSoft stack is all about achieving the right architecture. The way to do so is by getting rid of core proliferation, migrating from resource-intensive data processing to stream processing, eliminating polling loops in favor of events, and automating governance in non-production environments. This way, organizations will reduce their licensing footprint.
Importantly, optimizing a MuleSoft platform will not compromise performance or reliability. In fact, an environment consisting of lightweight, stateless, non-blocking services running on properly sized infrastructure will be much more resilient, easier to manage and monitor, and simpler to manage than a bloated system of bloated runtimes.
A successful creation of an affordable and properly sized platform is largely determined by the competence of the developers who work on this platform. For those who wish to establish themselves as such professionals, acquiring a mule soft certification qualification by enrolling in enterprise training programs is recommended.