
Power BI Desktop vs. Power BI Service: The Ultimate Architectural
Last updated on Aug 4, 2026
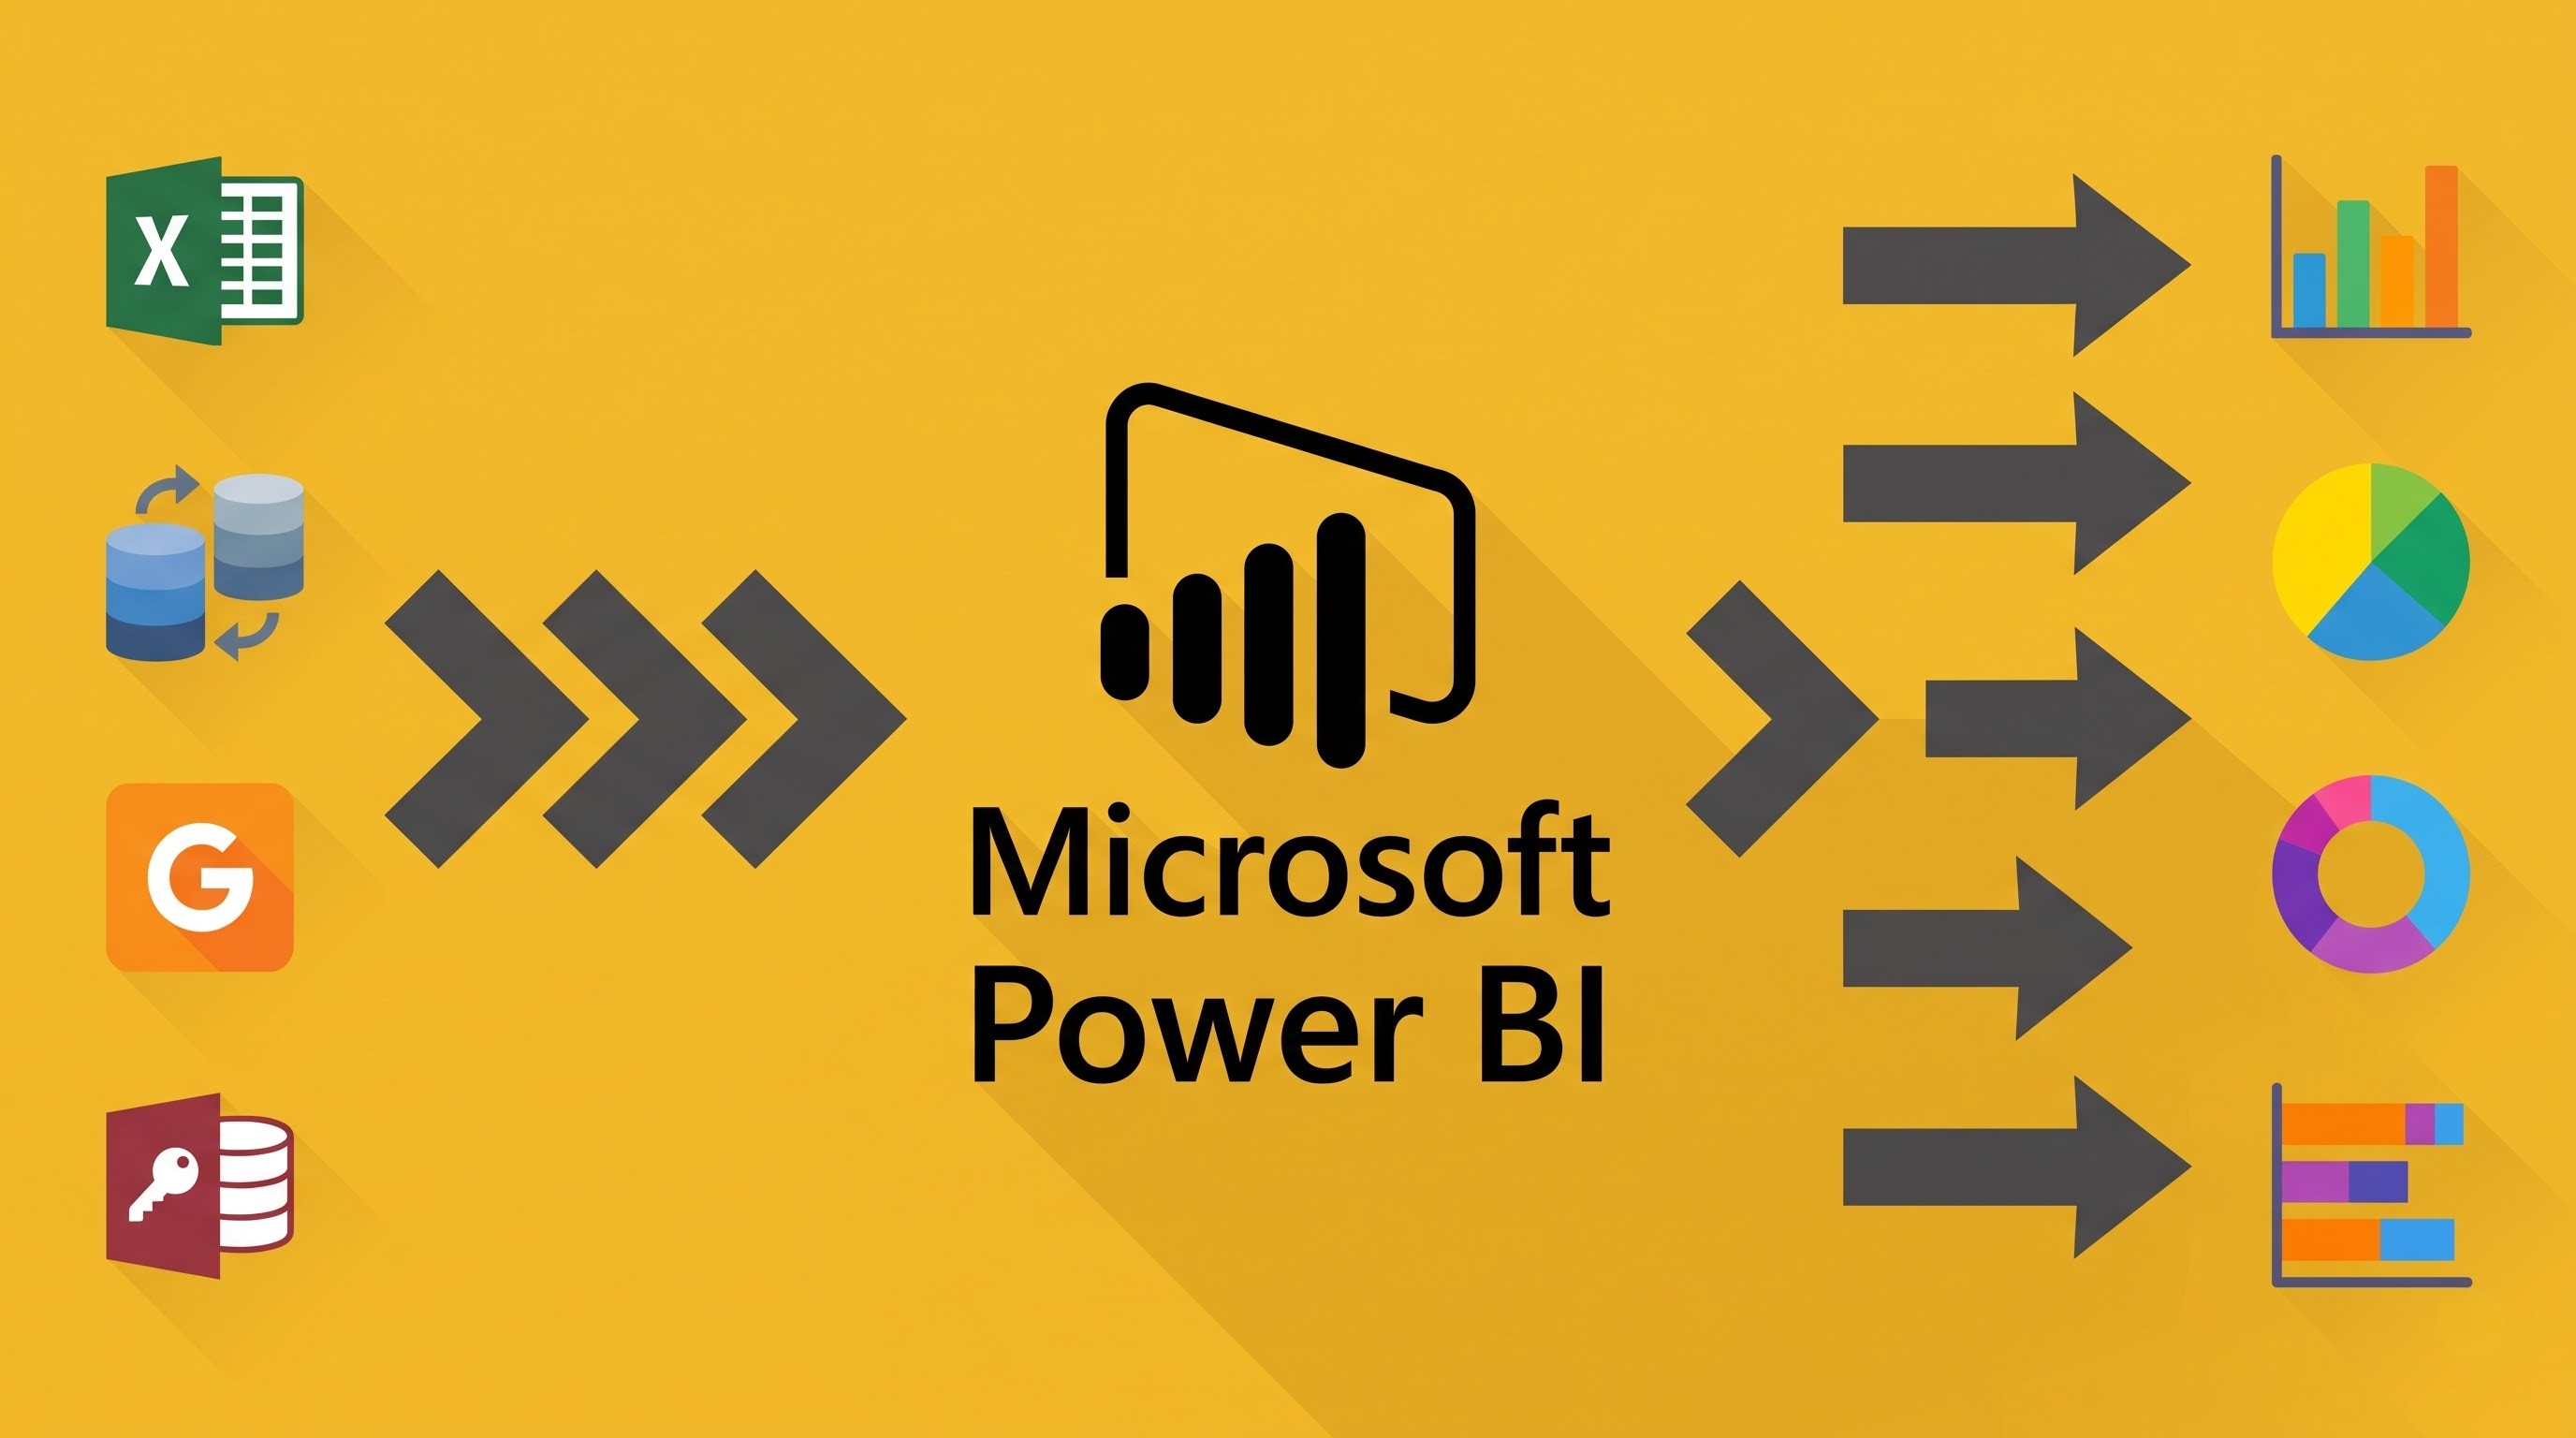
In Microsoft’s BI architecture, both Power BI Desktop and Power BI Service play complementary roles in the overall process of conducting analysis. Understanding the differences and interrelations between these tools is important for both designers and consumers of analytics.
To visualize this idea, one can use a movie production metaphor.
Power BI Desktop represents a private movie studio where specialists produce movies. Power BI Desktop is the stage where raw data (the unedited film) is processed and transformed. The data specialists utilize the Power Query M language and DAX expressions in Power BI Desktop to create the single architecture of the BI solution, clarify the data relations, and design the visuals of the final report.
Therefore, to make it easier to work on developing insights, you should say that you need to use Desktop for working on it and utilize Service in the end... To overcome the differences between local model building and online reports publication, you should find the best powerbi training online.
The Power BI Service is a worldwide network of cinemas and online platforms. When reports are ready, they go on to this Software-as-a-Service (SaaS) solution powered by Microsoft Azure. Power BI Service serves the purpose of distribution where organizations share different types of information based on formats. It provides an environment in which people can observe reports through software, make queries, configure automatic updates on reports, create presentations of information collected using different reports, and establish secure information sharing across all company levels with the help of Microsoft Entra ID.
To summarize, when developing insights, one should work with Desktop but use the Service for their presentation. If you try to work in Power BI without realizing this distinction, it would be the same as creating a movie without a theater; you will have an excellent movie produced but not a way to showcase it for professionals.
In order to be able to understand the ways of using the two environments together for building enterprise-level reports, one should consider getting enrolled in a best power bi online training.
Executive Summary: The Main Principles Behind Architecture
Looking at the structure of the program, there are six main areas in which Power BI Desktop and Power BI Service have some differences: primary purpose of each application, the architecture, targeted users and type of the data storage.
Purpose and Architecture
Power BI Desktop is a program that operates in a Windows operating environment for the process of design and data modeling. On the contrary, Power BI Service is a SaaS-based platform for sharing, collaboration and governance.
Targeting and Data Engine
Desktop is used only by analysts and other specialists involved in data shaping processes. The program operates using two main engines: VertiPaq and Power Query M. Meanwhile, Power BI service is used by business executives and people involved in BI management.
Storage of Files and Expenses
With respect to data management as well as the costs associated, Power BI Desktop supports the .pbix file type that is stored in a user’s hard drive and is completely free of charge. In contrast, Power BI Service processes these files into the cloud environment, including cloud workspaces, semantic models, dashboards, or application packages and sells licenses periodically—e.g., Power BI Pro, Premium Per User (PPU), and so on.
Power BI Desktop - An In-Depth Look
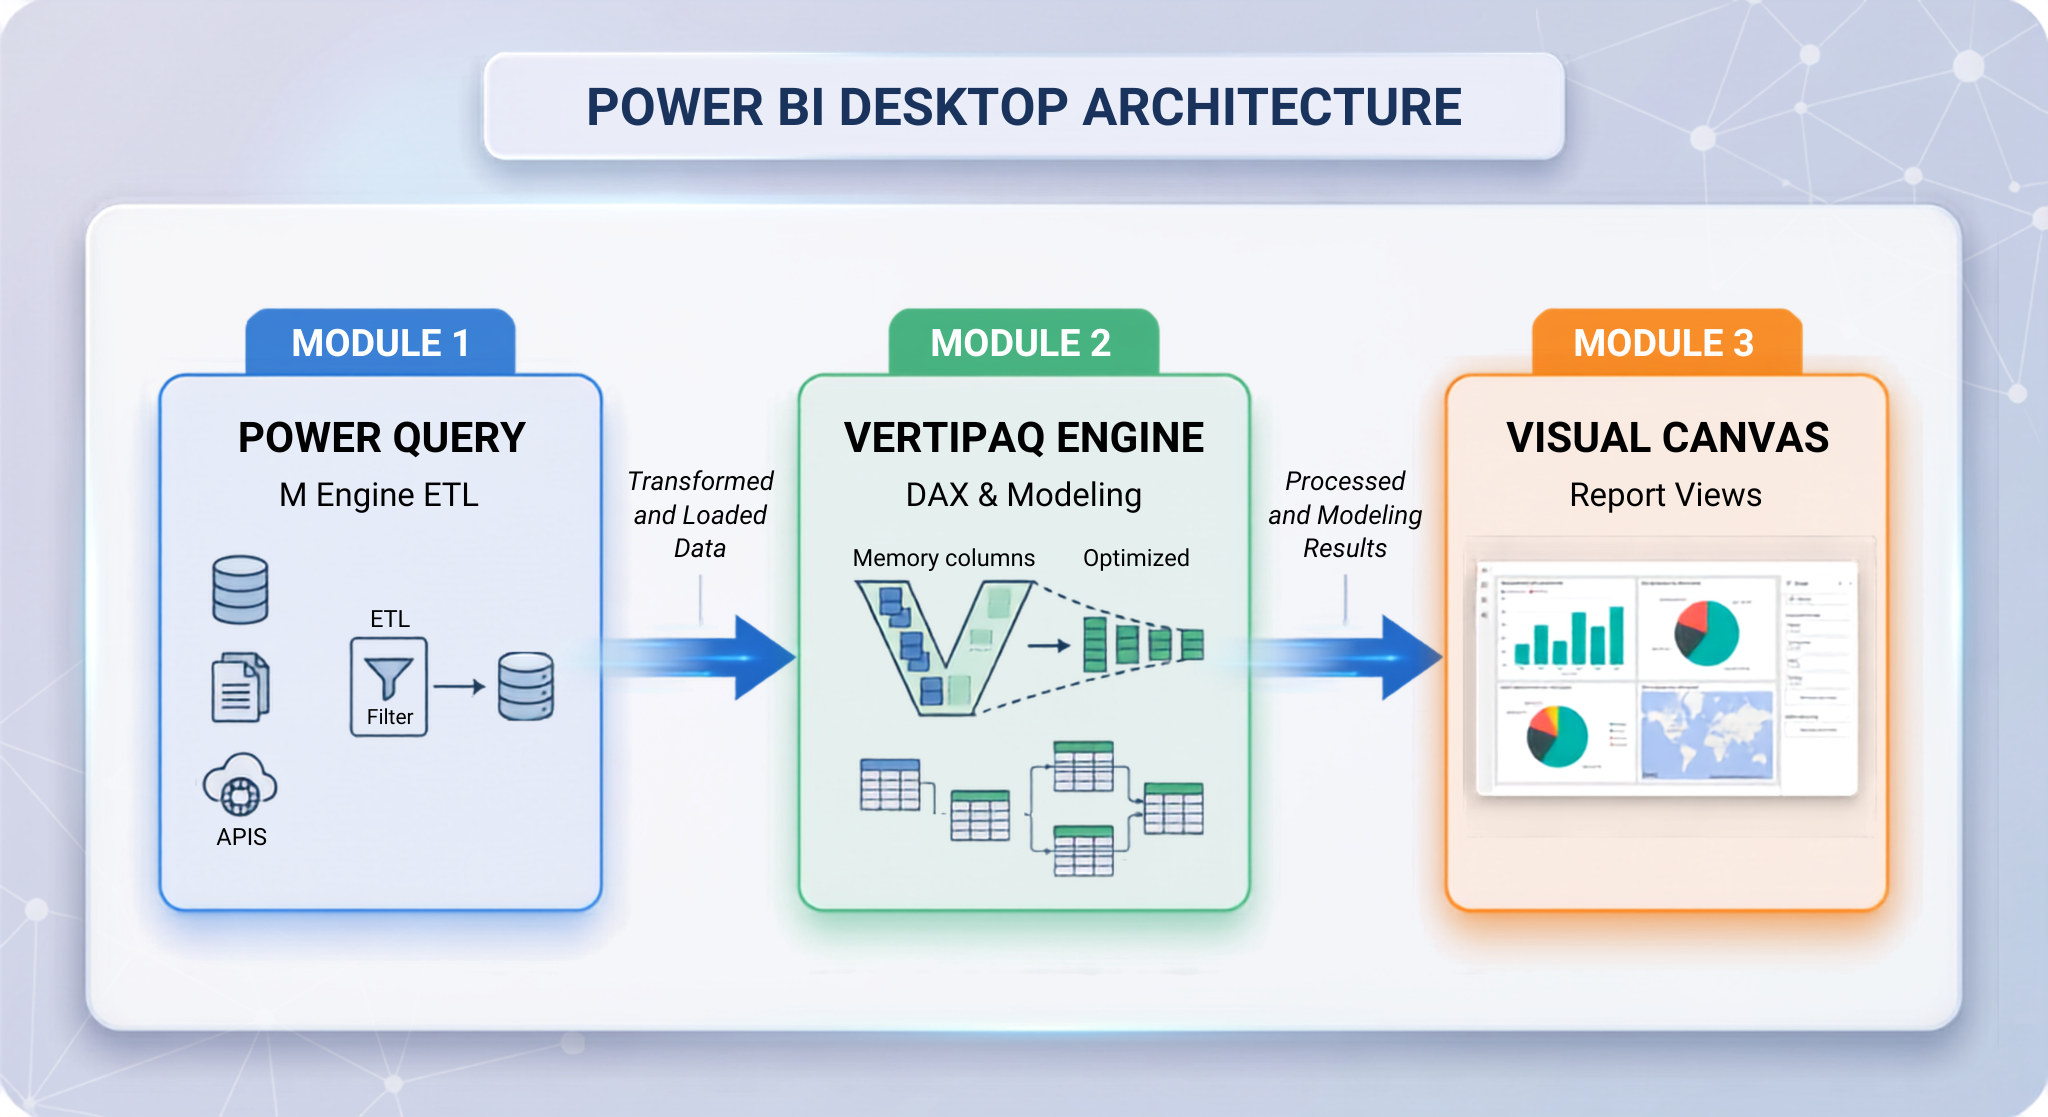
Power BI Desktop can be defined as a free Windows application that is installed on your computer and used in creating reports and conducting complex analytics works. This program serves as an engine that works locally and consists of three core tools that work together.
A. Capturing and Processing Data with Power Query / M
The Power Query Editor, driven by the M programming language, is found within Power BI Desktop.
Data Sources: Links to more than 100 types of on-premises or cloud-based environments (SQL Server, Oracle, SAP, Excel, REST APIs, Azure Data Lake, or Web interfaces).
ETL Actions: Refines, splits, combines, reshapes, modifies data types, and creates complex joins.
Query Folding: Converts transformation into SQL-based database queries, thus performing most calculations on the server.
B. Data Modeling & DAX Calculation Engine
The in-memory tabular engine (VertiPaq) is what is functioning behind the visualization canvas.
Dimensional Modeling: This type enables the creation of Star Schemas, relationships (1-to-many, many-to-many), cross-filtering behavior enforcement, and managing mark-as-date tables.
DAX (Data Analysis Expressions): The full capability to write complex measures, calculated columns, calculated tables, dynamic field parameters, and context transition logics (CALCULATE, FILTER, intelligent time measures).
C. Report Visualization & Layout Canvas
Drag-and-drop designing of visualizations across the formats of the multi-page report canvas.
Settings of formatting concerning bookmarks, selection panes, synchronizing slicers, visual interaction, drilling-through paths, and the use of visual tooltips.
Performance Analyzer: An analytics tool that comes with a platform and checks time for queries that are being processed.
Desktop Setbacks
Lack of Corporate Collaboration: You can't distribute reports directly in Desktop with the help of real-time permissions; you can only send .pbix files via email (this means that the actual underlying data systems are exposed).
Only Manual Updates: To get fresh data in Desktop, you need to open the program and press "Refresh".
No Executive Dashboards: Desktop enables the production of multi-page reports, yet it lacks dashboards (which are one-page summaries that take information from several reports).
OS Restrictions: The application can only work in a specially-designed environment of 64-bit Microsoft Windows.
Further Information: Power BI Service
Power BI Service, which can be found at app.powerbi.com, is the Software as a Service (SaaS) product built by Microsoft in the cloud and houses the data on the platform Azure. Power BI Desktop serves as local working space; Power BI Service operates as the main facility of the company enabling distribution of reports, updates, and data management.
1. Automatization of Data Refreshing and Gateways
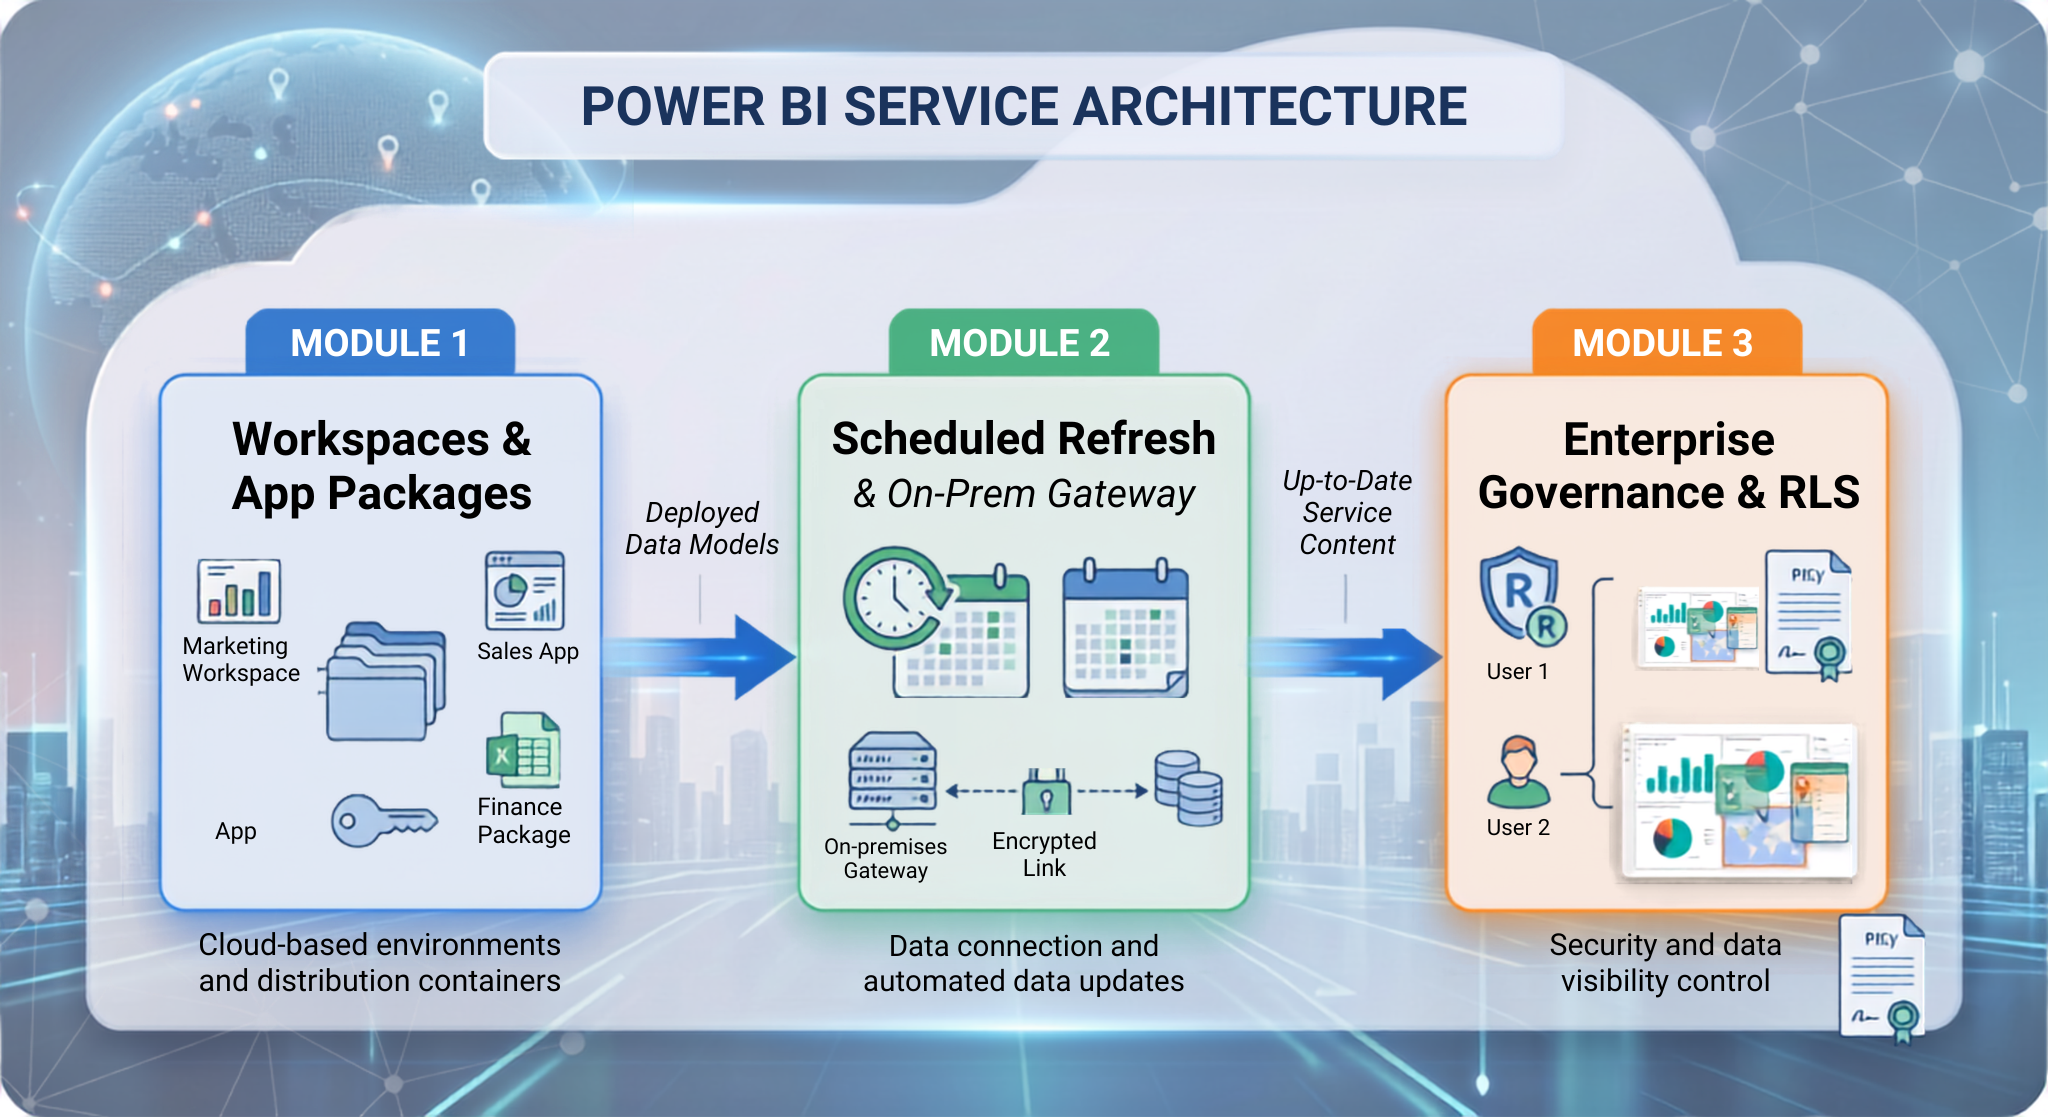
Without a proper freshening process, static reports often lose their relevance. Power BI Service helps companies with this issue by providing service for Scheduled Refresh which makes possible to update datasets up to 8 times per day for users with Pro license and up to 48 times for users having Premium/Fabric capabilities. For users with local infrastructure, using On-Premises Data Gateway people will easily create a safe and encrypted connection between local corporate networks (like SQL database or shared files) and the Azure cloud while starting the data retrieval process without any risks for the organization's internal firewall.
2. Executive Reporting and Natural Language Q&A
Power BI Service – unlike Power BI Desktop facilitating creation of multiple analytical reports based on a single dataset – allows creation of dashboards for executives. This will allow users to pin visualizations from different reports on one summary dashboard. To enhance accessibility for users, Power BI has included a Natural Language (Q&A) function which enables users to ask questions like "Show the revenue per country for Q3" and generate graphs instantaneously.
3. Enterprise Collaboration along with Content Distribution
Power BI Service is helpful in creating a support system for analytics teams. Developers use the Workspaces as common staging spaces to create and manage the content before compiling the final version in Power BI Apps, which are read-only packages for wider distribution across the company. Microsoft 365 can be used in a neat way as it allows users to showcase their reports in MS Teams channels, SharePoint sites, PowerPoint presentations, and even in Outlook. Moreover, it is possible to set up automatic Alerts and Subscriptions for immediate notifications via email or Teams when important numbers exceed the limit.
4. Governance, Security and Lineage Tracking
An enterprise deployment necessitates stringent oversight of who has access to view data. Row-Level Security (RLS) logic is initially set up from the Desktop environment, while Power BI Service associates certain email addresses or Microsoft Entra ID security groups to those roles to enable organizations to uphold the highest levels of privacy in production settings. Through Data Lineage View, administrators can get visibility into the company's data pipeline by examining where raw data is mined from underlying data sources, passed through dataflows, processed in semantic models, and published in reports until it is finally put into dashboards. Finally, support for Sensitivity Labels provided through Microsoft Information Protection (MIP) means that high-security encryption classification is still retained, even if the data has been passed to other formats, for example Media, like Microsoft Excel.
Comprehensive Feature Matrix
To identify the difference between Power BI Desktop and Power BI Service in terms of analytical functionality, one needs to analyze their respective underlying technologies in various areas like data processing,For data ingestion and transformation processes, Power BI Desktop connects with a potential of over 100 different local, cloud, and APIs sources with full support of Power Query, including M-language editor and formula bar. Power BI Service, however, connects mostly to already available datasets, Dataflows, cloud APIs and OneLake, providing only limited Power Query functionality anywhere except with the use of Datamarts and Cloud Dataflows.
Regarding data modeling and calculation processes, Desktop offers developers maximum flexibility in creating proper tabular models, calculated columns, DAX measures and similar. On the other hand, modeling in Power BI Service is very limited and users can only create basic measures via the web editor.
In terms of visualization processes and reporting, Desktop provides users with full control over visualization formatting, design features and the ability to create multi-page reports while Power BI Service allows only basic tweaking in the web editor. More than that, when it comes to dashboards creation, the situation changes: Desktop can only produce the previously mentioned multi-page reports while Power BI Service allows dashboard creation via pinning of different visuals.
The operational aspect of refreshing data and sending alerts makes it obvious how automated the cloud platform is. While a refresh in Desktop requires hitting the refresh button at one’s local workstation, with the Power BI Service, the refresh is taken care of automatically with the help of Data Gateways. Moreover, the Desktop version lacks real-time data alerts altogether—these are present in the Service version only.
In terms of collaboration and security, the Desktop relies on offline sharing of files (.pbix file through saving, emailing), local business logic testing for row-level security and traditional connection methods (import and direct query). The Service, on the other hand, takes the above-mentioned functions to an enterprise level, as it allows for cloud collaboration (workspace, organization apps, links), tying the cloud RLS rules into the desktop ones, and enjoying the full capability of Microsoft technology stack through the use of Direct Lake, OneLake and Fabric items.
What is the meaning of platform exclusivity?
Understanding what platform exclusivity is allows organizations to avoid expensive mistakes in their business intelligence implementations.
Power BI Desktop Capabilities
Power Query Advanced Editor: Development of original M codes, custom functions, and creation of complicated data merging.
Calculated Columns and Calculated Tables: the making of actual DAX-calculated information structures in the underlying model.
Management Function of Relations: Functioning with relationships in a way of drag and drop on multi-table structures.
Performance Analyzer: Exact visualization and DAX query delay profiling activity.
Running Python & R Scripts: Local statistics processing execution, and R/Python Creation.
Links to External Tools: Creating links with tools developed by people from the community, such as Tabular Editor and DAX Studio.
Attributes Exclusive to Power BI Service
Executive Dashboards: Dashboard pinboards that aggregate visuals from various datasets into one single page.
Scheduled Refreshes & Gateways: Processes that facilitate the running of pipelines in the background.
Publishing of Apps: Combining multiple reports into a single app for the users.
Dataflows & Data marts: Cloud-based ETL processes which can be utilized in many reports.
Metric Scorecards: Monitoring systems for measuring KPIs with automatic calculations of targets.
Usage Metrics & Auditing: Monitoring the total number of views, user activities, and obstacles in performance.
Issues of Licenses & Prices
It is very important to understand the meaning of the licenses before moving from individual trial analysis to deployment of the system at a corporate level.
Licensing Overview
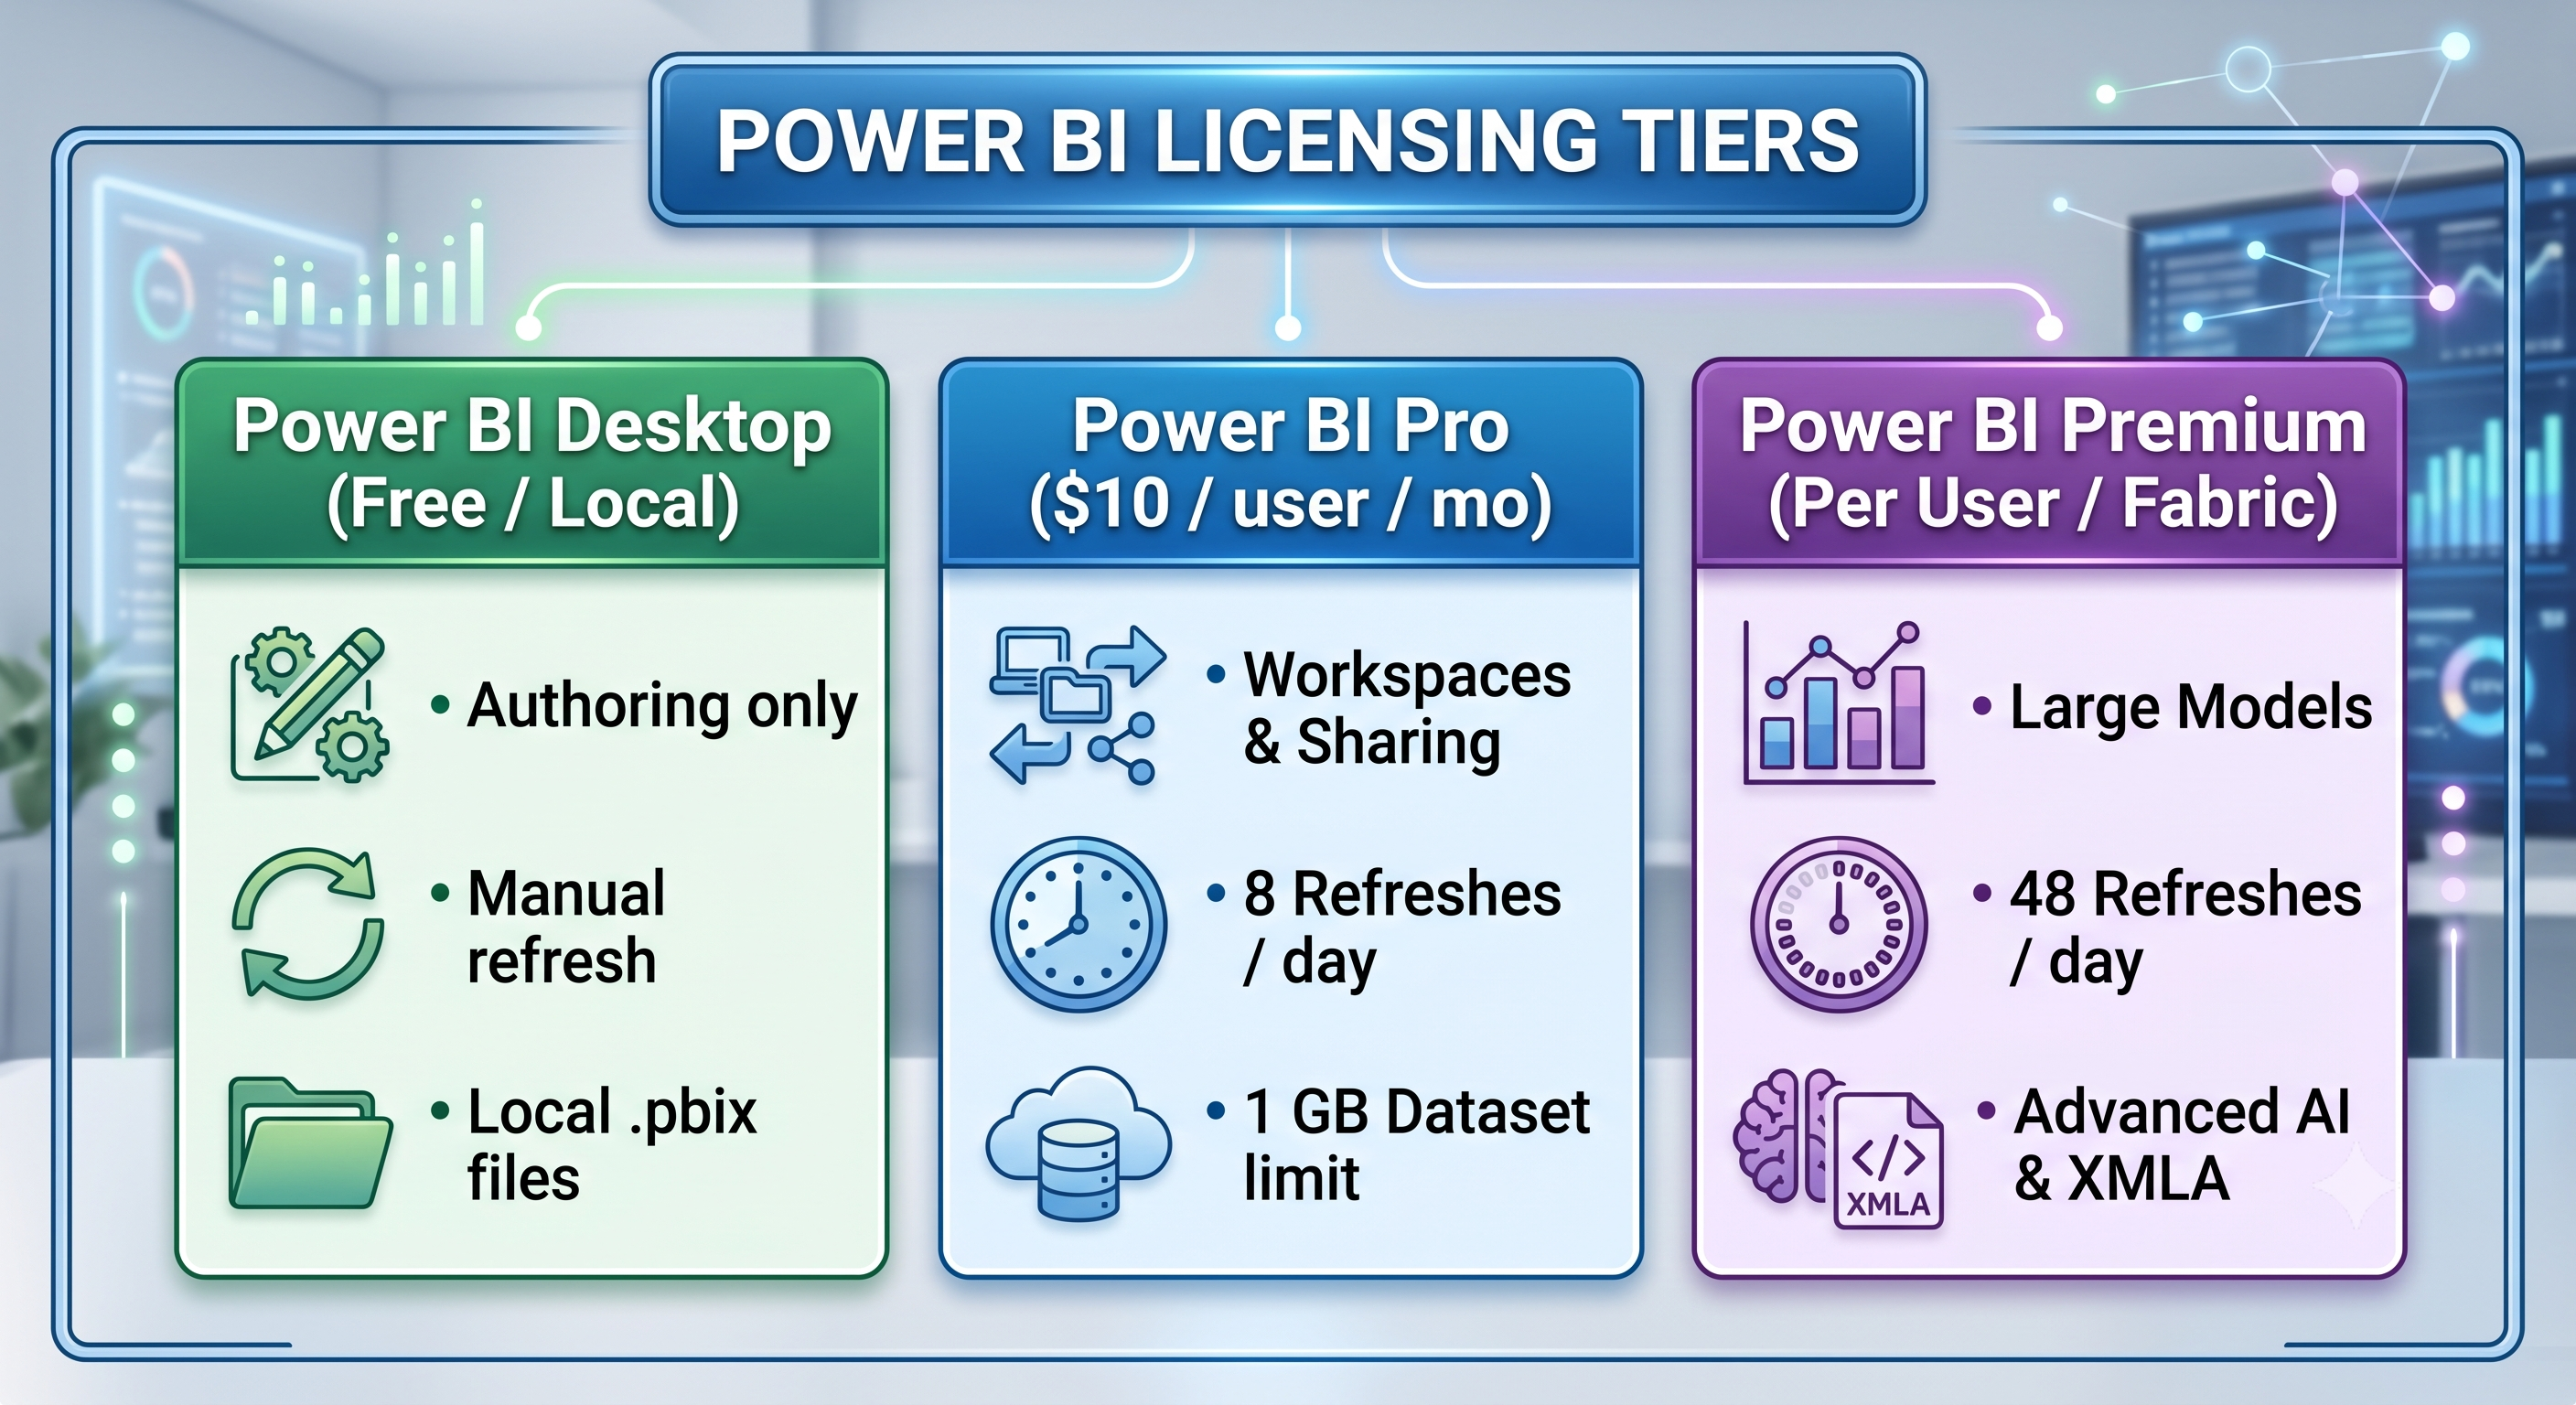
Power BI Desktop (Free):
Price: Free.
Audience: Independent analysts, students, and writers.
Usage: Create an infinite number of reports locally. No workspace or cloud services if you don't have a paid workspace subscription.
Power BI Pro:
Cost: About $10 per user/month.
Usage: Small/medium sized groups produce and deliver reports.
How it works: “Collaborate in Power BI Services. Notice: Reports producer/consumer may not share content without a Pro license.
Power BI Premium (PPU)
Price: Roughly $20 per user per month.
Target Audience: Power BI Advanced Users working with big data sets.
Download data sets up to 100 GB. Paginated reports, advanced AI and 48 data refreshes per day.
Microsoft Fabric Capacity (F-SKUs / Organizational Capacity):
Price: Customized pricing starting from F2 to F64+.
Audience: Corporations with hundreds or thousands of consumers.
Usage: Organizations that have set up F64 capacity or higher will allow its free account users to consume reports.
One needs to comprehend that the Desktop functions for designing and thinking stages of the report preparation, while Service serves for collaboration and automation. If you find it necessary to learn about the software from the professionals, the best option for you would be to take one of the best online power bi training to receive the needed knowledge.
The Enterprise Workflow: The Collaboration of Desktop and Service
In a modern data-driven organization, both Desktop and Service play complementary roles as two phases of a common analytics workflow.
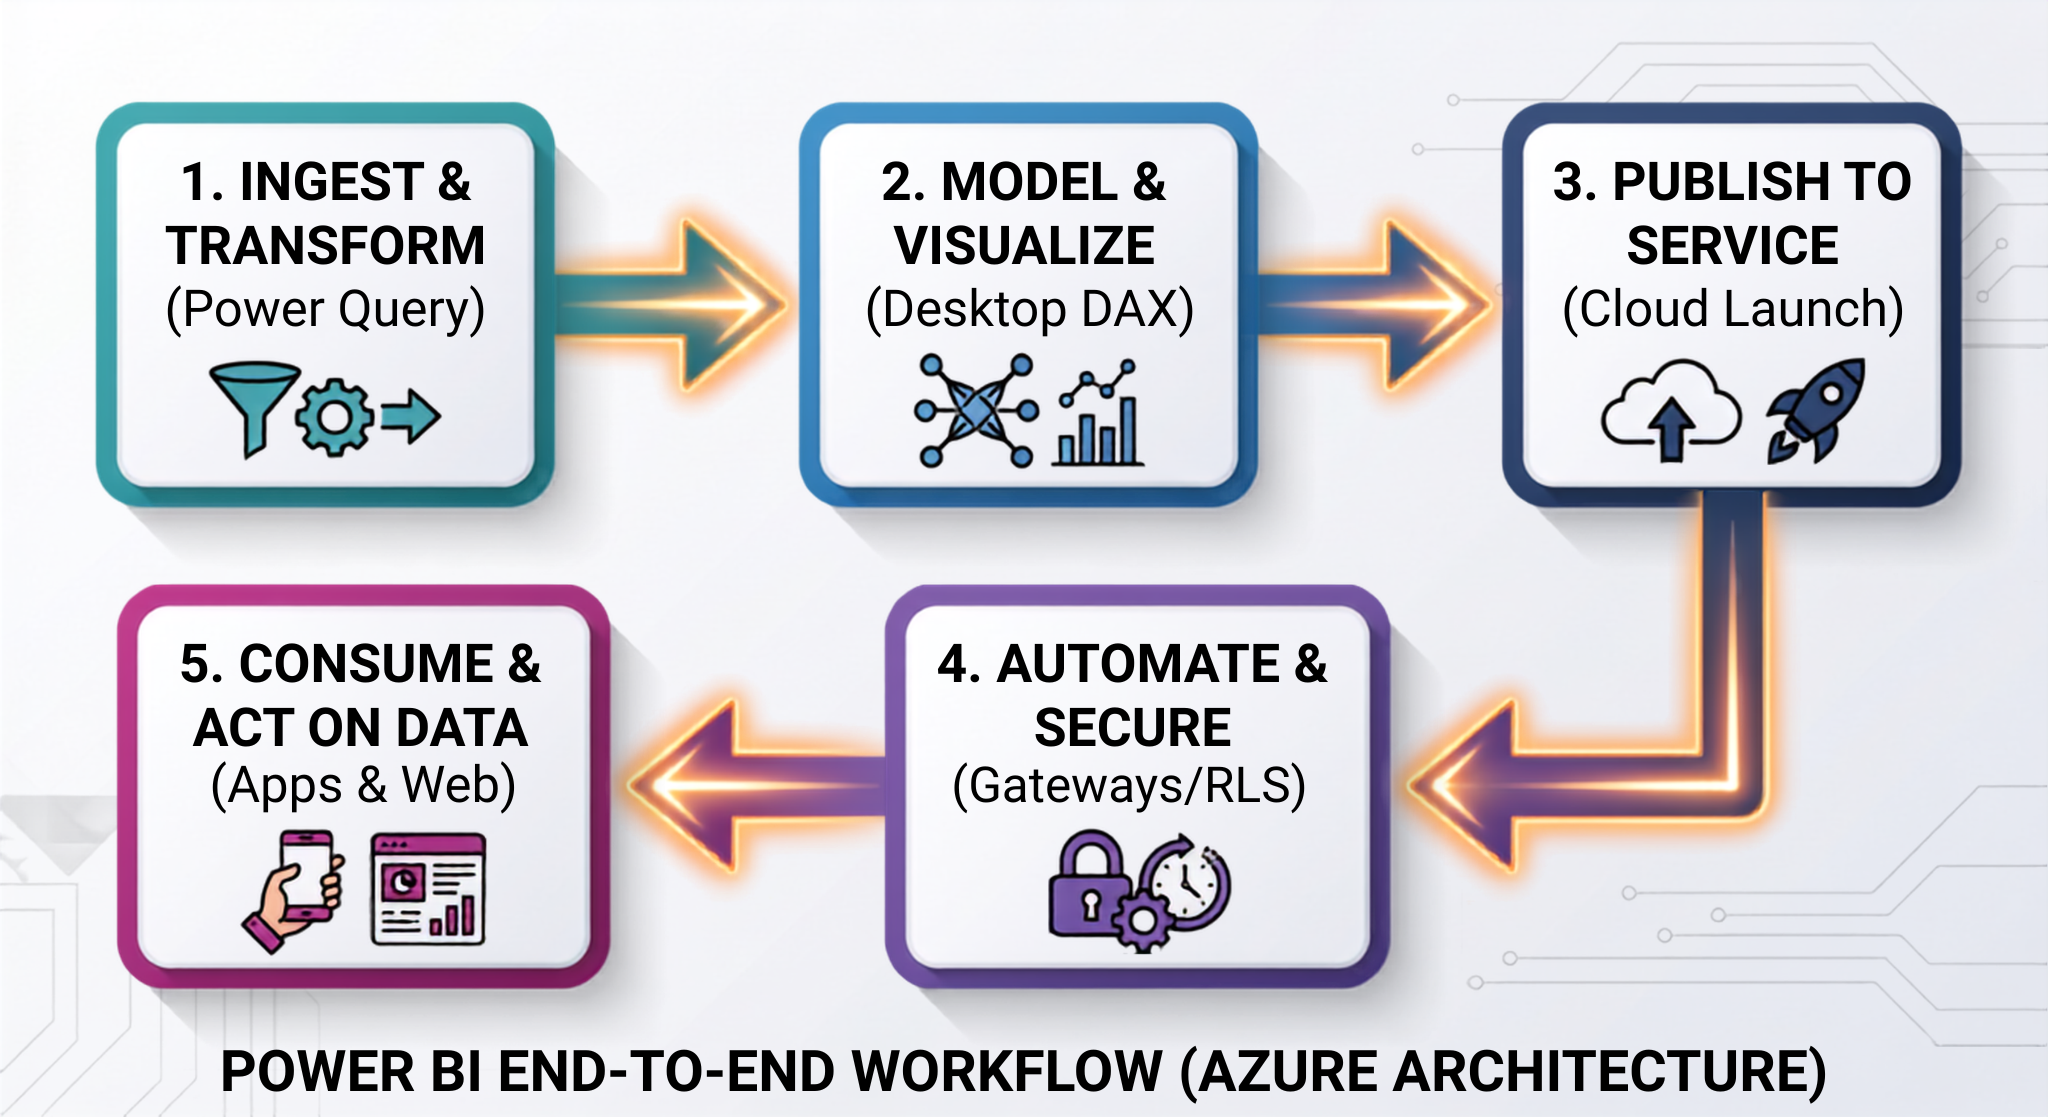
Phase 1: Building the report with Power BI Desktop
Power BI Desktop software is used by a data analyst to retrieve data from the company’s databases, cloud APIs and spreadsheet files.
Power query is used to clean up the data, remove duplicates and standardise information.
Necessary relationships are set up and DAX formulas (YoY Growth, Gross Margin %, Rolling Averages) are defined.
Finally, the report has a few charts, drill through pages and some slicers.
Phase 2: Publish and activate in the cloud.
The analyst signs in using the tenant account and clicks the Publish button within the Power BI Desktop software.
When you open Power BI Service the .pbix file is broken down into two . . .
Semantic Model: Data model containing data, queries, DAX formulas and relations.
Report: Part of .pbix file with visualisation and layout pages.
Phase 3: Configuration, Governance, and Automation
The BI administrator connects the newly published Semantic Model to the local Data Gateway.
A Refresh policy is created, for example, to update daily at 6:00 a.m.
Security managers map Microsoft Entra ID security groups to the row-level security roles created in Power BI Desktop.
Phase 4: Distribution of Results
All vital statistics emerging from the Report will be presented in the executive summary and some KPIs from other departments.
The report and the dashboard will be integrated into a general Power BI app and made available to other stakeholders within marketing, operations, and sales.
As the results become available in real-time, the business leaders will be able to analyze them in their web browsers or mobile applications, leave comments, receive the automated PDF documents, and form the necessary business strategy on the basis of relevant data.
Conclusion
There are two options available in the form of Power BI Desktop and Power BI Service. The difference between these two applications lies in the fact that if your task implies the creation of data, you should use Power BI Desktop. However, if you want to distribute the results of data analysis, Power BI Service seems to fit the bill better. The Power BI Desktop provides you with the needed toolkit during the development process, particularly when establishing the connection with the source of raw data, forming data models, and denoting complex DAX calculations.
When a report is created, the subsequent delivery of the report, automating the reporting process so executives receive timely reports, must be conducted through Power BI. The use of Power BI Service is required for automated refresh of information as Power BI Desktop does not support background processing. In addition, the Power BI Service will operate with different units’ heads using Microsoft security and Entra ID security for report sharing. Moreover, when report-sharing is needed at the executive level, creating a summary dashboard about key performance indicators is also only possible through the Power BI service due to the unique ability to pin visuals from various reports.
Therefore, it is important to set up Power BI by understanding that Desktop is where the designing and thinking phases take place, whereas the Service is where collaboration and automation happen.
Whether you would like to be able to create complex DAX codes using Desktop or be able to deal with cloud deployment of the reports generated via that application, by taking one of the power bi training online classes, you will get tailored training necessary for getting skills in both areas.