
Power BI Report Builder: A Comprehensive Guide to Paginated Reports
Last updated on Oct 14, 2026
Modern business intelligence is all about interactive dashboards, smart data exploration and cross-filtering. Executives manipulate slicers, drill through to the lowest levels of detail, and watch as their visualizations update in real-time on ultra-wide monitors. And yet, behind the dazzling dashboards of modern data warehousing, organizations are ruled by formal, structured documents. Invoices need to be mailed, regulatory reports filed with precise verbiage, hundreds of pages of financial statements reconciled to the penny, and warehouse packing slips printed on standard paper sizes.
Power BI reports designed for interactive exploration are optimized to be viewed on a screen, scaling fluidly and summarizing information effectively at any resolution. But when it comes to rendering an eighty-page invoice run or preserving line item accuracy for bound reports, an interactive canvas is not the right tool for the job. This is where paginated reports come in, authored in Power BI Report Builder.
This article will discuss the concepts of paginated reports, including their structure, composition, parameters, authoring, and life cycle. The article will also examine how companies use paginated reports to connect interactive paginated reports to a business’s analytical reporting needs and create functional reports that are pixel-perfect for print.
The Anatomy of Paginated Reporting
The very name paginated reports suggests the key design consideration, namely, that paginated reports are intended for visualizing information in a series of connected pages. A dashboard lives within the confines of a browser window or an application user interface. In contrast, paginated reports are aware of such constraints because a paginated report is typically designed to display information on a printed page or document. A paginated report designer should be able to position report elements precisely on the page. The design must also account for paper size and orientation, open areas on a page for headers, footers, and other elements specific to the pagination process.
Power BI Report Builder is a natural successor to SQL Server Reporting Services. Microsoft had continued developing SQL Server Reporting Services as an enterprise-level reporting tool. Microsoft has implemented the same rendering engine in Power BI Report Builder, which uses the Report Definition Language or RDL. Report Builder documents have an RDL file extension, as opposed to PBID for Power BI Desktop.
In business processes, analytical reports satisfy curiosity, while paginated reports satisfy liabilities. Analytical reports explain why sales decreased in the second quarter. Paginated reports print the actual invoice that is sent to the customer and that appears on the cash register. Analytical reports track inventory turnover rates; paginated reports print the pick-lists for the forklift drivers in the warehouse.
Since these reports often go to external viewers for approval or auditing, design precision matters. A table column is not going to magically slide to the right and appear in a horizontal scroll if it does not fit on the printed page. An invoice amount is not going to flow onto the next blank page when exported to PDF. With paginated reporting, the report author can design with pixel-level accuracy, and be confident that it will print, display, and export consistently across all client platforms.
Power BI Desktop Versus Power BI Report Builder

Power BI Desktop versus Power BI Report Builder is one of the most common problems raised by modern corporations which choose to design analytical solutions. Both of the platforms use organizational data, deploy reports to Power BI Service or modern fabric workspaces, and facilitate end-users with mission-critical insights. However, the two products are built with fundamentally different design engines and target audiences. Power BI Desktop is based on an interactive, visual paradigm while being driven primarily by VertiPaq in-memory columnar engine, complex DAX expressions, and interactivity. It is better suited for ad-hoc discovery, executive summaries, trend exploration, and self-service analytics.
On the other hand, standard Power BI reports are not optimized to absorb extensive tabular growth. If a developer builds a report which accommodates ten thousand detail rows, it will produce an internal scroll bar instead of generating dozens of clean, numbered pages with repeated column headers.
The Power BI Report builder on the other hand uses document first paradigm, which involves more coding than drag and drop operations. An author builds a report by defining report bands that hold visual elements. The bands can be header, body, detail grouping, and footer. The bands adjust their size depending on the data contained in each row. For example, a report with 100 rows may print on two pages while a report with 100000 rows will have page breaks, columns headers repeated on succeeding sheets, and page numbers on the footer among others. Reports generated using Power BI paginated are actual document templates thus exporting them to PDF or word formats maintains the exact format including borders and sizes.
When exporting interactive dashboards, Power BI generates a snapshot of what appears on the web interface. The export feature does not acknowledge scrollable grids thus cutting off data not visible on the preview panel. On the other hand, paginated reports use the same engine as their server counterpart. This means that every row of data is processed when generating a report for export to PDF, Word or print ready formats.
Bridging this gap between visual exploration and document design requires specialized skills. Thus, professionals seeking to become adept at both these environments tend to join power bi training online classes at OnlineITGuru to learn when to apply standard dashboards and pixel-perfect paginated templates
Core Architecture and the Design Workspace
The workspace of Power BI Report Builder is a hybrid between document publishing software and a database management studio. To work with it effectively you need to understand its core architecture – the Report Data pane, the design surface, the grouping pane, and the properties grid.
The Report Data Pane
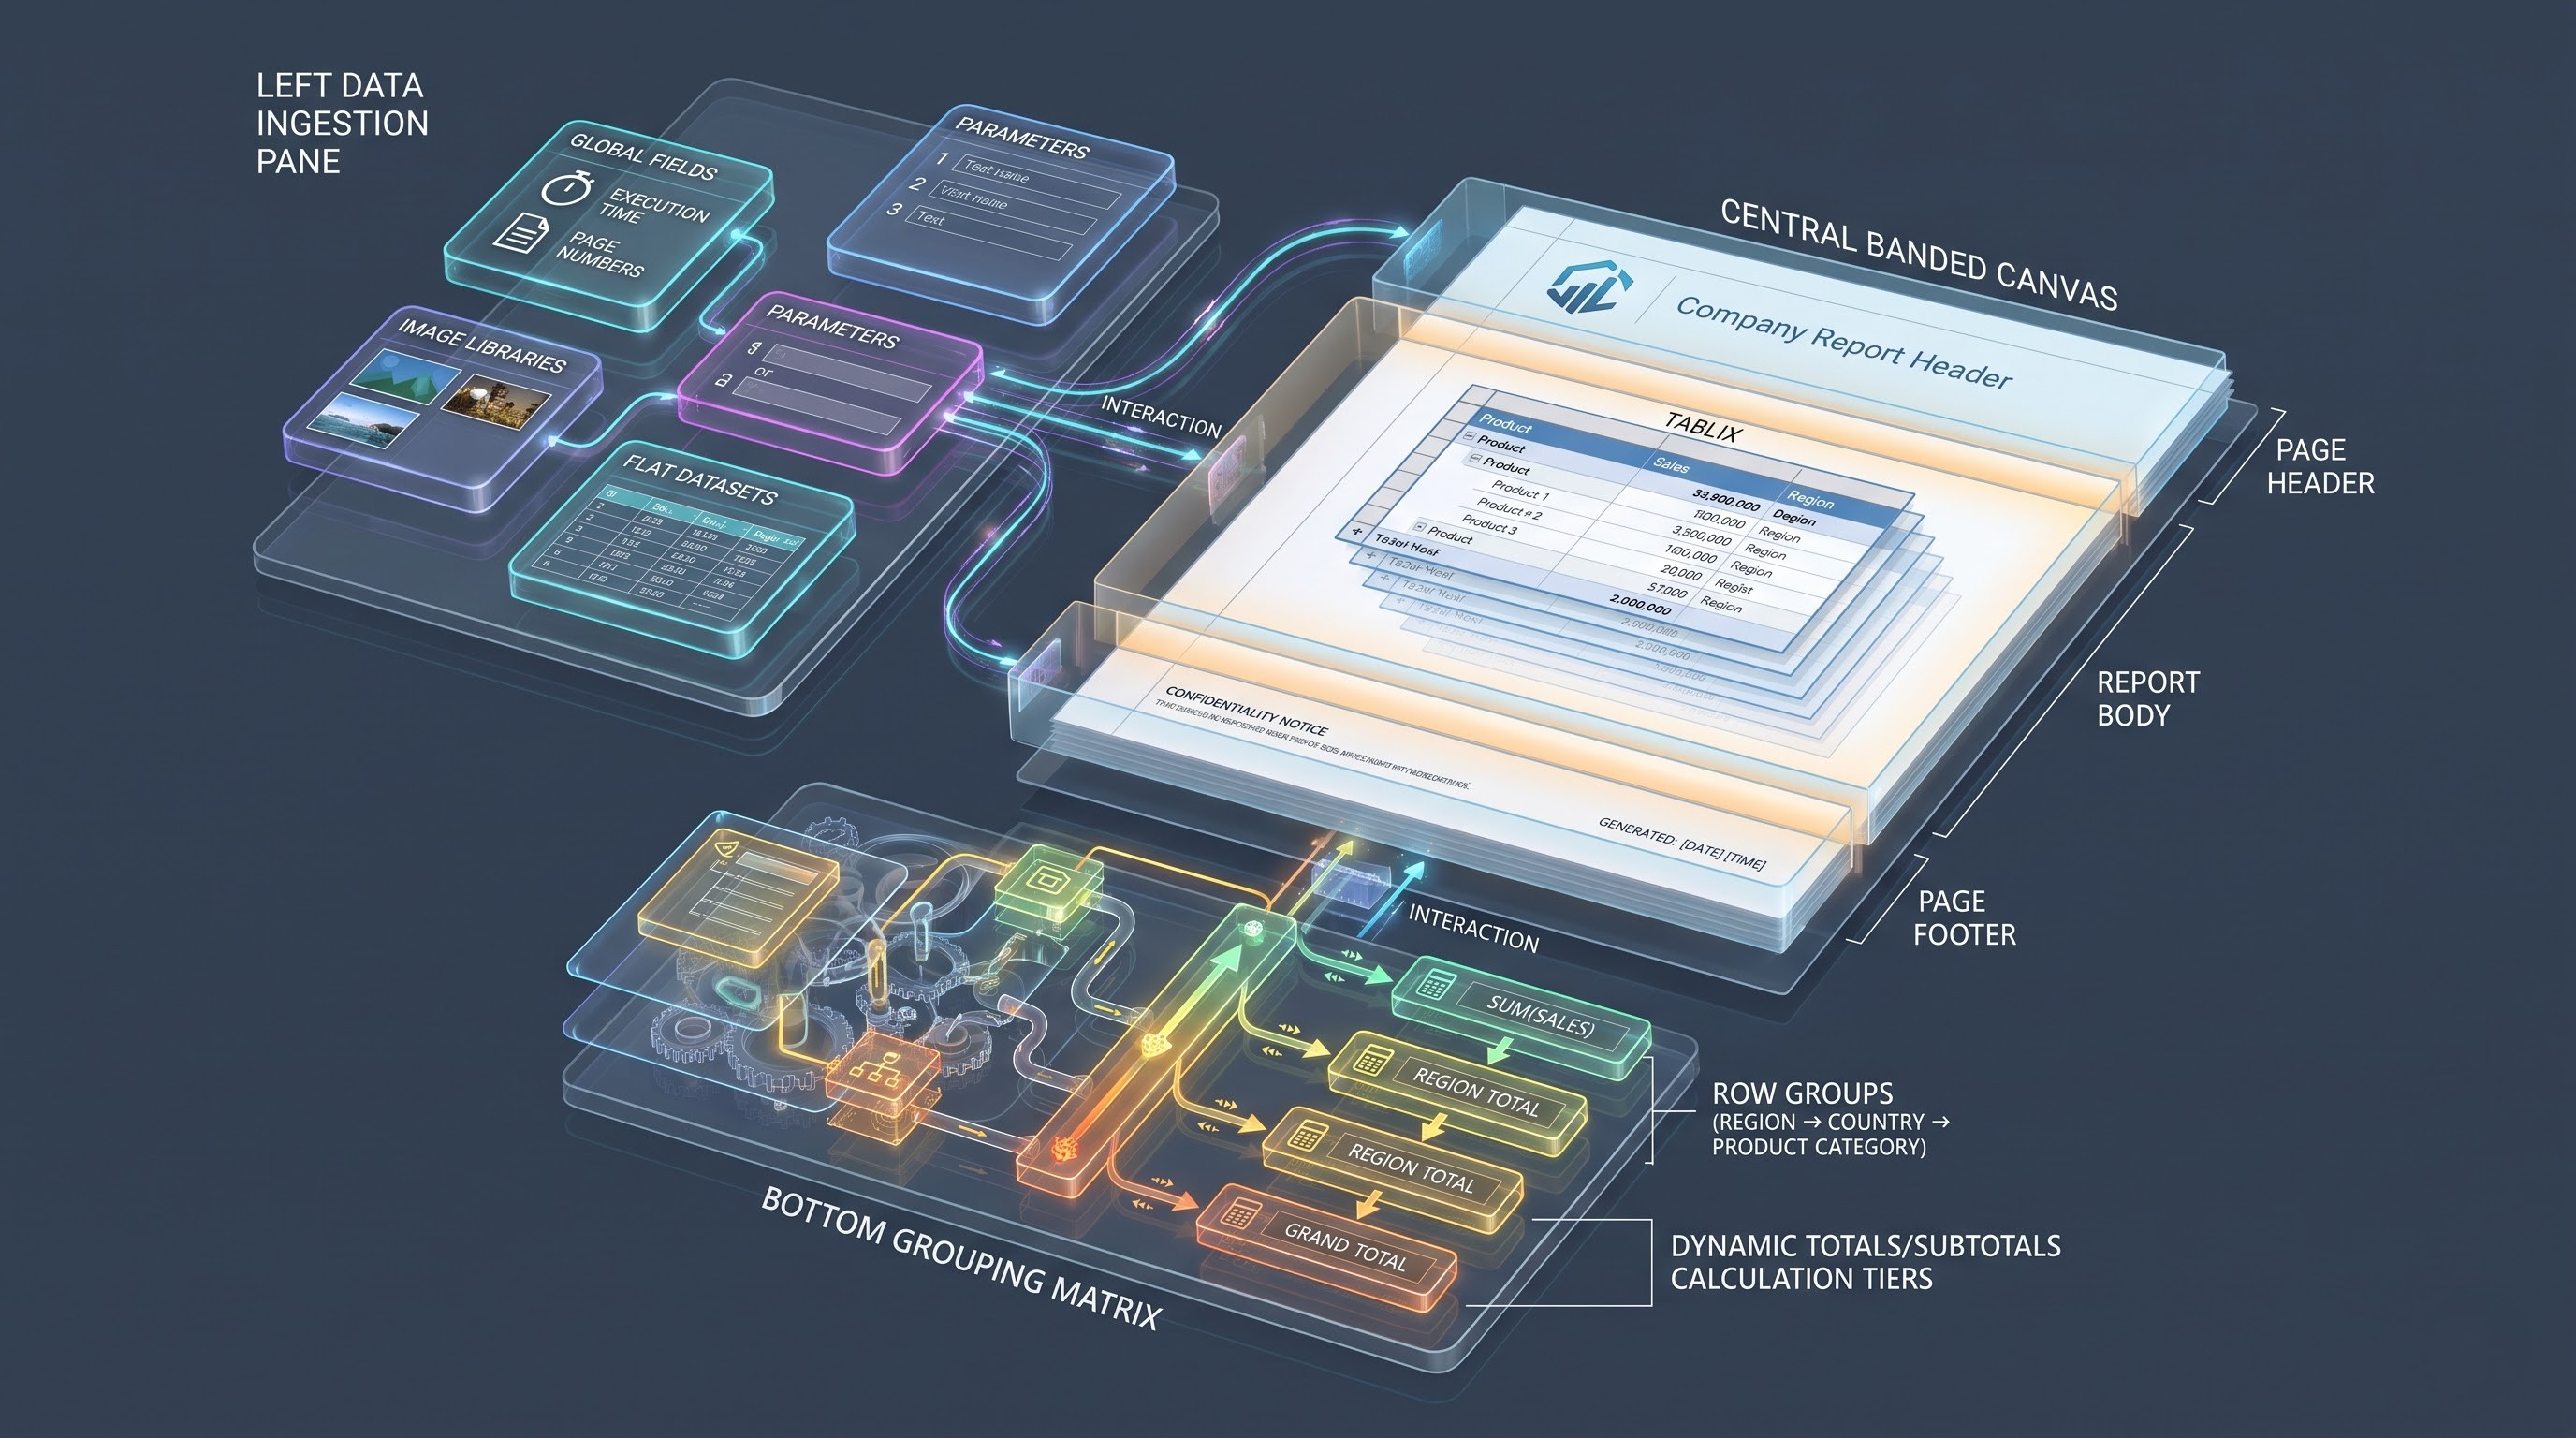
The first thing you may notice when working with Report Builder is the Report Data pane located at the very left side. It contains all datasets used in the report including built-in global fields (execution time, report name, page numbers, and the user’s name), parameters, image libraries, data sources, and individual datasets. Note that, unlike desktop authoring, where all tables are brought together into a relational data model, Report Builder datasets are independent sets of flat relational fields exposed to the author.
The Design Surface and Reporting Bands
The center of Figure 3 represents a page surface. The surface is split into horizontal bands:
Page Header: Executes only once at the top of each physical page. Most suitable for enterprise logos, confidentiality statements, document classifications, and document titles.
Report Body: This is a working space where tables, matrices, and text blocks reside. It is extended downwards while adding records to the database.
Page Footer: Executed at the end of each page, it is intended to place page numbers, timestamps, and legal disclaimers.
The distinction between Report Header and Page Header is that the former is executed once at the beginning of the document, while the latter appears on each page. Report Header is suitable for cover pages or executive summaries, while the Page Header is intended to maintain the context of a lengthy document.
The Grouping Pane
Placed at the bottom end of the workspace, the Grouping pane is a hierarchy designer for any tabular region. It is divided into Row Groups and Column Groups. In these sections, an author defines how source records are aggregated into summary blocks, sets multiple drill-down levels for rows/columns, and specifies page breaks between report sections.
The Properties Grid
While the ribbon menus give access to common operations, the Properties grid located on the right side provides complete and granular control over each element. Every text box, border, group, and region on the canvas has dozens of specific properties ranging from offsets, conditional visibility, and sizing coordinates. Learning paginated reports requires a fundamental comprehension of working with this detailed grid.
Sources, Datasets, and Semantic Models
Data in paginated reports comes in through a two-level hierarchy of Data Sources and Datasets.
A Data Source specifies the connection string and authentication mechanism to the underlying repository. Power BI Report Builder supports a variety of enterprise infrastructure including on-premises relational databases, cloud data warehouses, analysis services cubes, and Power BI semantic models in cloud workspaces. Authentication can be done by enterprise single sign-on, stored credentials, or organization account identities.
A Dataset is the concrete query run against a Data Source, resulting in a flat, tabular result set made up of named fields and their data types. Unlike interactive reports, where DAX relationships are dynamically evaluated across tables in memory at query time, paginated data regions will generally be bound to a single specific dataset.
When connecting to native Power BI semantic models, Report Builder provides graphical and text-based query designers that expose model measures and hierarchies as structured queries. This supports organizations preserving a single version of truth: the same business metrics validated in an enterprise semantic model can simultaneously power executive dashboards and high-volume paginated operational documents, without data modeling duplication.
Working with Data Regions: The Power of Tablix
The Tablix data region is at the heart of most paginated reports. The name is a combination of Table and Matrix, and it has a highly versatile nature.
A standard Table layout has fixed columns and dynamic rows that extend vertically based on the amount of data. A Matrix layout has dynamic rows and columns that extend both vertically and horizontally and act similarly to an enterprise pivot grid. A List data region repeats a free-form canvas container for each record and allows the author to design repeating cards, ID badges, or even full-page form letters. Underneath it all, all three of these visual presentations are the same – a variation of the underlying Tablix architecture.
Understanding Tablix Cell Types
A Tablix contains two main operational areas – the corner and header regions, and the body cell region. Cells within a Tablix can act like static cells or dynamic cells:
Static Cells: Retain their defined text or label regardless of the amount of data. Contain column and row headers.
Dynamic Cells: Evaluate field expressions for every instance of a group or detail row.
The Tablix Grouping Engine
Tablix's ability to group data is a powerful tool. The author can create parent groups, child groups, and adjacent groups. To illustrate with a corporate sales ledger, the author can group the records first by Global Region (parent row group), then by Country (child row group) and next by Product Category (grandchild row group). The author can even add dedicated header rows and footer rows to each group. The group footer is often the location for subtotal calculations, statistical calculations, or running totals. Since the Tablix engine fully understands the concept of grouping at differing levels, the author can show the regional subtotal, the country subtotal, and the grand total in the same vertical layout without resorting to complex nested calculations.
Layout and Typography Discipline
One of the key characteristics of an operational document is the need for layout predictability. An interactive dashboard may rearrange cards on the screen based on the resolution, but an official tax document or medical lab report needs to be precise down to the millimeter.

The Golden Rule of Page Geometry
The physical page always obeys the mathematical equation: page width = left margin + report body width + right margin
If your body width grows by so much as 1 millimeter beyond the available printable space, your rendering engine will generate an unwanted horizontal overflow page. This is easiest to see if you export a ten-page document and discover that every other page is completely blank except for a sliver of an expanded border or text box. Authors avoid this pitfall by specifying explicit paper sizes (the Letter and A4 sizes are examples), using fixed margins, and constraining the report body width to fit inside those margins.
Dynamic Whitespace Consumption
The Power BI Report Builder engine consumes whitespace differently, depending on what rendering engine is being used. If you are previewing the document on the screen, the whitespace may look the same as it does when rendered to a hard page (such as PDF). However, text boxes that have been set to dynamically grow with their text will cause later elements to be pushed down when rendered to a hard page.
To maintain visual structure:
Elements should be aligned by snapping to coordinates and having specific sizes
Text boxes can be made to allow or disallow vertical expansion depending on if the layout will allow for it
Spaces between elements should not be left blank or enclosed in panels so that outputting does not create an unpredictable layout.
The Expression Engine and Custom Business Logic
While Power BI Desktop makes extensive use of DAX and Power Query for calculated transforms, Power BI Report Builder makes use of a Visual Basic expression engine to manage presentation formatting and dynamic business logic.
Expressions in Report Builder begin with an equals sign and offer a level of control over nearly every property of nearly every element. Authors write expressions to concatenate text strings, format numbers, determine background colors and visibility.
Conditional Formatting and Visual Cues
Within large operational ledgers, users require visual guidance in order to distinguish anomalies, overdue balances or inventory shortages. Through expressions, authors are able to associate stylistic properties to corresponding data values. For instance, a given cell background could be prompted to adopt a soft red shade once a ledger account balance is exceeded over permissible credit limits, or keep an invisible fill if otherwise within acceptable limits. Font weights, borders and text alignment may be adjusted conditionally per-row.
Global Scopes and Context
The expression engine exposes a number of built-in collection objects that provide reports with situational context. By referencing global execution variables, authors are able to implement statements that exhibit contextual information such as the current page number out of a total page count, print out the authenticated user ID of the person running the report, or list the precise moment data was retrieved to the needed audit standards.
Custom Code Embedding
For situations where more elaborate logic is required to implement certain enterprise-centric algorithms, Report Builder provides the capability for developers to embed directly custom code functions within the report properties. The custom functions library offers methods that can be used directly from expressions to execute complex calculations, parse structured coded strings or resolve recursive date math, returning the resulting value directly into the design surface, without additional database query overhead.
Since getting to know how to set up custom scopes, nested calculations, and dynamic appearance from the ground up takes more than just trial and error, enrolling in a power bi live training with a professional instructor from OnlineITGuru is a smarter move for coding professionals to troubleshoot enterprise-level logic and reporting models.
Parameters: Filtering and Interactive Document Control

Parameters enable report authors to turn static document templates into self-service, end-user operational utilities. They represent the mechanism by which an end user (or automated scheduling mechanism) may pass in filtering criteria to the report engine ahead of query execution.
Query Parameters Versus Report Parameters
Report Builder makes the distinction between parameters defined at the query level and parameters defined at the report presentation level:
Query Parameters:
Embedded directly within the dataset retrieval query. When a user selects a value, the parameter is pushed down directly to the source database, filtering records at the source. This has implications for performance and ensures that unneeded enterprise records are not passed across the network.
Report Parameters:
Exist within the report definition itself. They can be used to filter data that has already been retrieved into memory, conditionally expose elements, or control which grouping hierarchies are exposed on the canvas.
Cascading Parameters
Enterprise reports often require parameters that are dependent on each other, which means that the list values of the subsequent parameter depend on the value selected in the first parameter. For example, changing the value in the first parameter, the drop-down menu, should affect the values that appear in the second parameter. If the user selects the region, the next parameter should display the countries that belong to this region, and the third parameter will show the sales territories or company stores associated with a particular country.
The Report Builder creates a dependency between the parameters by binding the value lists of the dependent parameters to a separate lookup dataset. After the user selects an option from the drop-down menu, the parameters change because the value of the parameter is used as a query filter in the dataset. This allows you to build a parameter sequence in the report so that the user has a built-in guide when working with parameters: each step is displayed based on the previously selected value.
Multi-Value Parameters and Operational Flex
A parameter can be used to enter a single value, a free-text value, a date range, or a set of values. Parameters can also be used to create parameters that accept multiple values from the user at once. For example, an enterprise report may need to process several dozen branches or product lines at once. Using multi-value parameters, you can collect the necessary set of values for the report from the user and, without changing the report, display the audit data for one of the selected branches or calculate the combined value of all branches.
Mastering Enterprise Reporting with OnlineITGuru
With enterprises combining interactive analytics with regulatory, printable documentation, there is a growing need for competent report authors. If you want to master end-to-end knowledge of data modeling, DAX, and RDL report authoring, enrolling at the best powerbi training online at OnlineITGuru will give you the practical project experience needed to develop enterprise business intelligence solutions.