
QlikView: Why Its Associative Approach to Data Still Matters in Modern Business Intelligence
Last updated on Aug 22, 2026
A business dashboard can tell an organization what happened. The harder part is helping people understand why it happened. A sales report may show that revenue has fallen. A finance dashboard may show that margins have changed. An operations team may see inventory moving more slowly than expected. These numbers are useful, but they rarely answer the next question on their own. Managers usually want to know which products, customers, regions, time periods, or business activities are responsible for the change.
That is the problem QlikView was designed to approach differently. QlikView became known for its associative model, which allows users to explore relationships between data rather than being limited to a fixed sequence of reports or predefined drill-down paths. Qlik describes QlikView as its first-generation analytics platform and explains that its associative engine allows users to make selections and explore connected information throughout an application.
The idea is simple, but its implications are much broader than a dashboard.
QlikView is less interesting for the charts it puts on a screen than for the way its underlying data model allows people to investigate a business question.
That distinction is worth understanding, particularly for developers and organizations that still work with established QlikView applications. The analytics industry has changed significantly since QlikView became widely adopted. Cloud platforms, self-service analytics, automation, and AI-supported tools have changed the way organizations approach business intelligence. Qlik itself has moved much of its modern product direction toward Qlik Sense and Qlik Cloud.
Yet QlikView remains present in enterprise environments because technology rarely changes simply because a newer product appears. Existing applications contain business logic, data models, integrations, reporting processes, and years of organizational knowledge. To understand why QlikView still matters, it is more useful to look at the problem it solves and the engineering decisions underneath the dashboard than to treat it as just another visualization product.
Why QlikView Was Built Around a Different BI Problem
Traditional reporting tends to begin with a known question. A company may create a report for monthly revenue, another for regional performance, and another for customer sales. Each report has a defined structure and gives users a particular view of the information. This works well when the business question is stable and clearly defined. Real business analysis is rarely that predictable. A manager may notice that sales are down in one region and immediately want to know which products are responsible. After identifying those products, the next question may concern customer segments. That may lead to an investigation of discounts, sales representatives, order dates, or inventory levels. The direction of the analysis changes as the user discovers new information.
This is where the associative concept becomes important. Instead of creating a separate report for every possible question, QlikView allows users to make selections and continue exploring related information within the same analytical environment. The associations between fields determine how information responds to those selections.
For example, selecting a particular region can affect the products, customers, salespeople, and transactions associated with that region. Selecting a product can narrow the same analytical environment again.
The user can continue investigating without needing a developer to create a new report for every combination. The important shift is from simply reading a report to exploring the data behind the report. That is why QlikView's design has always depended heavily on the structure of the underlying data. The associative experience does not exist independently of the data model. The relationships created during development determine what users can discover later. This makes QlikView development fundamentally different from simply placing charts onto a blank dashboard.
A developer is designing the environment in which analytical questions will be asked.
What Happens Behind a QlikView Dashboard?
The interface is the part of QlikView that users see, but it represents only the final layer of a much larger process. Before a user can select a product or region, information has to be loaded into the application. QlikView's scripting environment can connect to different data sources, load records, transform fields, create calculations, rename columns, and prepare data for analysis. The visible dashboard is therefore the end result of a much larger data preparation process happening underneath it.
That work can involve databases, spreadsheets, files, and other sources. The objective is not simply to collect as much information as possible; it is to create a structure that supports the questions the business needs to answer. Consider a company with separate systems for customers, products, orders, employees, and inventory. Each system may have been created independently. One database might identify a customer using Customer_ID, another might use a different field name, while a spreadsheet may contain customer names without a consistent identifier.
The developer has to understand these differences before building the analytical application. Data may need to be cleaned, transformed, renamed, or combined. Dates may need to be standardized, unnecessary fields may need to be removed, and business definitions may need to be translated into calculations. This is where the load script becomes important because it provides the foundation for turning information from different operational systems into a structure that can be explored consistently.
For someone moving from basic dashboard creation into development, qlikview developer training can help organize these concepts into a practical learning path. The useful part of such training is not simply learning how to create visual objects, but understanding how data loading, scripting, transformations, and modeling work together. That foundation becomes particularly important when an application depends on several sources that were never designed to work together.
The script is not simply a technical step before dashboard design. It can determine how raw operational data becomes an analytical dataset. A business user may only see a single revenue chart, but behind that chart could be a series of transformations that determine which transactions are included, how revenue is calculated, and how that information connects to customers, products, regions, and time.
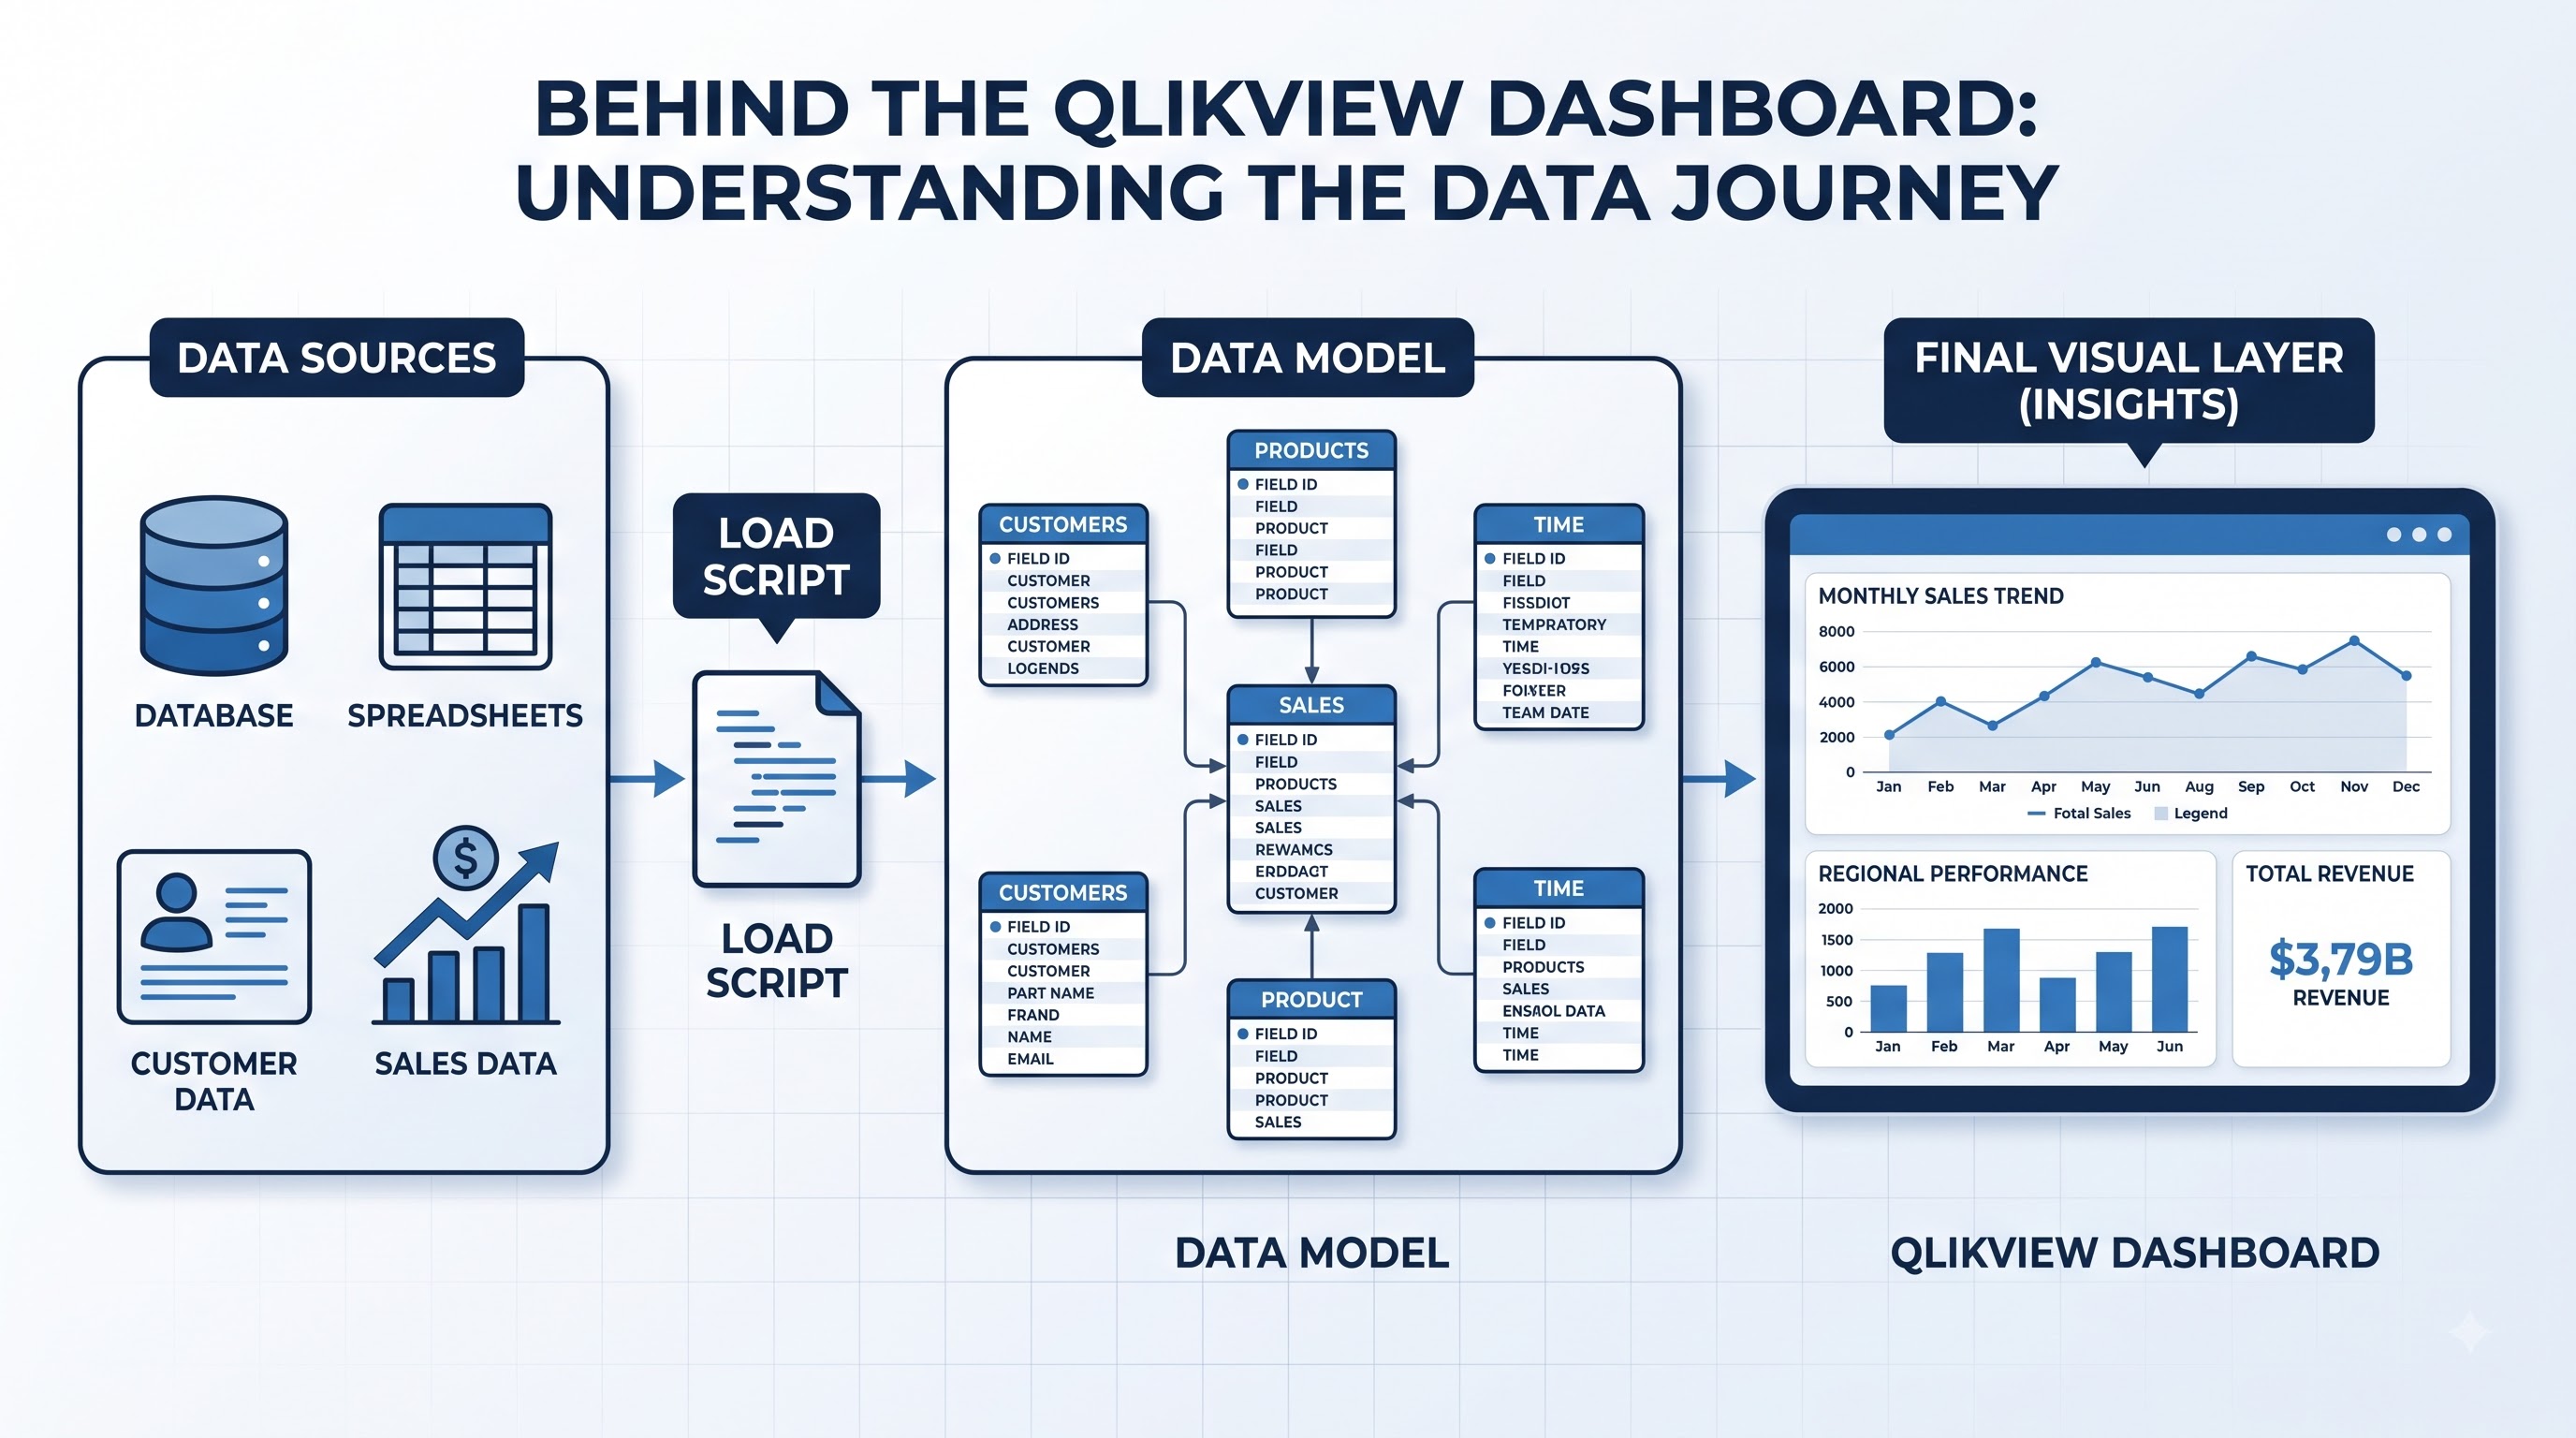
The quality of the visible dashboard depends heavily on decisions made before the dashboard is ever opened.
This is also why QlikView development requires a strong understanding of data rather than only knowledge of visual objects. A developer who understands charts but does not understand the source data can create something that looks convincing without necessarily producing a reliable analytical result. Good development begins with understanding where the data comes from, how it should be connected, and what the business expects that data to explain.
Why the Data Model Determines What Users Can Discover
The data model is arguably one of the most important parts of a QlikView application. When tables are loaded, QlikView creates associations through common fields. Those relationships allow selections made by users to move through connected information. If the relationships are sensible, the application can provide a natural analytical experience. If they are poorly designed, the same associative behavior can produce confusing or incorrect results.
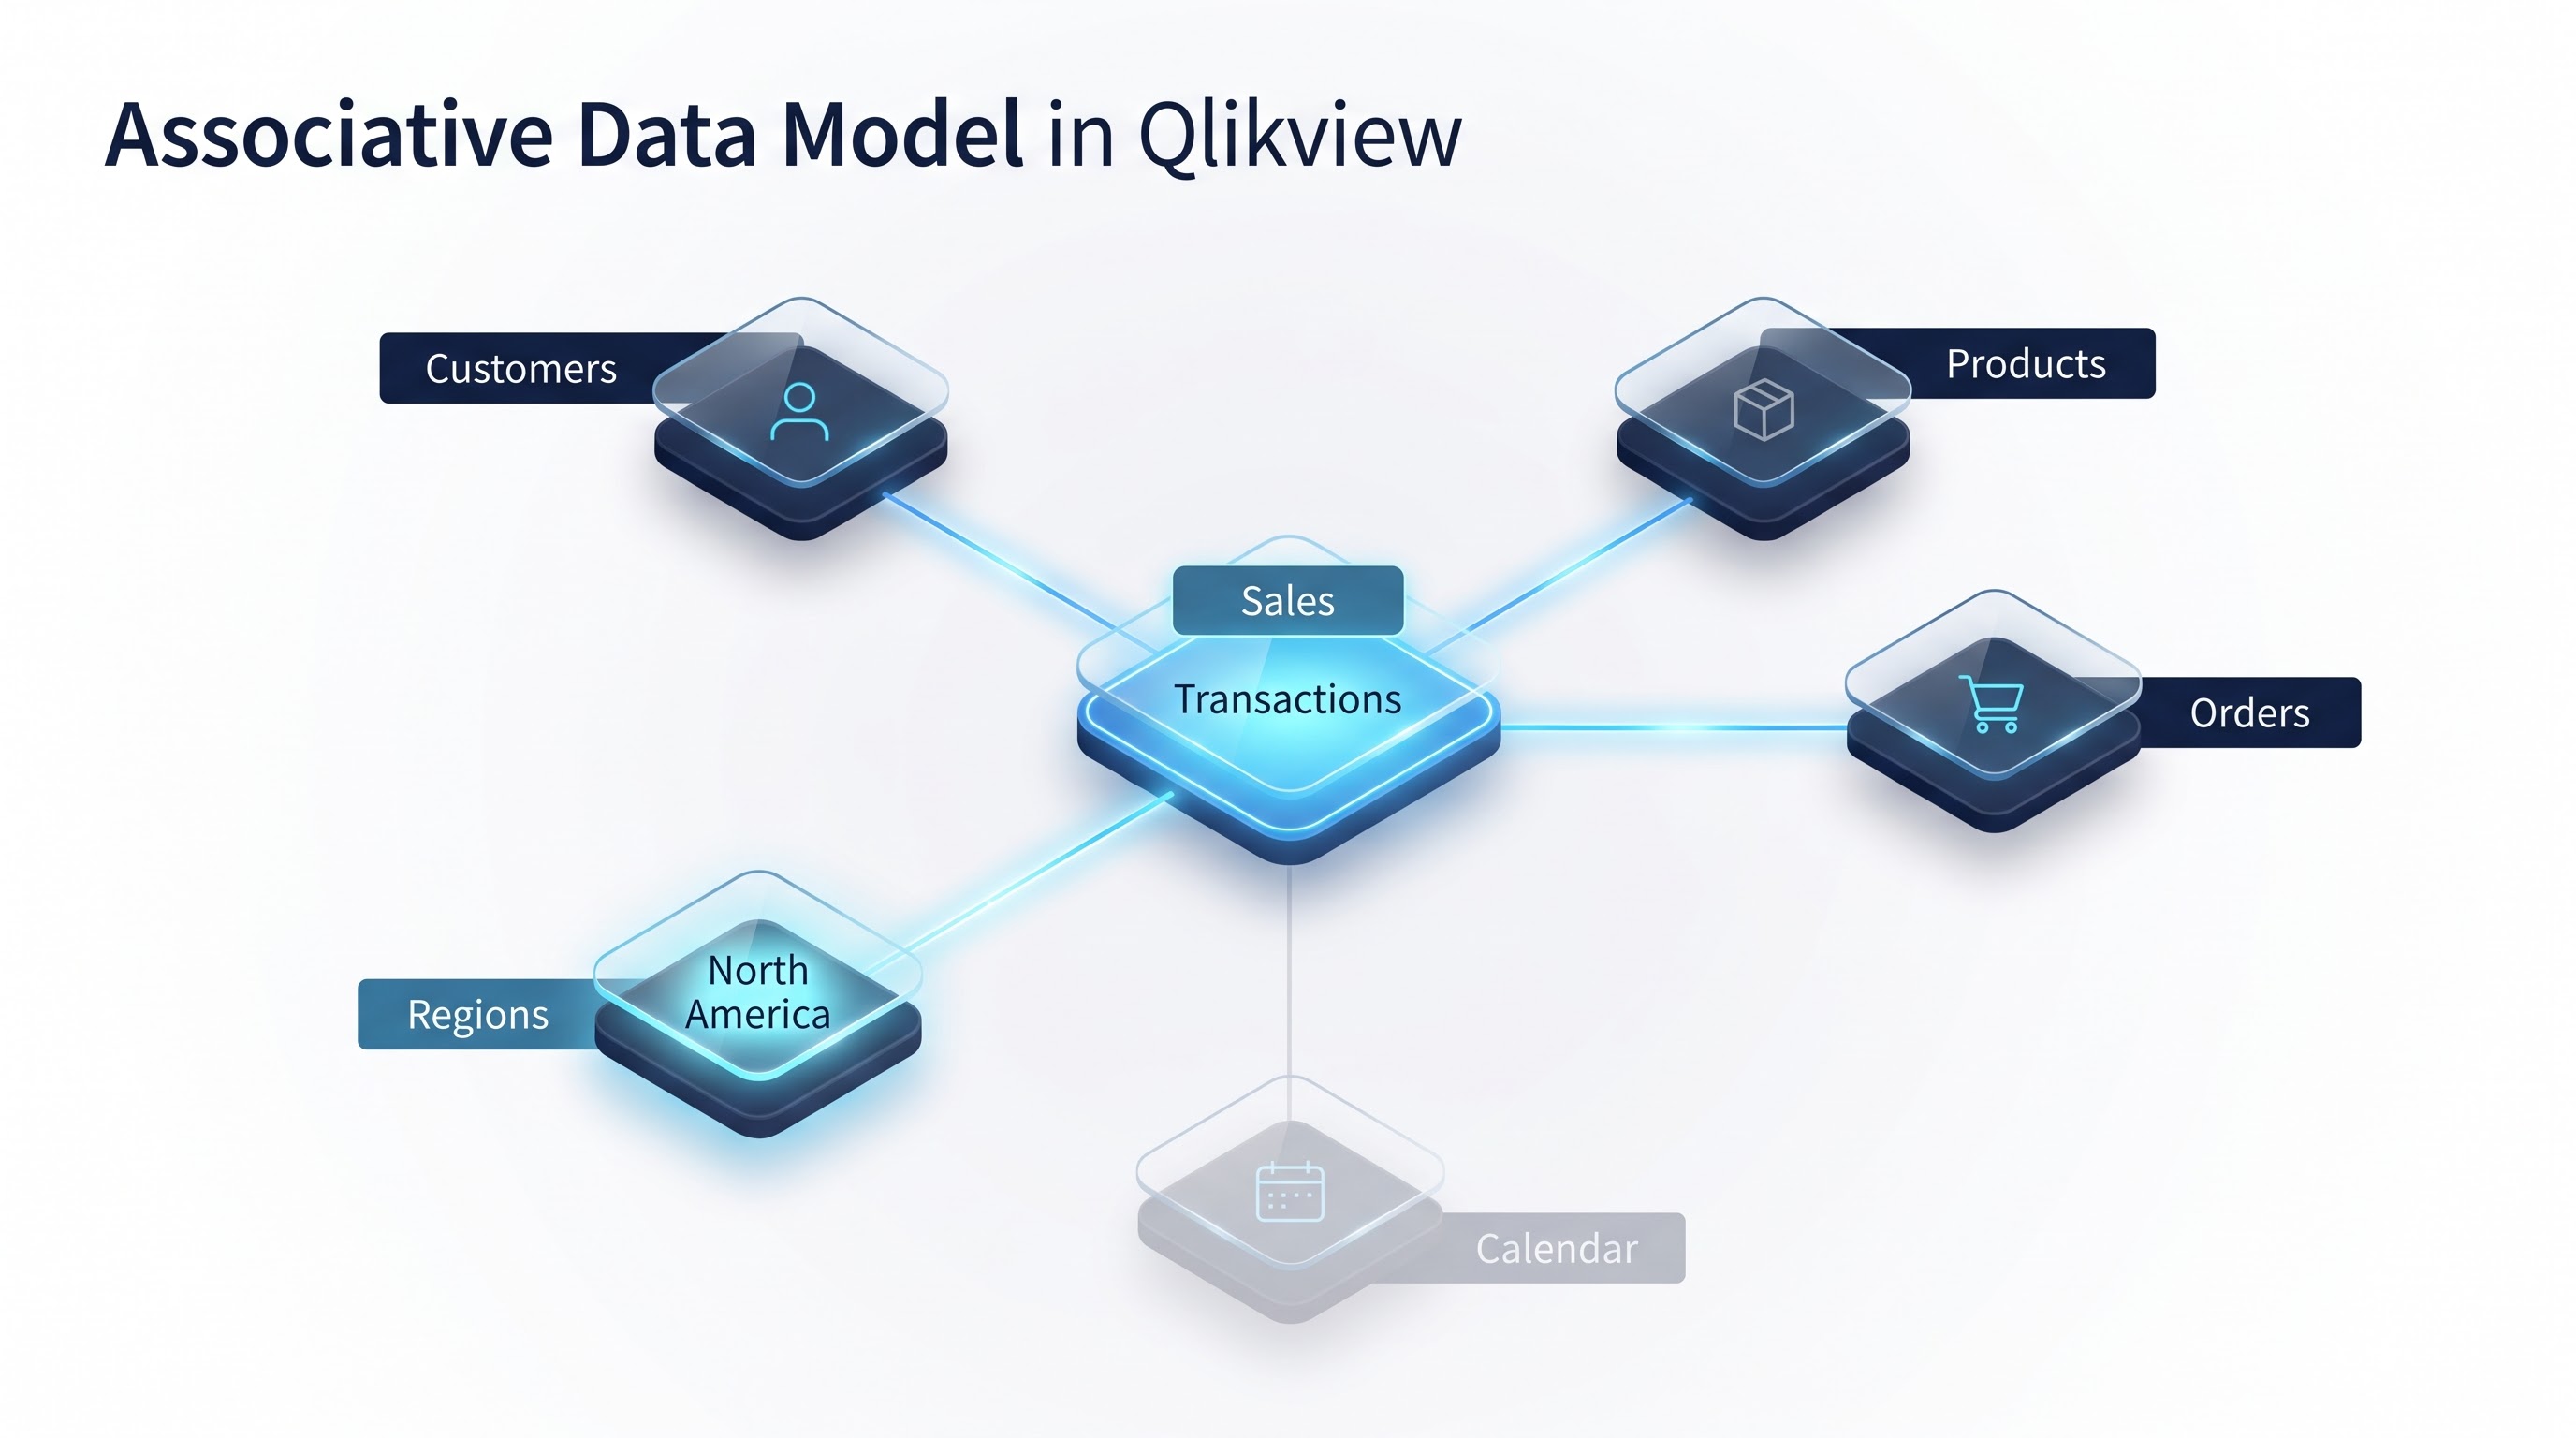
A simple sales environment with three major tables.
The orders table contains transaction information.
The customer table contains customer details.
The product table contains product information.
The order table may contain CustomerID and ProductID, creating relationships with the customer and product tables. A calendar can then connect transactions to dates.
This structure allows a user to move from sales to customers, products, regions, and time. But real enterprise datasets are rarely this clean. A developer may encounter multiple tables containing the same fields, duplicate keys, unexpected relationships, or tables that share several common fields. If these relationships are not carefully managed, QlikView can create synthetic keys or other unintended associations. Circular references can also make the model difficult to understand and maintain.
Qlik's own development guidance recommends careful data modeling and emphasizes avoiding problematic structures such as circular references. It also discusses the importance of managing transformations and keeping the model appropriate for the application's analytical requirements. This is where the difference between a beginner and an experienced developer becomes visible.
A beginner may ask, "Why isn't this chart showing the number I expected?" An experienced developer may first ask, "What relationship in the data model is causing that result? "That is a much more useful question. The application may not have a visualization problem at all. The problem may be in the model underneath it.
In QlikView, the data model is part of the analytical experience.
It determines how users move through the information, which selections affect other objects, and whether the results make sense in the context of the business.This is why data modeling deserves more attention than it sometimes receives in discussions about business intelligence tools.
From Business Question to Working QlikView Application
A professional QlikView application usually begins long before development starts. The first step is understanding what the business actually wants to learn from the data. Suppose an organization asks for a sales performance dashboard. On the surface, the requirement sounds simple, but the developer needs to clarify what "sales performance" actually means. Is the organization measuring revenue, units sold, gross margin, or a combination of several metrics? Should cancelled orders and returns be included? Which date should determine the sale, and what period should be used for comparison?
These questions are not merely business details. They directly influence the technical design of the application. A different definition of revenue can change the data required, the transformation logic, the calculations, and even the structure of the final dashboard. This is why jumping directly into visualization can create problems later. The developer first needs to understand the decision the application is expected to support.
Once the requirement is clear, the next stage is examining the available data sources and deciding which information is actually relevant. A sales application might need customer, product, transaction, regional, and calendar information, but loading everything available is rarely the right approach. The developer has to determine how these sources relate to one another, what transformations are required, and how the resulting data should be structured before users begin exploring it.
This is also where a structured qlikview course online can be useful for someone learning the development process. A good course should not focus only on creating charts; it should show how requirements are translated into data loading, scripting, modeling, expressions, and application design. The important part is learning how each technical decision connects back to the business question rather than treating every QlikView feature as an isolated function.
Once the data model is stable, the developer can build expressions and visualizations around it. The application then needs to be tested against known business results. If the dashboard shows a revenue figure that differs from the organization's trusted report, the developer has to investigate the source rather than simply changing the number until it looks correct. The difference could come from the source data, transformation logic, business definition, expression, date handling, or an unexpected relationship in the model.
Development is therefore rarely a straight line. A user may discover that an important dimension is missing during testing, a business rule may change, or a source system may introduce a new field. A calculation that performs well with a small dataset may also need to be reconsidered as the volume of information grows. A reliable QlikView application develops alongside the business understanding behind it. This is why strong QlikView development requires communication as well as technical ability. The developer needs to understand what users are asking, challenge unclear requirements when necessary, and then translate those requirements into a data structure and analytical experience that can support real decisions.
A successful application is not produced by writing the script first and asking questions later. It is built by translating business questions into data, logic, and an interface that users can trust.
What Makes a QlikView Application Reliable at Enterprise Scale?
A QlikView application that works on a developer's computer is not necessarily ready for an organization. Enterprise use introduces a different set of concerns. The application needs reliable data reloads. It needs appropriate performance. Users need controlled access. Applications may need to be distributed across an environment. Administrators need to understand what happens when a reload fails or a data source becomes unavailable. Performance is particularly important because problems can begin long before a user complains about a slow dashboard.
Loading unnecessary fields increases the amount of information the application needs to handle. Poor data relationships can make the model more complicated. Repeated calculations can create unnecessary processing. Inefficient reload logic can make data preparation take longer than expected. Qlik's guidance on data modeling notes that appropriate transformations performed during the load process can offer performance advantages compared with relying too heavily on calculations at the visualization level.
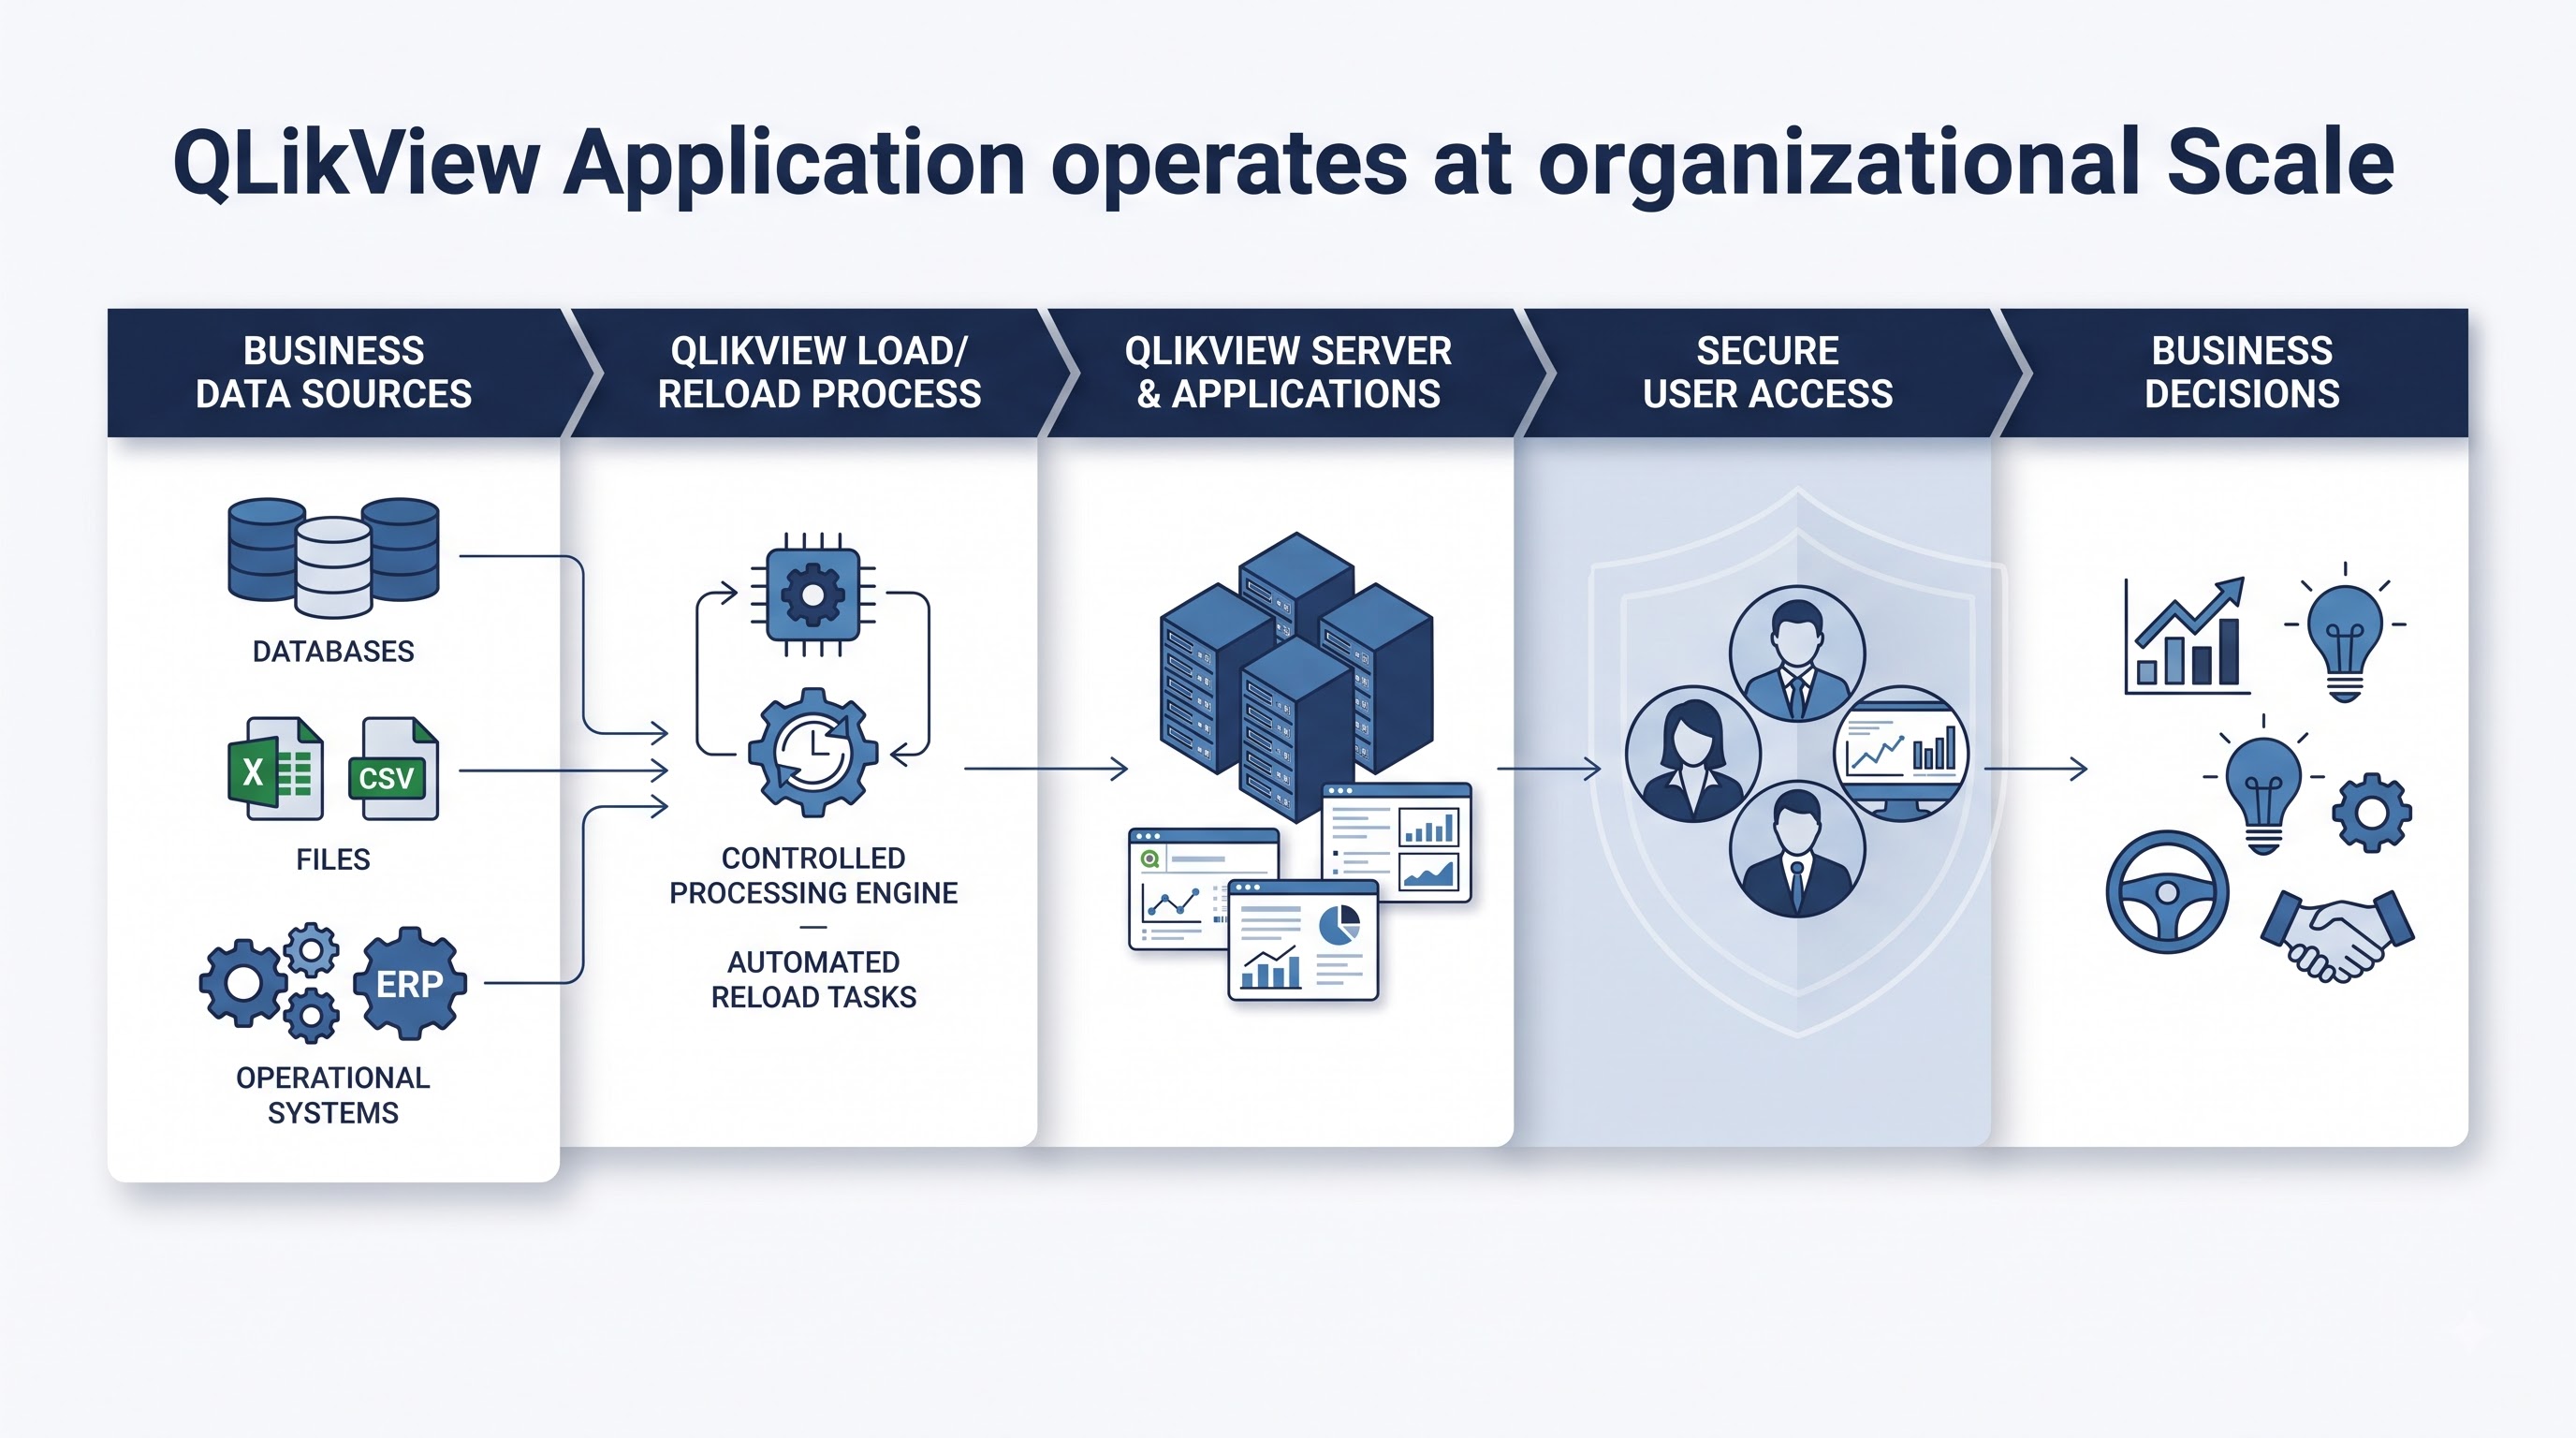
The important point is not that one technique is always better. It is that developers need to understand where processing should happen. A transformation that is required once during a reload may not need to be repeated every time a user interacts with a chart. On the other hand, a calculation that depends on user selections may need to remain dynamic. These decisions become more important as the amount of data grows. Then there is the reload process itself. A dashboard is only useful if its information is current enough for the business purpose. If a sales application is expected to refresh every morning, the reload needs to complete successfully and produce the expected results.
A failed reload may not always be obvious from the interface.
The dashboard could still open.
The charts could still appear.
The numbers could simply be outdated.
That makes monitoring and validation important parts of an enterprise BI environment.
Security is another consideration. Financial, customer, employee, or regional information may need to be restricted to specific users. Access controls therefore need to be considered alongside the application architecture rather than added as an afterthought. QlikView Server provides infrastructure for publishing and managing QlikView applications, with components involved in application management, reload and distribution processes, authentication, and related server functions.
Enterprise BI is not just about building an application. It is about keeping that application accurate, available, secure, and useful after real people start depending on it. That is the point where QlikView development becomes an operational responsibility rather than a dashboard project.
Learning QlikView Is About More Than Learning the Tool
The easiest way to start learning QlikView is to open the interface and begin creating objects. The harder—and more useful—path is to understand what is happening underneath those objects. A learner needs to become comfortable with data loading, scripting, associations, data modeling, expressions, set analysis, visualization, debugging, performance, and application design. Qlik's documentation covers these areas extensively, which reflects an important point: becoming capable with QlikView requires understanding both the application interface and the data architecture behind it.
A structured learning path can make that process easier, particularly for someone who is new to business intelligence development. Instead of jumping between unrelated tutorials, learners can move from data loading and scripting into modeling, expressions, application design, and performance. The objective should be to understand why the application behaves the way it does, rather than simply learning where each feature is located.
A practical project can make that learning much more meaningful. A learner might start with a small sales dataset containing customers, products, orders, dates, and regions. From there, they can build the data model, create associations, develop expressions, and investigate questions such as why revenue changed between two periods. Once the basic application works, deliberately introducing problems—such as duplicated keys, unexpected associations, or larger datasets—creates opportunities to understand how QlikView behaves under different conditions.
Certification can provide another way to validate that knowledge. Qlik has offered certifications covering areas such as QlikView data architecture, including subjects related to application development, data modeling, and scripting. For professionals considering qlik training and certification, practical project work should remain part of the preparation. A certification can demonstrate knowledge of specific concepts, while project experience shows whether those concepts can be applied when the data is imperfect and the requirements are less predictable.
Online resources can support this process, but they work best when learners actively reproduce what they are studying. Watching someone build an application is very different from building one independently, discovering an unexpected result, tracing the problem back to the data model, and correcting it. That process creates a much stronger understanding of the platform than simply completing lessons.
Learn the concept, build it, break it, investigate the problem, and fix it. That cycle turns technical knowledge into practical ability. The objective is not to remember every QlikView feature. It is to become confident enough to take a business requirement, understand the data behind it, and build an analytical application that produces results users can trust. It is to become comfortable enough with data and the platform to investigate why an application behaves the way it does.
Where QlikView Fits in the Modern Analytics Landscape
Any discussion of QlikView today needs to acknowledge how the Qlik ecosystem has changed. Qlik's documentation describes QlikView as its first-generation analytics platform and Qlik Sense as its modern analytics platform. Both are built around Qlik's associative technology, but their product approaches and intended experiences are different. QlikView has traditionally been associated with guided analytics and applications designed around structured developer-led experiences, while Qlik Sense places greater emphasis on self-service analytics, modern user experiences, and broader deployment options. Qlik Cloud also plays an important role in Qlik's current platform direction.
That does not mean organizations can simply move from one platform to another without considering what already exists. An established QlikView environment may contain years of business logic, data models, scripts, integrations, and reporting processes. Applications may support different departments, while users may have built important daily workflows around the information they provide. For many organizations, the challenge is not simply choosing a newer platform; it is understanding what the existing environment already does well and what needs to change.
Migration therefore requires a clear understanding of the applications already in use. Qlik provides guidance for organizations moving from QlikView to Qlik Sense, including approaches for assessing existing applications and determining which assets or development patterns may be reusable. This reflects a broader reality in enterprise technology: modernization usually begins with understanding the system that is already supporting the business rather than replacing it without examining its dependencies.
For professionals, this creates two related areas of knowledge. Someone supporting an established QlikView environment needs to understand its scripting, data model, applications, and deployment architecture. Someone preparing to work with newer Qlik deployments should also become familiar with Qlik Sense and Qlik Cloud. This is where qlikview online training can be useful when it is approached as part of a broader learning path rather than as a way to learn only one product in isolation.
The more important point is that many of the underlying skills remain transferable. Data modeling, data quality, business requirements, security, performance, and the ability to translate a business question into a useful analytical model do not disappear when the technology changes. A professional who understands these fundamentals can adapt more easily when an organization moves from one analytics platform to another.
Tools change faster than the principles behind good analytics.
That is perhaps the most useful way to think about QlikView in 2026. It is not necessary to present QlikView as the newest analytics platform, but it is equally misleading to dismiss it simply because newer Qlik products exist. Organizations with established QlikView applications may continue to depend on them, while developers who understand the platform can gain valuable experience with scripting, data modeling, associative analysis, and enterprise BI.
For someone building a longer-term career in analytics, the strongest approach is therefore not to become attached to one product. Understand the technology, but build your expertise around the problems that analytics is meant to solve. That knowledge can remain valuable even when the tools used to apply it change.
The Real Value of QlikView
QlikView's lasting importance comes from a simple idea: business users should be able to explore connected information rather than receive only a fixed report.That idea explains why its data model matters so much. The charts are useful, but they are not the foundation. The foundation is the information underneath them, the relationships between that information, the logic used to transform it, and the way users can investigate those relationships. A developer who understands this can approach QlikView differently.
Instead of beginning with a visual, they begin with a question.
Instead of loading every available field, they think about what the business actually needs.
Instead of treating a strange result as a chart problem, they investigate the data model.
Instead of measuring success by how attractive the dashboard looks, they ask whether the application helps someone understand a real business situation.
That mindset remains useful even when the technology changes. QlikView may represent an earlier generation of Qlik's analytics platform, but many of the problems it forces developers to think about are still central to modern business intelligence. Good analytics begins with trustworthy data, sensible relationships, clear business questions, and an application designed around how people actually make decisions. That is ultimately what makes QlikView worth understanding—not simply as a legacy BI tool, but as an example of how data architecture, application development, and business analysis come together to create something more useful than a collection of charts.