
Salesforce Developer Console Features and Applications
Last updated on Nov 14, 2026
The Salesforce Developer Console Getting Started
The Salesforce Developer Console is an Integrated Development Environment (IDE) based on the web for admins, developers and technical architects working within the Salesforce ecosystem. It is available from a normal web browser, without needing to install any external software or complex plugin configuration and serves as instant tool to build, debug, test and troubleshoot enterprise applications. The Developer Console is a handy tool but most enterprise level development pipelines are done in sophisticated desktop environments and local source code editors. As a native to the Salesforce org, technical teams can query the database structure, run short test scripts, interact with live metadata and look at transaction logs in real time. Knowledge of the advantages and practical use of it helps them become more efficient and solve architectural issues properly. People who want to learn about this professional approach can enroll in a salesforce developer online course program and get acquainted with tools like Developer Console, Apex, and LWC.
Core Purpose, Ecosystem and Evolution
To fully understand the purpose and functionality of the Developer Console, we need to take a step back and explore its origins and its role in the evolution of the Salesforce platform. The developers began by building cloud applications on Force.com using simple page layouts, basic custom controllers and early versions of integrated web tools to build customisations.
"Enterprise applications got more complicated and there was a need for a single low-friction environment. Salesforce created the Developer Console to bridge the gap between the heavyweight enterprise deployment tools and the quick browser-based admin changes.
The Developer Console is natively synchronised with the target Salesforce instance, unlike local IDEs that require complex authentication tokens, project folder configurations and manual sync routines. Any changes you make in the console are immediately mirrored in the organization’s server-side metadata registry. This direct connection is great for rapid prototyping, proof-of-concept testing, and immediate administrative intervention when unexpected runtime conditions arise in production or sandbox environments.
Developer Console Important Architectural Features
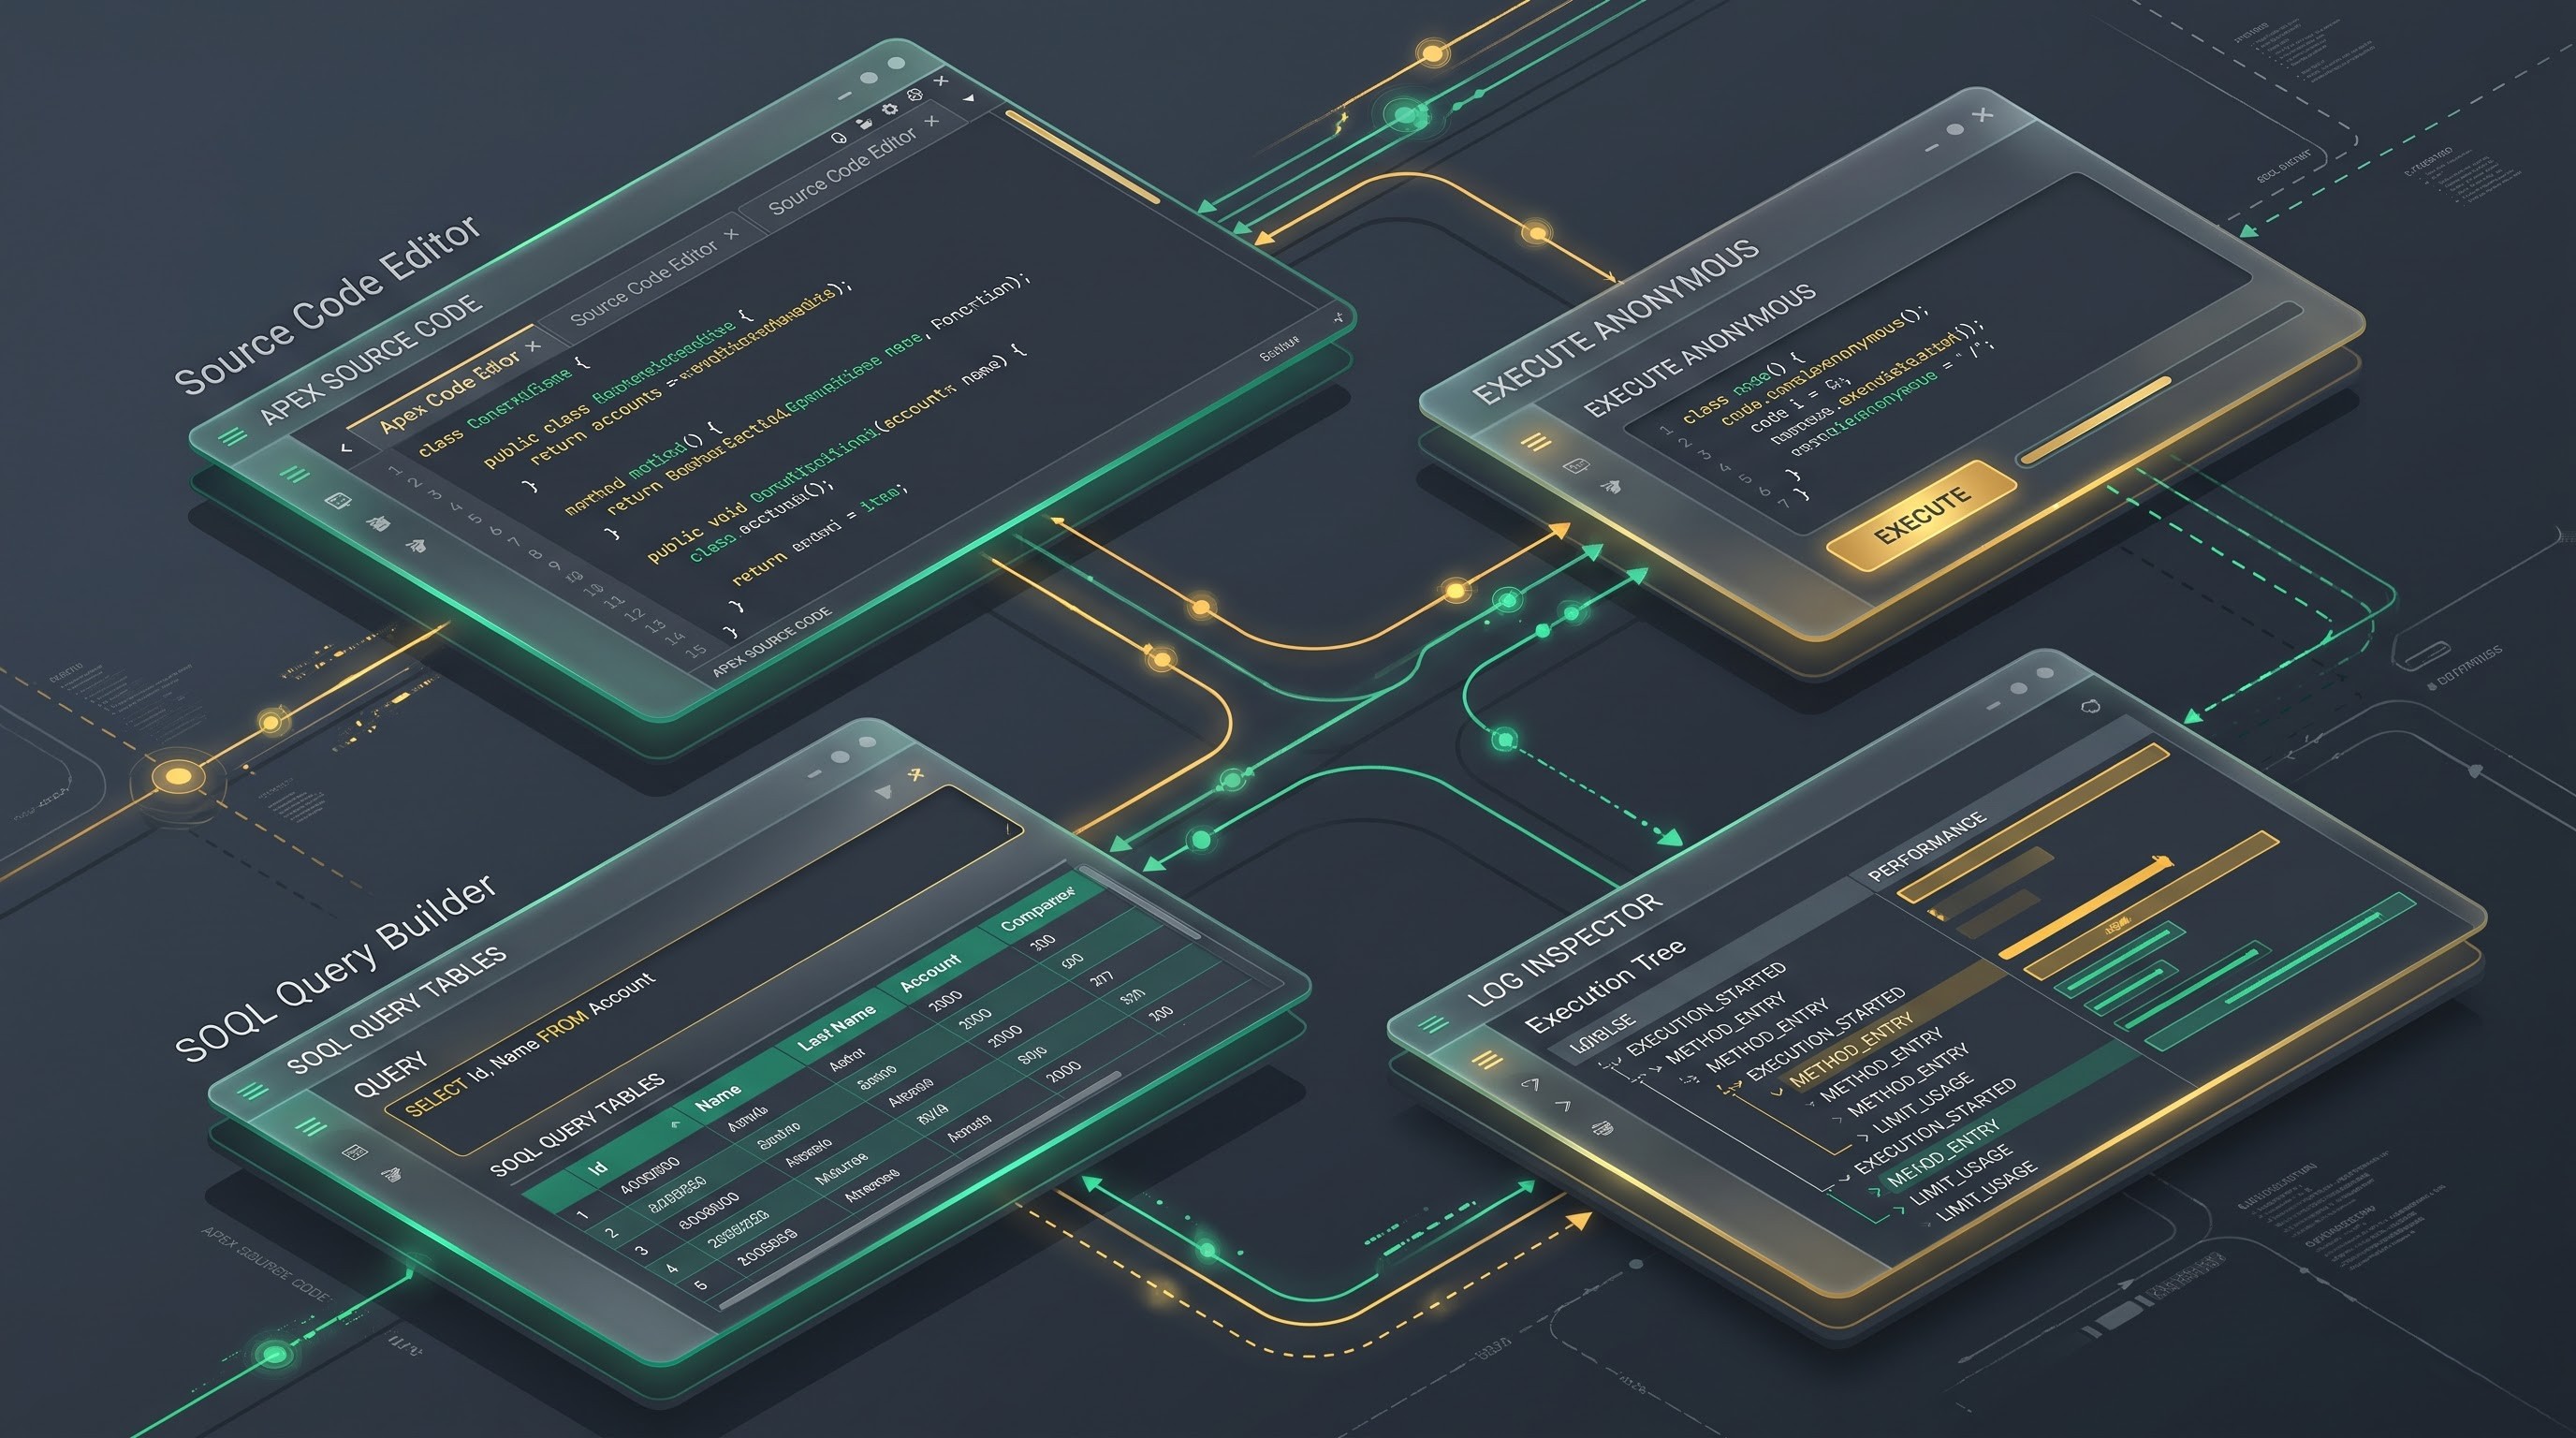
The Developer Console is a complete set of development tools, all within one browser interface. From quickly changing a component to deeply analysing the execution, every feature is designed for a specific operational need in the software development lifecycle.
Editing and Preserving the Source Code
The Developer Console is basically a source code editor with several tabs. The tool has native support for many Salesforce languages and metadata types, allowing users to open, edit, and save Apex classes, Apex triggers, Visualforce pages, Visualforce components and Aura definitions directly back to the server. The editor provides basic help features, including basic syntax highlighting, automatic indentation support, and context sensitive code completion proposals triggered by keyboard shortcuts. It doesn't have the smart refactoring suites, distributed version control tracking and offline capabilities of modern IDEs but it's close to the live server metadata making it very fast for hotfixing, inspecting server-side file structures and making small programmatic changes.
You also get instant feedback from the code editor about compiling it. Saving a file that alters an Apex class or trigger causes the Salesforce server to compile the code immediately. Syntax errors, missing variable declarations or type mismatch are immediately shown in an error panel at the bottom of the interface. That instant feedback loop gives developers the ability to iterate quickly, without building deployment packages or waiting on long enterprise build queues.
Anonymous Execution Context
One of the most used features in the console is the Execute Anonymous window. Apex code in the Salesforce platform architecture is typically found within compiled classes or within triggers that fire on database events, user actions or scheduled jobs. However, developers often need to execute code snippets on the fly, be it to test a custom utility method, instantiate a class from a framework, or run an ad-hoc data migration script.
The Execute Anonymous tool allows users to write and run any block of Apex code, immediately, in the security context of the current user. The environment automatically captures execution output, system debug statements and runtime exceptions and is an indispensable utility for verifying data transformations or testing isolated logic blocks prior to their embedding into larger framework components. Developers often use this environment to test helper methods, manually invoke batch jobs or simulate a user with certain permissions by changing the running context.
SOQL & SOSL Query Builder Native
To interact with the Salesforce database you need to know the following languages well enough: Salesforce Object Query Language (SOQL) Salesforce Object Search Language (SoSL) To help you work with the database, the Developer Console has a Query Editor tab. The user can type in their own query, run it against the underlying organization data model and see the resulting records displayed in a structured tabular grid.
The query editor helps developers and administrators with tooltips, aggregate functions and relationship queries. Technical staff can explore complex data relationships, check the API names of fields, and review live record values on the fly, without building custom reports or creating temporary list views. Individual record identifiers can also be copied directly by users or results of a query can be exported via the interface, speeding up data seeding and relationship mapping during development tasks.
Enhanced Debugging Tools and Log Inspector
Runtime errors are notoriously hard to track down in enterprise applications because they tend to be the result of complex interactions between Apex triggers, asynchronous processing jobs, flows and validation rules. It’s a bit complicated, but the Developer Console’s Logs tab and Log Inspector are very powerful. The console registers all transactions within the organization. It implements a detailed transaction system log, registering them in real time.
When you open a log file, the Log Inspector opens a multi-pane execution viewer with special analysis panels that analyse the transaction behaviour:
Execution Summary : Displays the total execution time, the number of database queries, governor limit usage statistics and CPU time usage.
Execution Tree: A tree of method calls, trigger executions and rule evaluations that follows the transaction path from start to finish.
Stack Tree Sort methods by execution time to find performance bottlenecks and inefficient recursive loops.
Timeline: When viewing the entire transaction, it shows a graphical timeline of the duration of database operations, trigger cycles, and workflow evaluations.
The console also supports checkpoints, which allows developers to inspect the state of heaps, variable values and object instances at specific lines of execution without littering the codebase with too many debug statements.
Use Cases & Real World Use Cases
The real power of the Salesforce Developer Console is realised when you see technical users using its features to solve common engineering and administration problems in a variety of business environments.
Fast Production Diagnostics and Troubleshooting
When you find unexpected errors in your production environment or managed sandbox, you need to quickly identify what’s causing them so you can keep your business moving. The Developer Console is built into the browser and connects directly to the org. Developers are able to change the log level to get detailed trace flags, and then repeat the user action that caused the problem and view the debug log that is created in the Log Inspector.
Support teams can drill down to the exact line of code, validation rule, or flow failure that caused the exception using the execution tree and system events. This removes the guessing and greatly reduces the average time to fix critical system bugs, minimising the impact on end-users.
Adhoc Data Analysis & Verification
There are times when administrators and developers need to verify that business logic is working properly by checking the state of data on custom objects or standard relationships. Pros don’t waste time writing custom reports or digging through multi-layered user interface menus. They use the Developer Console’s Query Editor tab.
They can quickly review field values, validate unique identifiers, assess sharing rules, and determine whether automated data enrichment processes have updated records correctly by creating targeted queries. This capability makes database auditing and fast data quality validation easier for implementation projects, data migrations and routine maintenance cycles.
Running Code: Testing and Validation
A core requirement of salesforce development is code coverage and business logic validation via unit tests. The Developer Console has a Test Management menu that enables a developer to run all local test classes or all organization test classes. Developers get to see real-time execution progress, detailed pass/fail metrics and overall code coverage percentages.
This immediate feedback loop allows developers to ensure new code changes do not break existing functionality and meet the platform’s strict deployment requirements. Test developers are able to filter failing test methods, and see individual assertion failures and stack traces, for quick diagnosis of test anomalies.
Quick fixes and hotfix delivery
Most feature development is done in local dev environments under source control. But sometimes you need an urgent fix out the door right away. If a developer needs to fix a small syntax problem or change a field reference in a production environment or hotfix sandbox, they can simply open the affected component right inside the console’s source code editor, make the fix, and save the file back to the server right there and then.
The compilation engine at the server checks the changes live. It checks the syntax is correct and the code can be deployed . This agility is crucial in live go-live events or emergency support windows where every minute matters.
More features, more uses
Beyond its core editing and debugging panels, the Developer Console also contains a range of specialised utilities to support advanced technical workflows and architectural analysis.
Find Packages and Navigate To Symbols
Working with large Salesforce orgs with thousands of custom classes, triggers and objects can be daunting. The Developer Console has a full featured open resource feature that enables the user to search for any component by name or type on the fly. Developers are able to type partial search terms to quickly find a specific Apex class, Visualforce page or object, without manually browsing the folder directories. Also, symbol navigation capabilities help developers to navigate to method definitions, variable declarations, property blocks inside large files in a codebase.
Watching events and searching the database schema
Well built applications are built on well understood data models. The setup menu has the usual schema builder tools . Technical users can also view object structures, field types, relationship names and custom attributes directly via query structures and object inspector utilities in the Developer Console. Administrators can also monitor platform event logs, streaming API channels, and asynchronous job queues to make sure that platform resources are being used optimally and long-running transactions are being optimised.
Advantages and Disadvantages of Modern Workflow
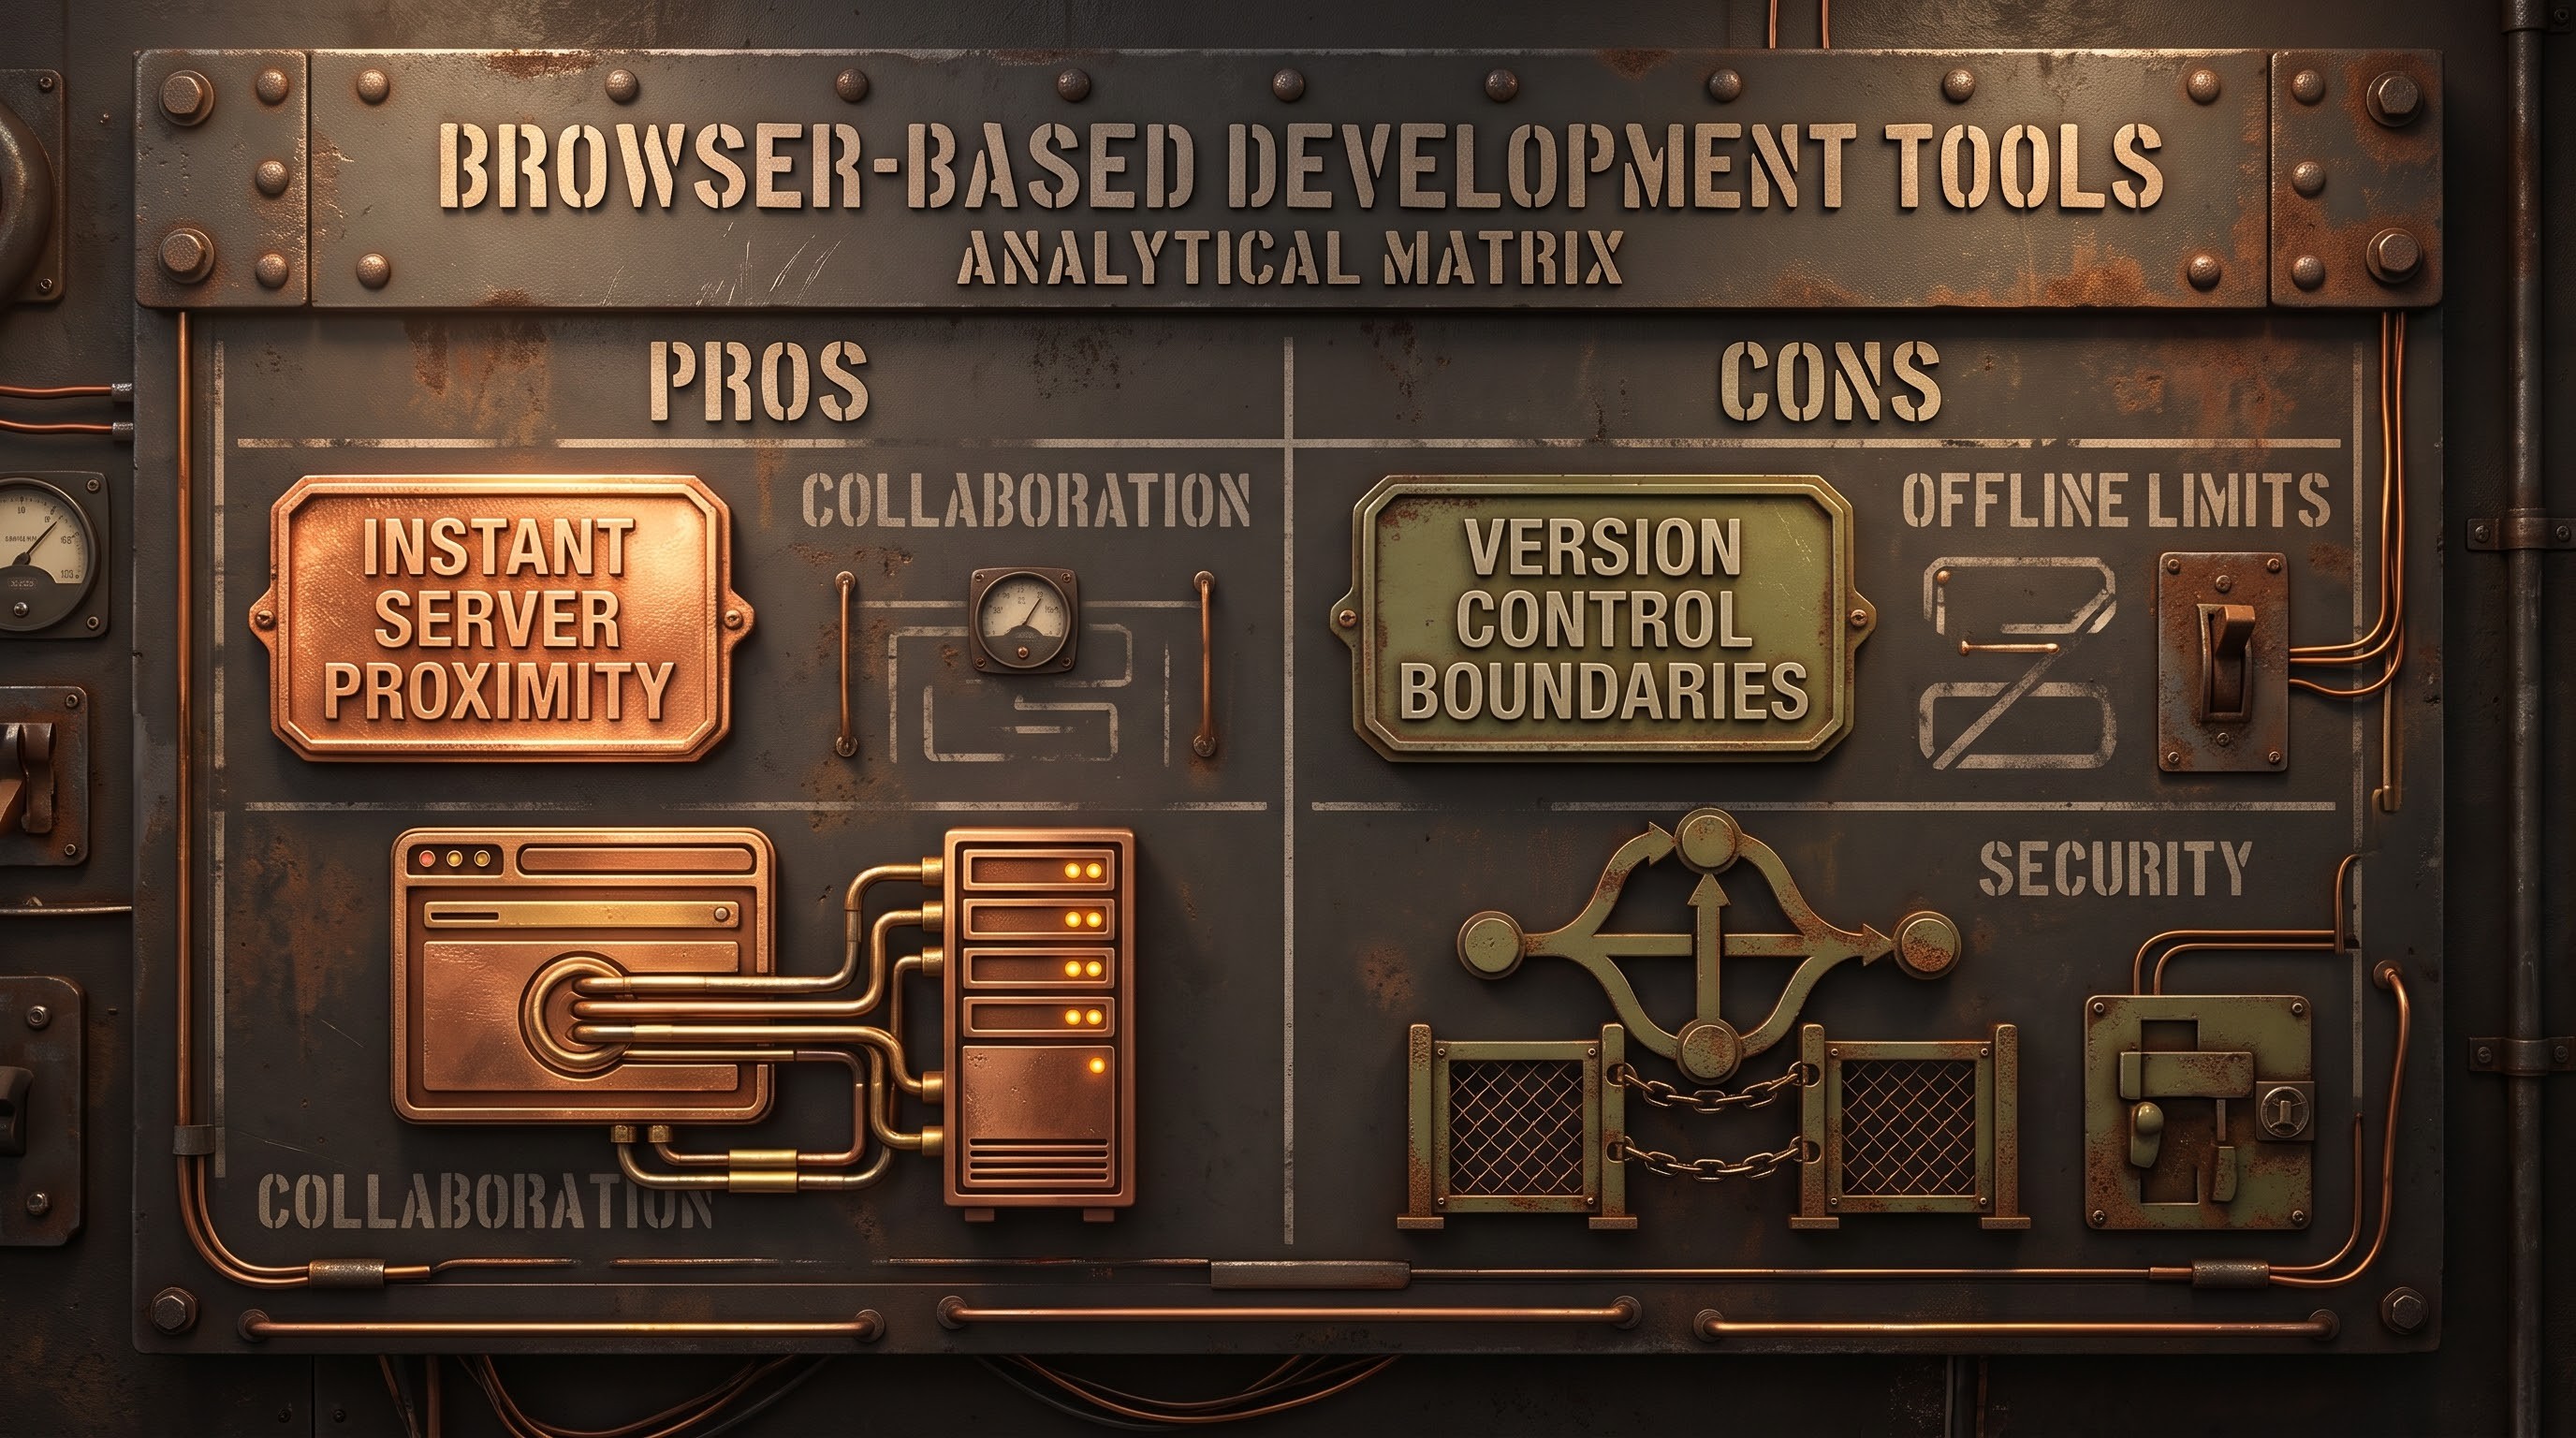
Just like any other specialised tool, the Salesforce Developer Console has its own strengths and limitations that dictate where it fits best in an enterprise tech stack.
Key benefits
Availability Right Away The Console is universally available across devices and OS and can be launched from any modern browser with valid credentials with no installation/config files/local dependencies required:
Direct Org Proximity: Lives in the target Salesforce environment giving you a direct view of live metadata, active data records and real-time execution states.
Integrated Diagnostics: Create, test and debug code in one environment without the need to jump between several external applications using the Execute Anonymous window, Query Editor and Log Inspector.
Zero Footprint Administration: Administrators and developers are able to quickly diagnose and make emergency fixes without installing heavy local development environments or configuring complex command-line tools.
Biggest Limitations
Limited Version Control Support: The Developer Console lacks native support for Git or other version control repositories found in modern integrated development environments like Visual Studio Code. So any changes you make in the console directly are not automatically committed or tracked like a branch.
Modern Framework Limitation The code editor was built for legacy and server-side paradigms such as Apex, Visualforce and Aura components, with limited native support and syntax highlighting for modern client-side architectures such as Lightning Web Components:
Scalability considerations: The console interface can be slow for very large enterprise organisations with thousands of metadata components. This makes it more difficult to refactor extensively or navigate a project widely than with desktop alternatives.
Limited Collaborative Editing The console is not multi-user and does not support real time collaborative editing or peer code review workflows in the same editing session.
Developer Console: Do's and Don'ts
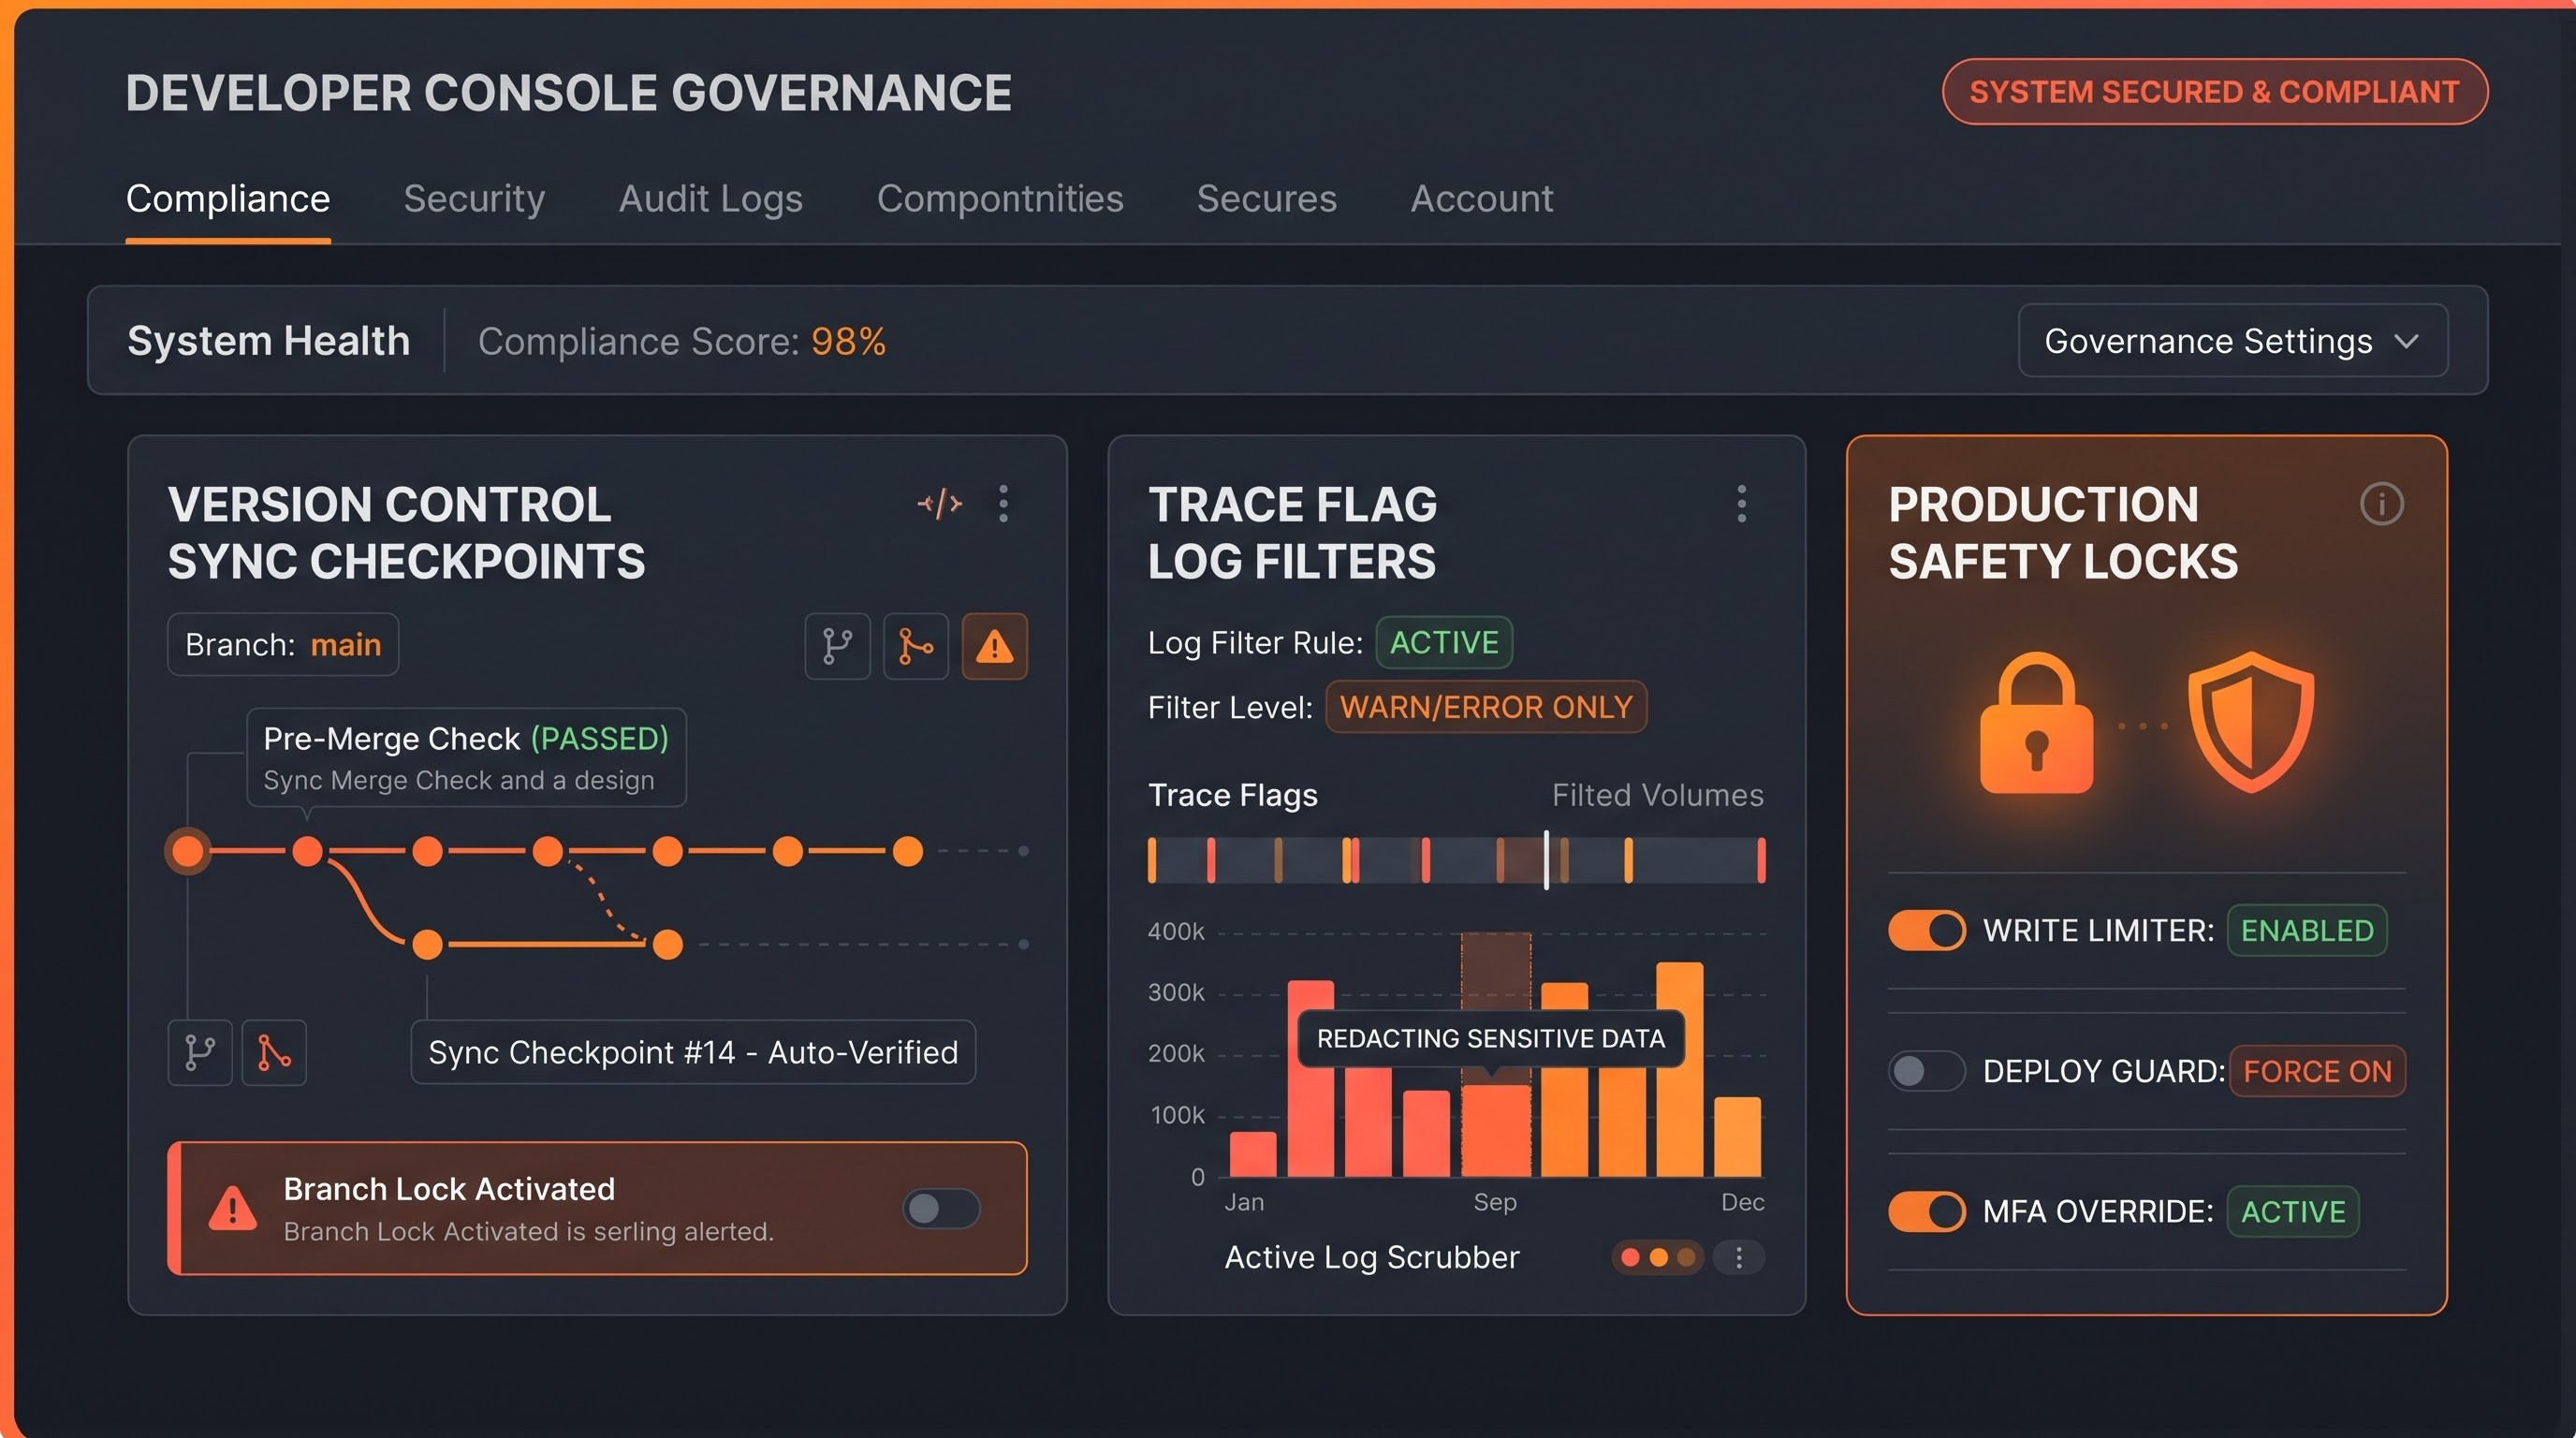
Technical teams should follow industry best practices to overcome the limitations of the Developer Console and realise its full value.
Ensuring the Integrity of Source Control
Developers should be careful about editing directly in production or a shared sandbox, because edits made directly in the Developer Console are not processed through the local version control system. Developers should immediately sync code changes back to their local source repositories as code changes are run in the console to avoid code drift, and to ensure that future deployments correctly overwrite changes.
Powerful Filtering and Log Management
When debugging complex enterprise transactions, the debug logs can be huge, containing thousands of system events that are not needed. Developers should specify trace flags and log levels. They should restrict the verbosity of database, workflow and validation logs to particular user-ids or classes of applications. This makes the logs readable and the execution path of interest.
Governance and Security Challenges
Edit meta data in file directly. The Execute Anonymous window gives you a lot of programmatic power. Organisations should have robust safety protocols in place and only provide access to production Developer Consoles to authorised developers and technical architects. Running anonymous scripts in production without control could lead to modification or corruption of your data or severe degradation of performance.
Conclusion
The Salesforce Developer Console has a special and significant role in the huge and fast growing world of cloud application development. The platform has evolved from the humble beginnings to a massive enterprise-grade architecture, with complex distributed microservices, artificial intelligence integrations, and sophisticated component frameworks. The tools available to developers have exploded. Typical components of a modern development pipeline are powerful desktop IDEs, command line interfaces, automated continuous integration servers, and distributed version control systems. With the move toward local, source-driven development, the browser-based Developer Console continues to be a critically important cornerstone utility for technical professionals everywhere.
The main reason the Developer Console still has value is that it gives you direct, unmediated access to live organization metadata and runtime environments. The ability to open a browser tab and instantly inspect server-side state gives developers unmatched agility when faced with unexpected production exceptions, data anomalies, or urgent configuration bugs. Features like the Execute Anonymous window eliminate the friction of building temporary test harnesses so a technical staff can validate data transformations and run helper logic on the fly. The interactive Query Editor also lets administrators and engineers see custom objects and complex relationship structures at a glance, without having to create complex reporting views or custom data grids.
But the console’s advanced diagnostics, particularly the Log Inspector and its multi-pane execution views, are still important for observing complex transaction flows. After the maze of triggers, asynch batch jobs, validation rules, and automated flows it can be daunting. Developer Console takes these intricate system behaviours and presents them as actionable overviews, hierarchical execution trees and timeline analysis so that developers are able to pinpoint bottlenecks and governor limit violations with surgical precision. This instant feedback loop bridges the gap between high-level architectural design and the nitty-gritty of run-time debugging.
A realistic assessment of the inherent limitations of the console is also part of the professional engineering standards. It is not a substitute for local source-controlled repositories. And it is not optimised for the collaborative multi-developer workflows required by large enterprise projects. The modern client side frameworks and continuous delivery pipelines are complex and need the robustness of dedicated desktop environments. Knowing these boundaries, teams can use the console for what it is best suited for: rapid hot-fixes, production diagnostics, ad-hoc data auditing and agile administrative oversight.
It helps to easily troubleshoot through interaction, and makes sure that developers and administrators can maintain the health of the system and the data security too. If one wishes to become proficient in this area, and gain knowledge right from the scratch till the end of the whole process and not just the Developer Console, then undertaking a salesforce developer course online will be immensely helpful.
Lastly, the ability to leverage the benefits of the Salesforce Developer Console gives a safety buffer and a diagnostic tool which is accessible at all times. This makes the whole process of debugging very easy for the developers and administrators to make sure that the systems are in proper shape and business criticalities are handled effectively. To begin your career with a deeper understanding of such capabilities of these platforms, you should opt for salesforce developer training online.