
Salesforce Developer Console: Features and Practical Uses
Last updated on Nov 9, 2026
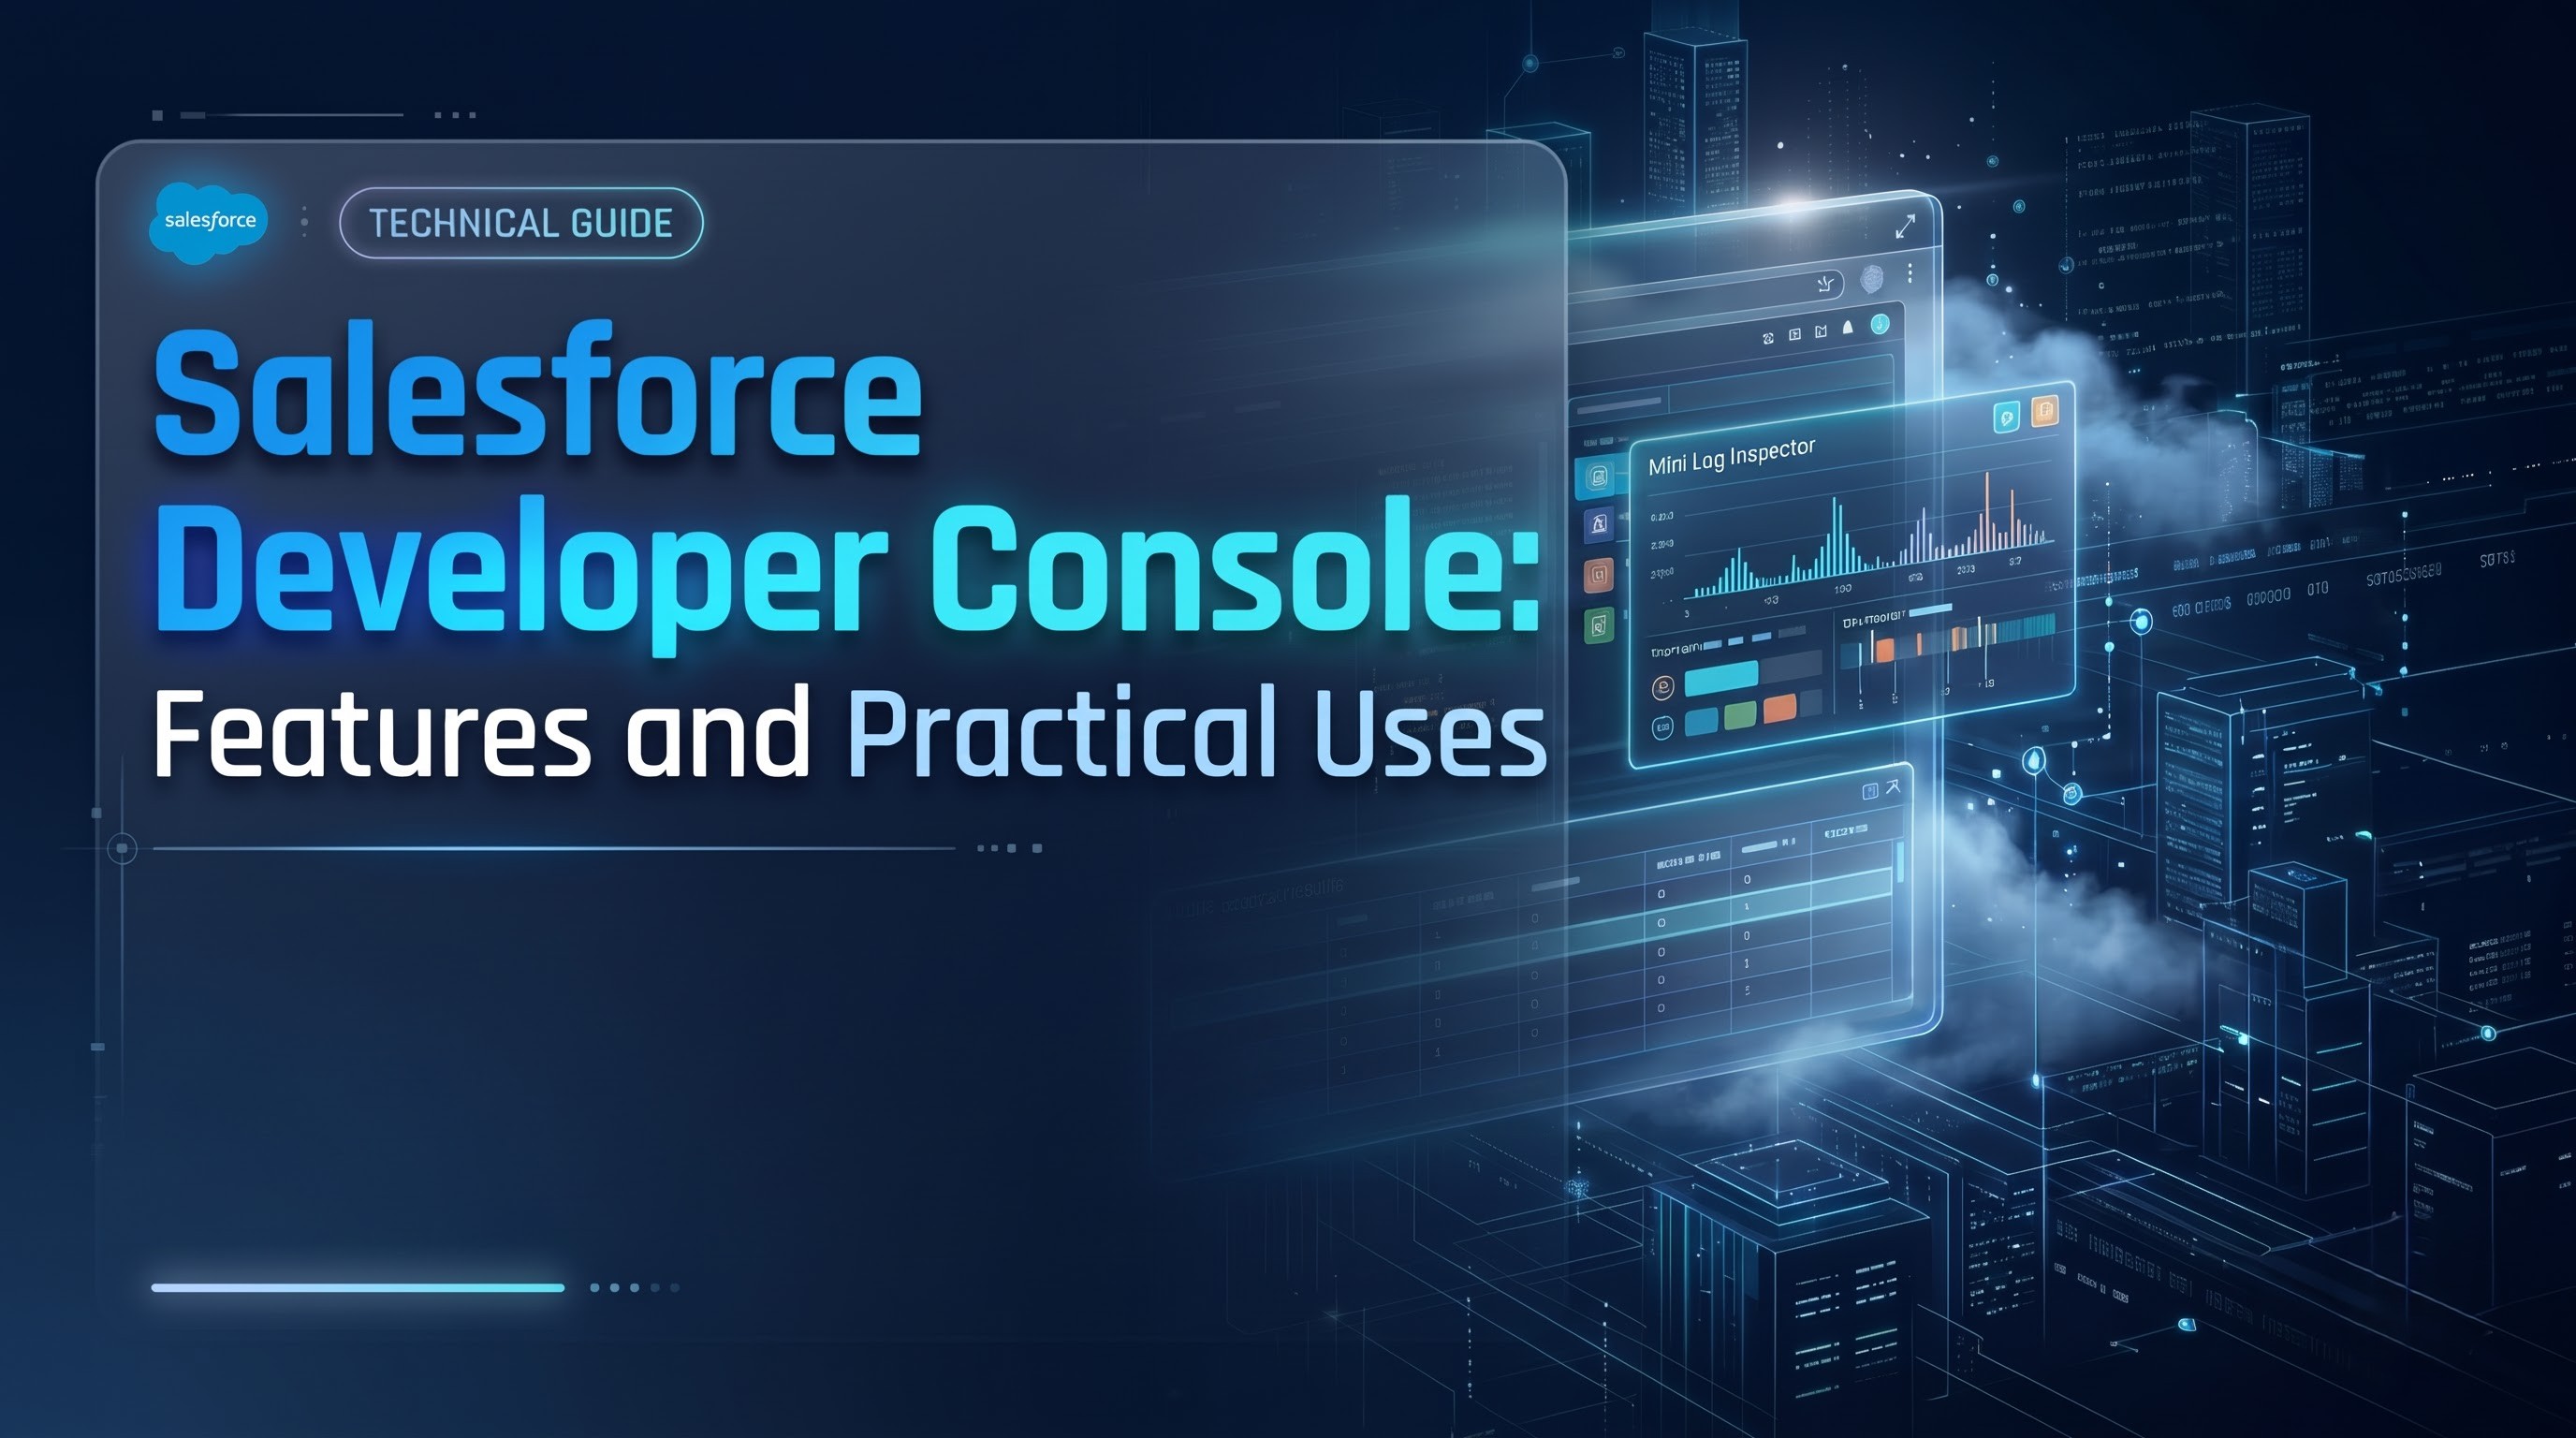
Developer Workspace: What Is It and How It Has Evolved
The Salesforce ecosystem has grown up a lot over the years, from a simple, declarative customer relationship management system to a powerful, enterprise-grade cloud application platform. As developers and administrators write more complex custom logic, integrations and automation workflows, the need for an accessible, integrated and responsive development interface has become critical. While modern enterprise development often leverages advanced local environments like Visual Studio Code with Salesforce Extensions and the Salesforce Command Line Interface, the Salesforce Developer Console is still an essential tool that is built into every Salesforce instance.
The Salesforce Developer Console is a web-based integrated development environment (IDE). You don't need to install software on your local machine, mess around with configuration files, or wrestle with complicated plugins. This is a light-weight yet powerful toolbox that can be accessed directly from the setup menu of any Salesforce org. It allows developers, administrators and technical architects to rapidly build, edit and manage code, run ad hoc queries, execute snippets of business logic, test unit validation suites and parse deeply nested execution debug logs. The basic architectural characteristics are learned by professionals and their application in practice in everyday work is learned. This allows them to debug production behaviour, build fast solutions for prototypes and optimise development lifecycles without leaving the browser.
It is only by understanding the basic architecture and uses of this platform that professionals can understand the behavior of production, create quick fixes, and optimize the development lifecycle without stepping out of their browsers. If you are a learner who wants to learn the skills of working on this environment, then joining a salesforce development course will be beneficial for you.
Architectural Features of Developer Console
Developer Console has a complete set of utilities in one graphical workspace. Every section of the console is designed to address a particular step in the application development life cycle, from writing code and examining the database to testing performance and tracking down errors.
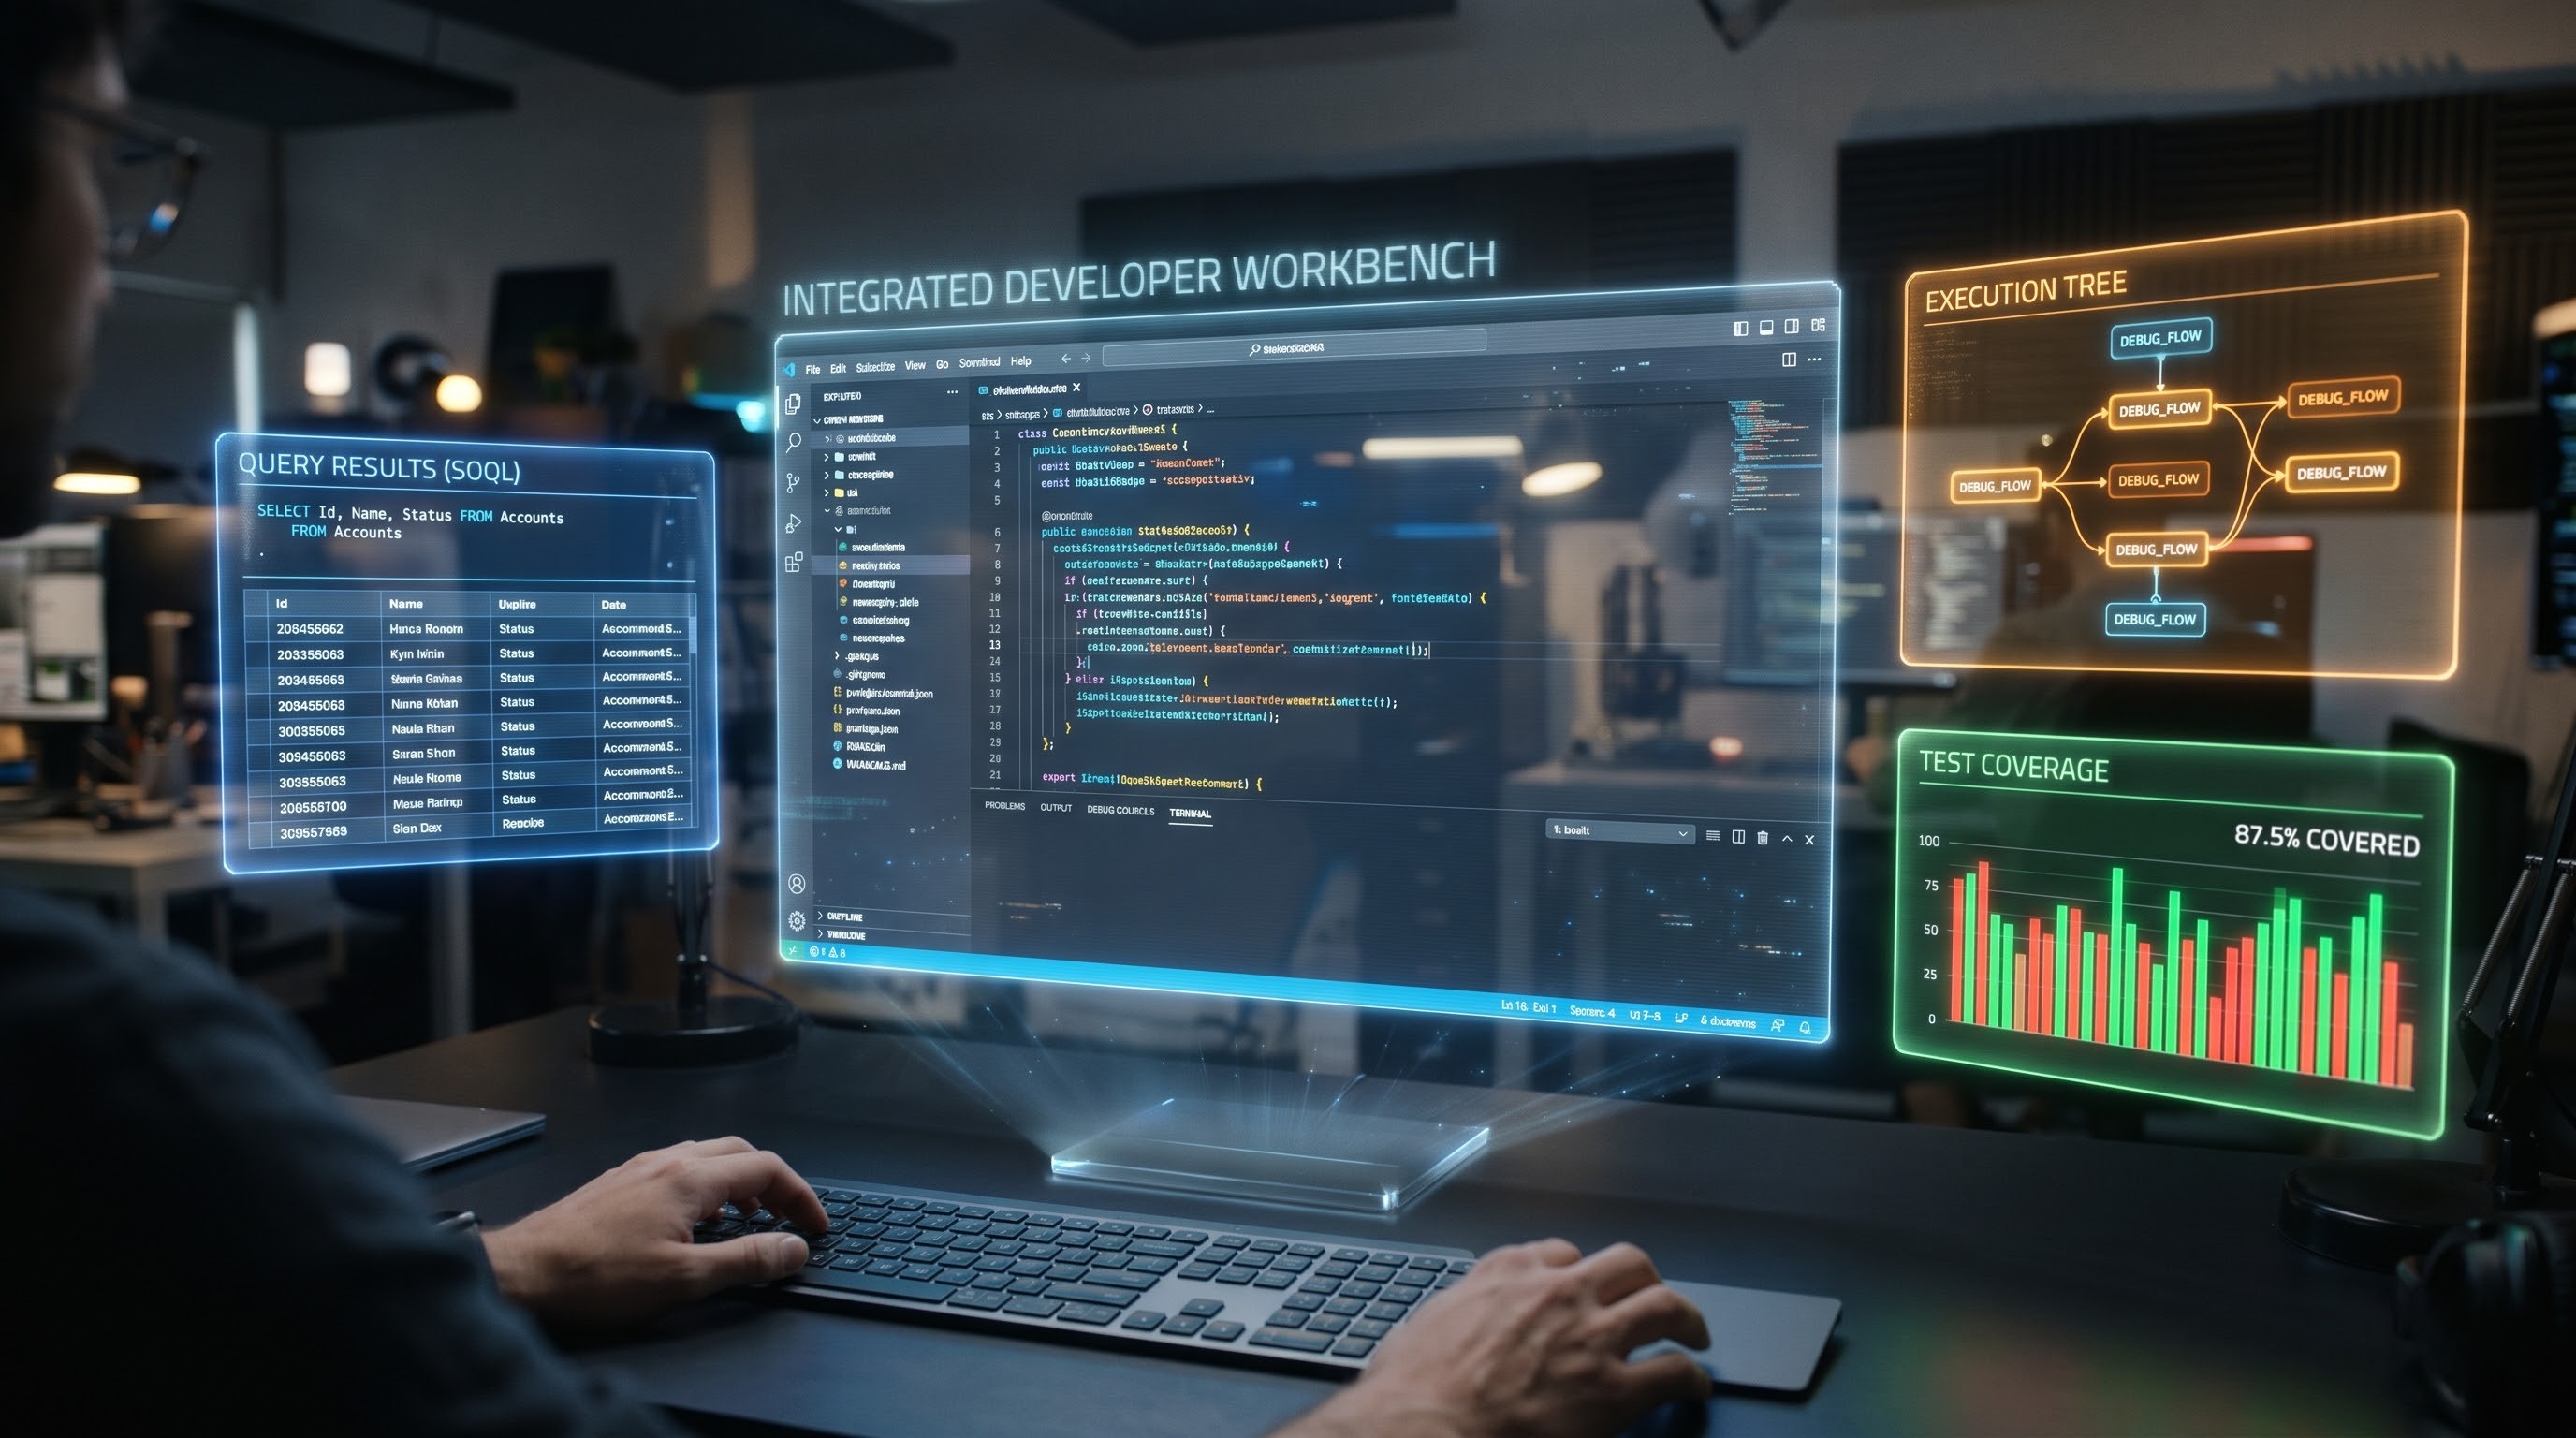
Editing Source Code Editing Source Code Working with Workspaces
The Developer Console is basically a multi-tab source code editor. The editor supports many of the native Salesforce languages and metadata types including Apex classes, Apex triggers, Visualforce pages, Visualforce components, Aura definitions and more. Developers are able to open existing components, change and save the changes directly back to the server.
The editor offers basic syntax highlighting, indentation support and context sensitive code completion proposals, triggered by keyboard shortcuts. It lacks the advanced refactoring and git-integration of modern IDEs, but being close to the live org metadata makes it incredibly fast for small changes, hotfixes or just looking at the file structure on the server.
Open in Private Window
The Execute Anonymous window is one of the most used features in the Developer Console. In the salesforce architecture apex code is mostly found in compiled classes or triggers. But developers often need to execute code snippets on the fly to test methods, instantiate utility classes or run data migration scripts.
Execute Anonymous lets you write and run any block of Apex code immediately, in the security context of the current user. This environment automatically captures execution output, system debug statements and runtime exceptions and is a must have utility to verify data transformations or test isolated logic blocks prior to embedding them into larger framework components.
Native Query Editor (SOQL & SOSL)
Strong knowledge of Salesforce Object Query Language (SOQL) and Salesforce Object Search Language (SOSL) to interact with the Salesforce database. The Developer Console also has a Query Editor tab that makes database management an interactive experience.
Users can type their own SOQL or SOSL queries, execute them against the org data model, and view the results in a structured grid. The query editor also provides tooltips, relationship queries and aggregate functions that enable administrators and developers to explore data relationships, confirm field API names and view record values in real time, without writing custom report types or building list views.
Enhanced Debugging and Log Inspector
Some complex enterprise apps have triggers, async processing, flows, and validation rules and those can make it hard to trace the source of errors. This is remedied in the Developer Console with a very handy Logs tab and Log Inspector. The Salesforce org generates a detailed system log for each transaction. The Developer Console writes out the logs in real-time.
Opening a log in the Log Inspector opens a multi-pane, context-sensitive execution viewer. Transactions are subsumed into a number of specialist panels:
Execution Overview: Displays total execution time, database query count, and resource usage statistics.
Execution Tree : A hierarchical tree of method calls, trigger executions and rule evaluations that shows the exact path of execution to allow a developer to backtrack.
Stack Tree: Shows methods grouped by execution time to help find performance bottlenecks.
Timeline : Offers a graphical timeline of events, allowing you to see how long database operations or workflow evaluations took relative to the overall transaction.
Another cool feature is that developers are able to put checkpoints in their Apex code to retrieve the heap state, variable values and object instances at specific lines of execution. This will greatly reduce the need for the old System.debug statements.
Apex Test Runner and Code Coverage Management
Unit testing is essential to meet the Salesforce platform deployment requirements and to achieve the highest quality of software. A Test menu and management interface is available in the Developer Console for technical teams to run all test classes or local test classes in parallel.
The test runner lets you see the progress of your tests running live, whether they passed or failed, and detailed error messages for failed assertions .
The overall code coverage panel calculates and displays the percentage of your compiled Apex code that is covered by unit tests. This is critical for teams to meet mandatory platform thresholds before staging migrations or packaging applications for enterprise release.
Practical Applications and Real World Use Cases
The Developer Console has rich architectural capabilities but the real value is realised in day-to-day engineering, administration and support scenarios.
Rapid Prototyping and Verification of Logic
When developers are first designing a feature, they often want to make sure a particular platform API does what they expect under certain constraints. Rather than build a full local project, create mappings for local scratch orgs, and push metadata using command-line scripts, a developer can use the Developer Console to do rapid prototyping.
An engineer can write a quick block of logic in the Execute Anonymous window to test the behaviour of a custom wrapper class, the limits of a complex algebraic calculation, or how a particular JSON parser handles malformed payloads. This rapid feedback loop speeds up the first phase of software engineering, when you're brainstorming and experimenting.
Production Logging Diagnostics and Troubleshooting
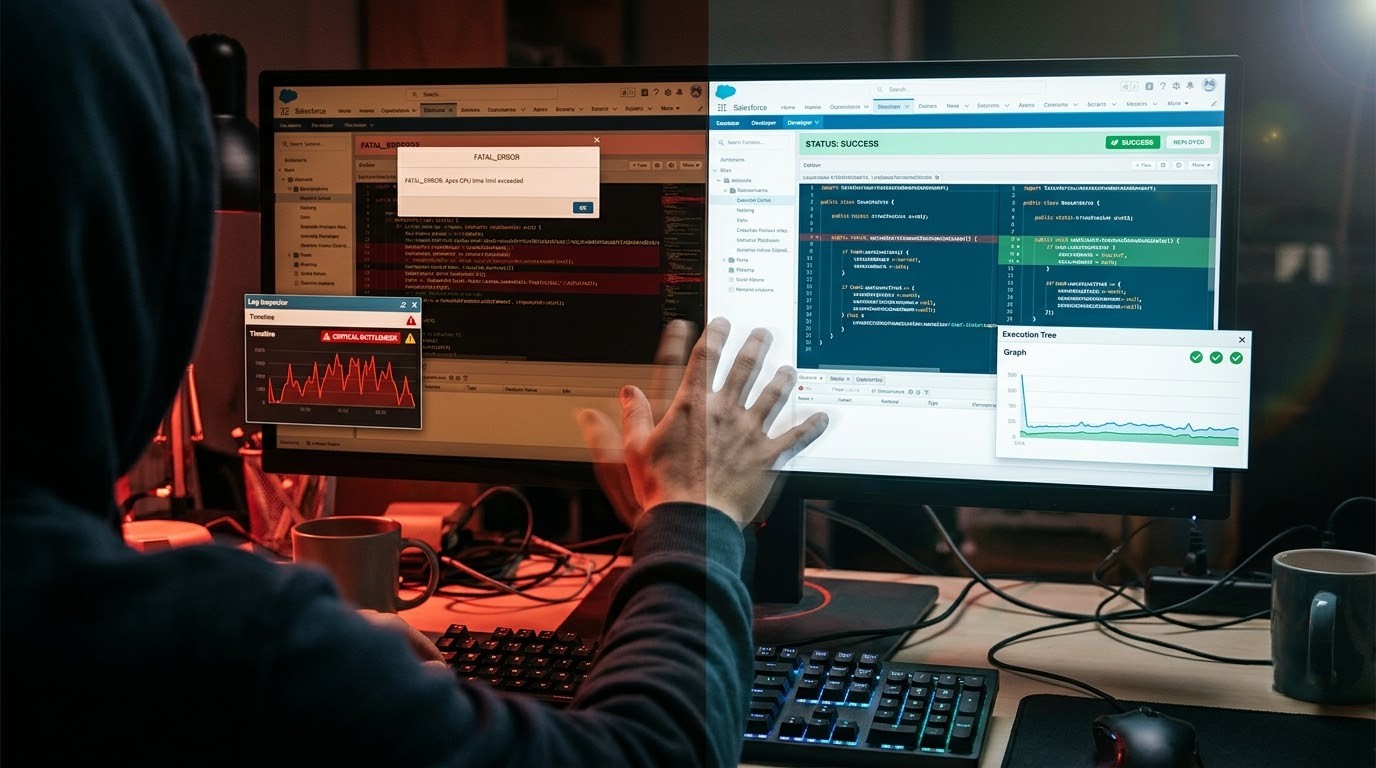
Production environments often host unique data scenarios that are not easily replicated in isolated sandbox environments due to data volume, integration dependencies, or complex user-specific security profiles. When an end-user hits an unhandled exception or unexpected validation error in a production org, your immediate diagnostic emergency room is the Developer Console.
Admin/support engineers can set system log levels for certain user ids or trace flags. The problematic user action can then be reproduced in a separate browser tab and the resultant debug log can be immediately grabbed. With the Log Inspector’s execution tree and log panels, the team can drill down to the exact line of code, recursive trigger or faulty validation rule that is causing the disruption so they can quickly resolve incidents and minimise user downtime.
Database Forensics and Data Auditing

As Salesforce implementations grow, so do the typical data integrity issues - orphaned child records, legacy import bad picklist values, missing foreign key relationships, etc. Standard list views and reports are useful for business users but technical investigations often need accurate filtering and inspection of relational data.
The Developer Console’s Query Editor allows technical staff to conduct in-depth, ad-hoc data audits. By writing specific SOQL queries using parent-child subqueries or polymorphic fields, admins can quickly find anomalous data records across multiple related objects. You can also use Execute Anonymous with these queries. Developers are able to write targeted data-correction scripts to safely and efficiently clean up corrupt data batches.
Monitor Async Processing and Batch Jobs
Enterprise Salesforce apps play a major role in the asynchronous execution model. Batch Apex, Queueable Apex, Scheduled Jobs, and Future methods are all asynchronous execution models. This allows Salesforce to handle large volumes of data and integration payloads without platform synchronisation timeouts.
Salesforce Setup menu has a very basic interface to monitor Flex Queue and Apex Jobs. When used in conjunction with trace flags and log inspection, Developer Console provides more detail. Developers are able to see the progress of batch executions, check the error count for the various job items and ensure that scheduled background processes are queued and executed in the right order without interrupting synchronous user transactions.
Running unit tests and checking coverage before deployment
Salesforce has very strict code coverage rules that have to be met before any code migration can be promoted from a lower sandbox environment to staging or production targets. Automated unit tests should validate at least seventy-five percent of the overall application code.
With the Developer Console you can check the quality continuously in the development cycle. Developers are able to track changes by running targeted test suites to ensure that no regressions have been introduced. The console's class viewer provides developers with line-by-line coverage, highlighting untested conditional branches, loops or exception blocks in colour, all of which contribute to building strong, resilient software.
Strategic benefits of the development process
The Developer Console remains popular because it offers several unique strategic advantages over pure external tooling models.
No install, universal access
The Developer Console is a purely web-based tool, running natively in the Salesforce cloud infrastructure. No software to install. No dependencies to manage. No versions to update. A developer, architect or administrator can log in to an organization from any modern web browser, whether it be a corporate workstation, a personal laptop or a temporary device, and immediately be given access to a fully functional development and diagnostic suite. It is everywhere and is an essential tool for remote troubleshooting and ad hoc demonstrations.
Security Native and integration Platform
Security is a major concern in enterprise cloud computing. External development environments often require things like connected apps, OAuth tokens, stored credentials, and external network traffic routing. However, the Developer Console is entirely within the native security perimeter of the Salesforce trust architecture. It respects the logged in user's profile, permission sets, field level security and sharing rules so data access is tightly controlled. No customer data or meta-data ever leaves the console to a third party middleware or server when consoles are in use.
Closing the Gap Between Administration and Engineering

Salesforce implementations are different because they are run by a combination of low-code administrators and pro-code software engineers. Admins will often use declarative tools such as Flow Builder, validation rules and page layouts but often find that they need to understand code execution.
Developer Console is a logical next step for advanced administrators to become developers. Everyone who has worked with data exports knows the query editor of Developer Console, and its visual tools that allow inspecting the logs help make the abstract logic of the code clearer. For professionals striving to advance their careers in this direction, specific salesforce dev training will be of great help.
Limits and restrictions of operation
However, the Salesforce Developer Console is a powerful tool with many capabilities, but it is not meant to be a fully featured, stand-alone replacement for modern enterprise IDEs like Visual Studio Code. It is important to know the limits of its operations to keep healthy development practices.
No Source Tracking, Advanced Source Management
Robust version control systems, branching strategies, code reviews, and continuous integration pipelines (e.g., Git, GitHub) are a must in enterprise software development. You can make changes directly in the console and they are written to the server metadata directly, without tracking changes locally in a file. This makes it easy to overwrite changes by accident, or to forget what has changed between iterations. Any major feature development should always be done locally and synced using version controlled repositories.
Limitations of Existing Paradigms
The console has excellent support for back-end Apex and legacy front-end frameworks like Visualforce and Aura components. But it lacks native editing and preview capabilities for modern web standards like Lightning Web Components (LWCs). LWCs have modular directory structures, configuration XML documents, and modern JavaScript modules that you can’t manipulate from within the console. Developers creating modern user interfaces are stuck with local IDE setups.
Performance Constraints in Big Organisations
Developer Console is browser based and can degrade performance for large enterprise organisations with thousands of custom objects, millions of records and large codebases. Large execution logs or wide queries can use up a lot of browser memory and sometimes slow down the interface or cause session timeouts. Dedicated tools or optimised local scripts tend to serve heavy data analysis and bulk operations better.
Best Practice: Use Effectively
Technical teams should adhere to industry best practices to maximise the benefits and minimise the drawbacks of the Salesforce Developer Console:
Direct Editing on Prototyping and Hotfixes Console should be used for quick code tests, running queries and analysing production logs. Keep your main source code repository and your day to day development flow in a local IDE like Visual Studio Code.
Manage log levels wisely. Don't set log levels to maximum verbosity (e.g., everything set to FINEST) for extended periods of time across the entire organization if you're debugging complex transactions; it quickly eats up debug log storage limits and causes performance issues. Try to shoot at specific user-traces if possible.
Practice Safe Anonymous Execution Be very cautious when executing code snippets in the Execute Anonymous window in a production org. Always use proper transaction controls for all data alteration operations or test in sandboxes first to avoid unwanted data corruption.
Use the log clearing utilities in the console to keep your logs clean. This will help to prevent clutter and ensure that when you are troubleshooting live issues you are looking at the most recent and relevant transaction logs.
Conclusion
The Salesforce Developer Console is still a useful tool in the Salesforce ecosystem. It offers a zero-install, browser-based workspace that integrates code editing, ad-hoc database querying, anonymous execution, unit testing and deep transaction log inspection, enabling technical professionals to diagnose issues and validate solutions at amazing speed.
Big enterprise projects are bound to lure modern development teams to powerful local environments, but the Developer Console is still the ultimate roadside toolkit. From a field administrator debugging their data with a quick question to an architect tracking down a complicated asynchronous exception in a production environment, the Developer Console offers the instant insight and control necessary to keep Salesforce apps in good shape and running at their best. To gain industry-standard knowledge in this area and take your career forward, consider taking a salesforce developer online training today.