
Tableau Agent: When Your BI Tool Starts Working With You
Last updated on Aug 17, 2026
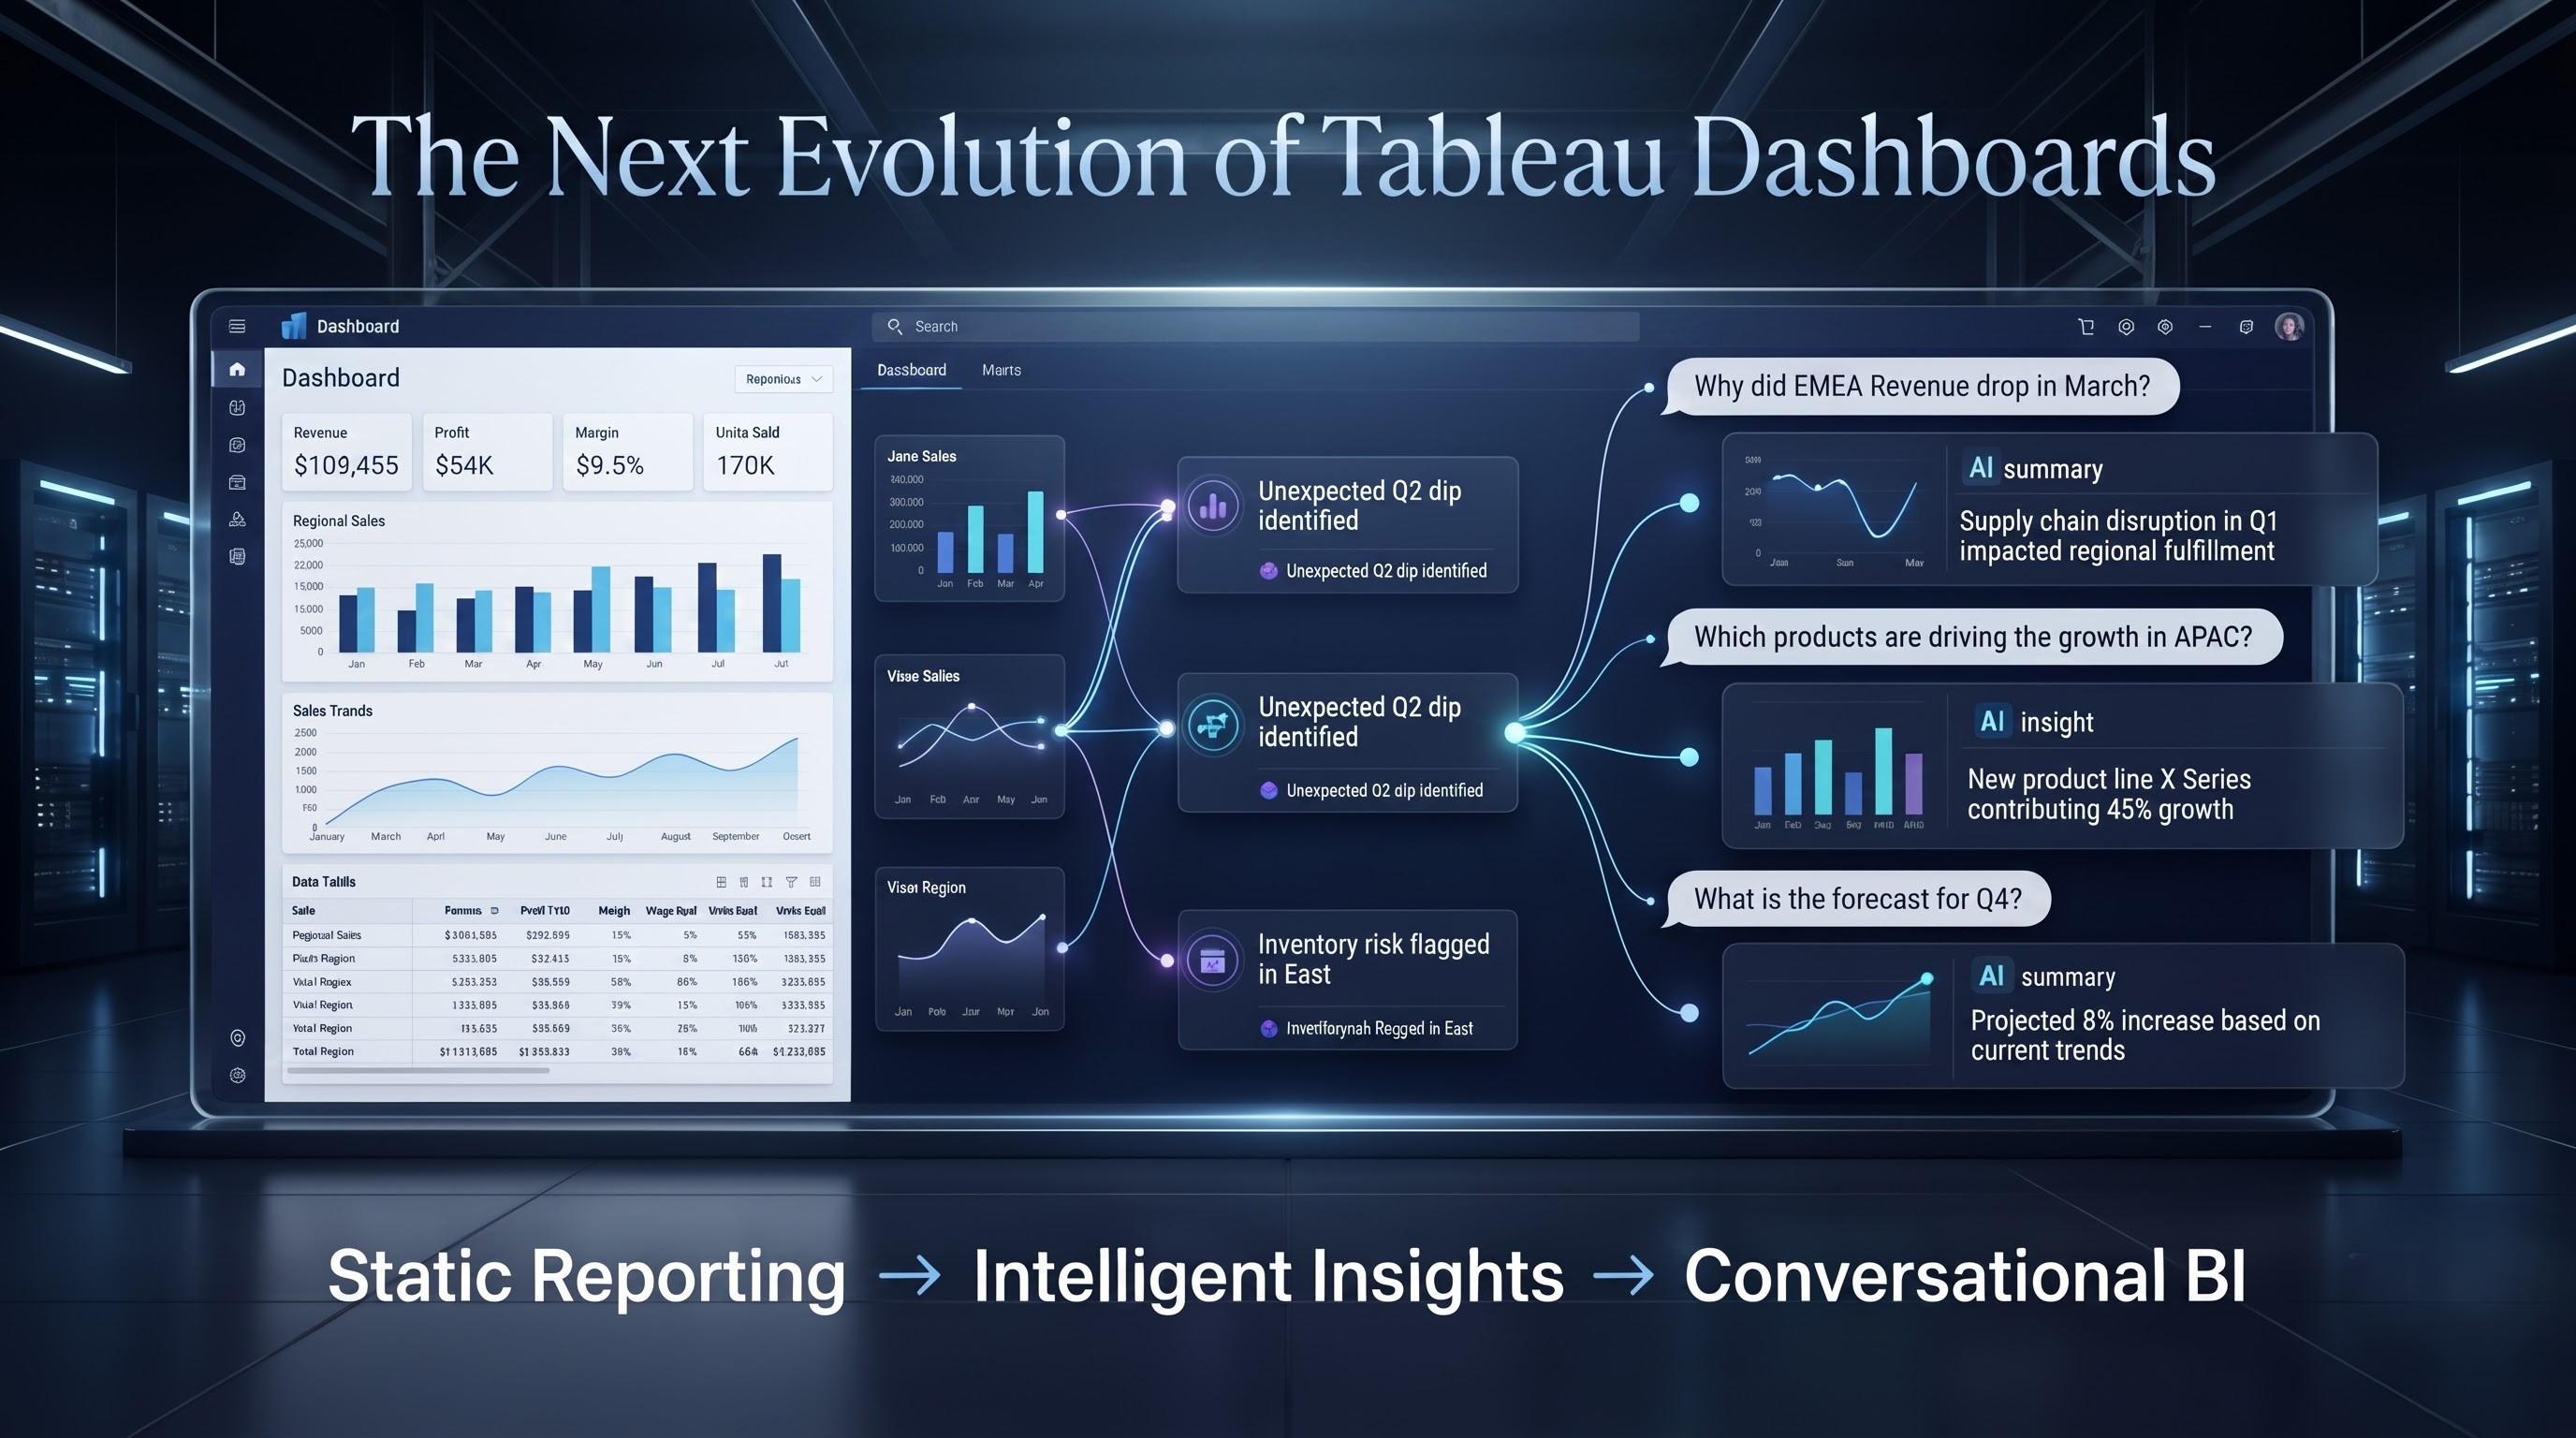
What if the next big change in business intelligence is not a better dashboard, but a better way to ask questions of your data?
For years, working with business intelligence has followed a familiar pattern. Data has to be collected, cleaned, connected, modeled, calculated, visualized, and finally interpreted. A business user might have a simple question—Why did sales fall in one region?—but answering it can require an analyst to move through several technical steps before the actual investigation even begins. That process is powerful, but it can also be slow. Now AI is beginning to change where that work starts.
With Tableau Agent, users can interact with parts of the Tableau analytics workflow through natural language. Depending on the Tableau experience, Agent can help with data preparation, calculations, visualization, exploration, and dashboard interpretation. Tableau describes it as a generative-AI assistant designed to support the journey from data preparation through analysis and consumption.
That sounds like a convenience feature. It is actually a change in how people can approach BI. The traditional approach asks users to understand the tool first and then translate their business question into the tool's language. The emerging approach starts with the question.
What do I want to understand?
That difference could have a bigger impact on BI than another new chart type ever could.
The Real Change: From Operating the Tool to Explaining the Problem
A business user does not normally think in terms of dimensions, measures, calculated fields, aggregations, or filters.
They think in questions.
Which region is growing fastest?
Why did profit drop last quarter?
Which products are driving revenue?
Are customers buying less frequently?
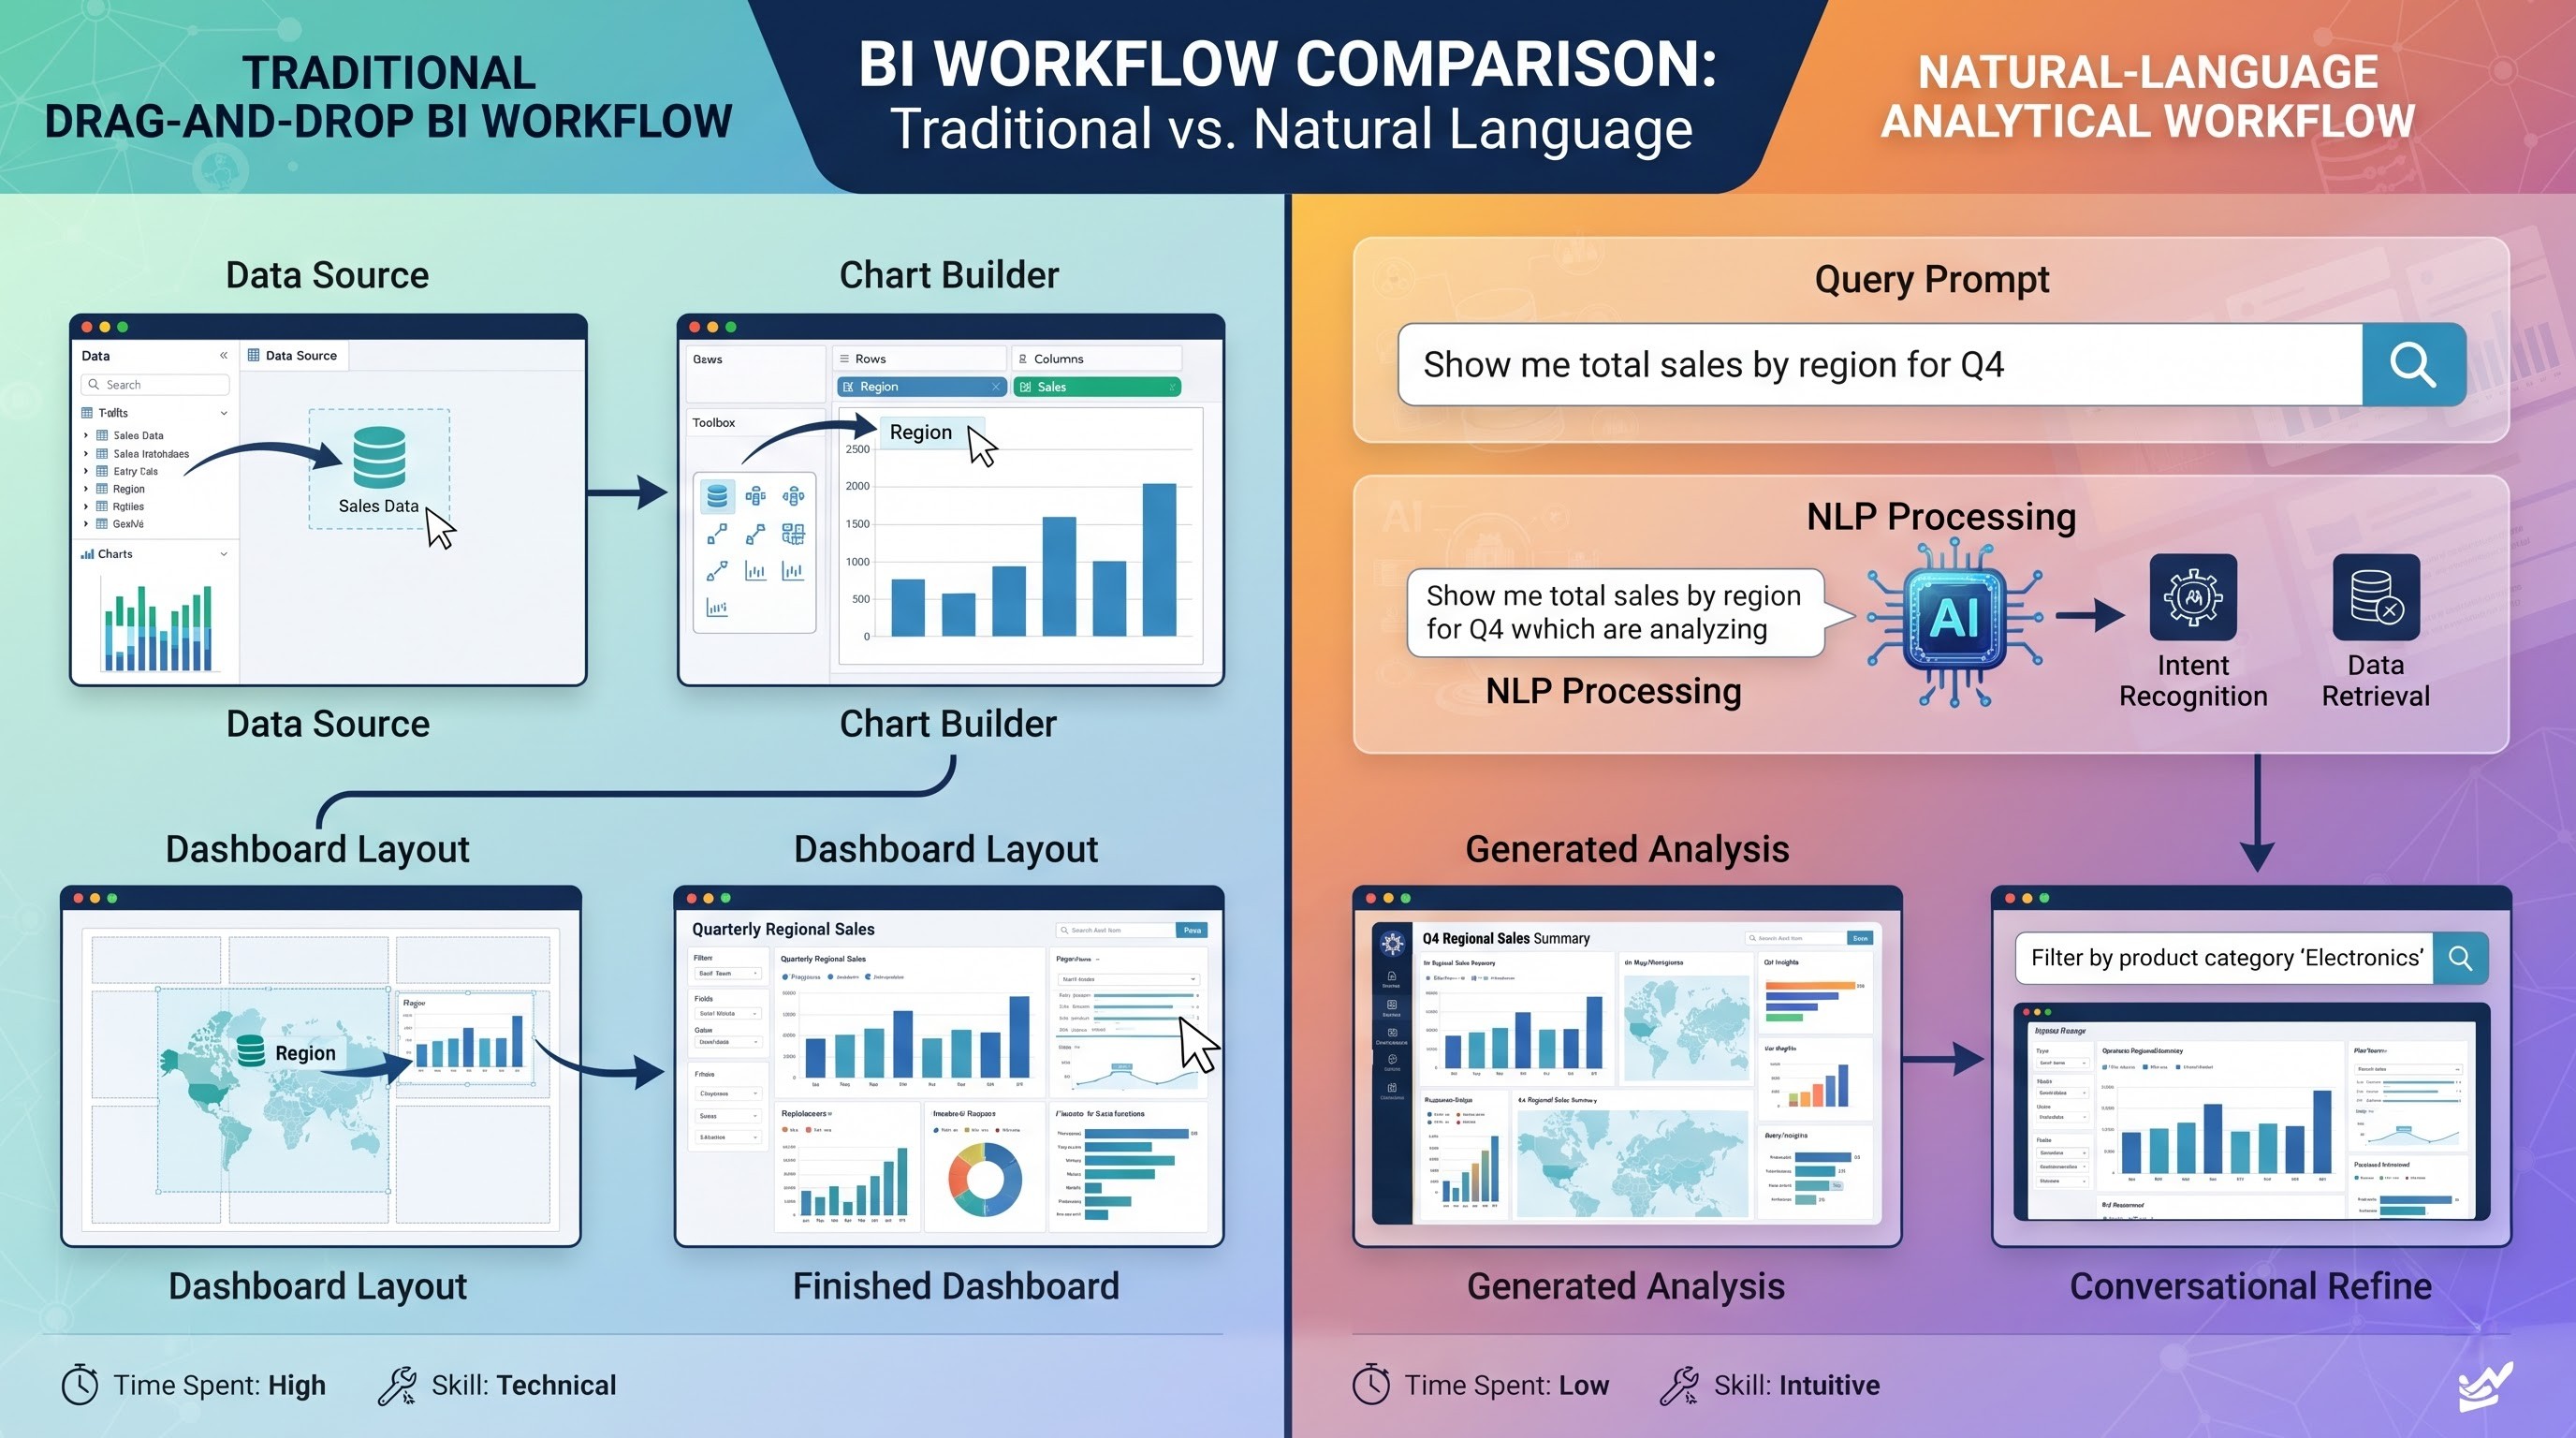
An experienced Tableau professional knows how to turn those questions into an analytical workflow. They know which fields to use, how to structure the calculation, which visualization makes sense, and what additional context might be needed. That expertise remains valuable. But AI can reduce some of the translation work between the question and the first analytical result.
Tableau Agent can take natural-language requests and help users create visualizations, perform time-series analysis, filter and sort data, and create or explain calculations. Tableau's documentation gives examples ranging from asking for a distribution to requesting a calculation based on the difference between two dates.
The important point is not that typing a sentence is easier than dragging a field. It is that intent can become the starting point of the analysis. That makes BI feel less like operating software and more like having a conversation with the data.
Tableau Agent Is More Than a Chatbot
Calling Tableau Agent a chatbot undersells what it is trying to do. A chatbot generally answers questions, while Tableau Agent is designed to work within Tableau's analytical environment and assist with specific tasks connected to the data and workflow.
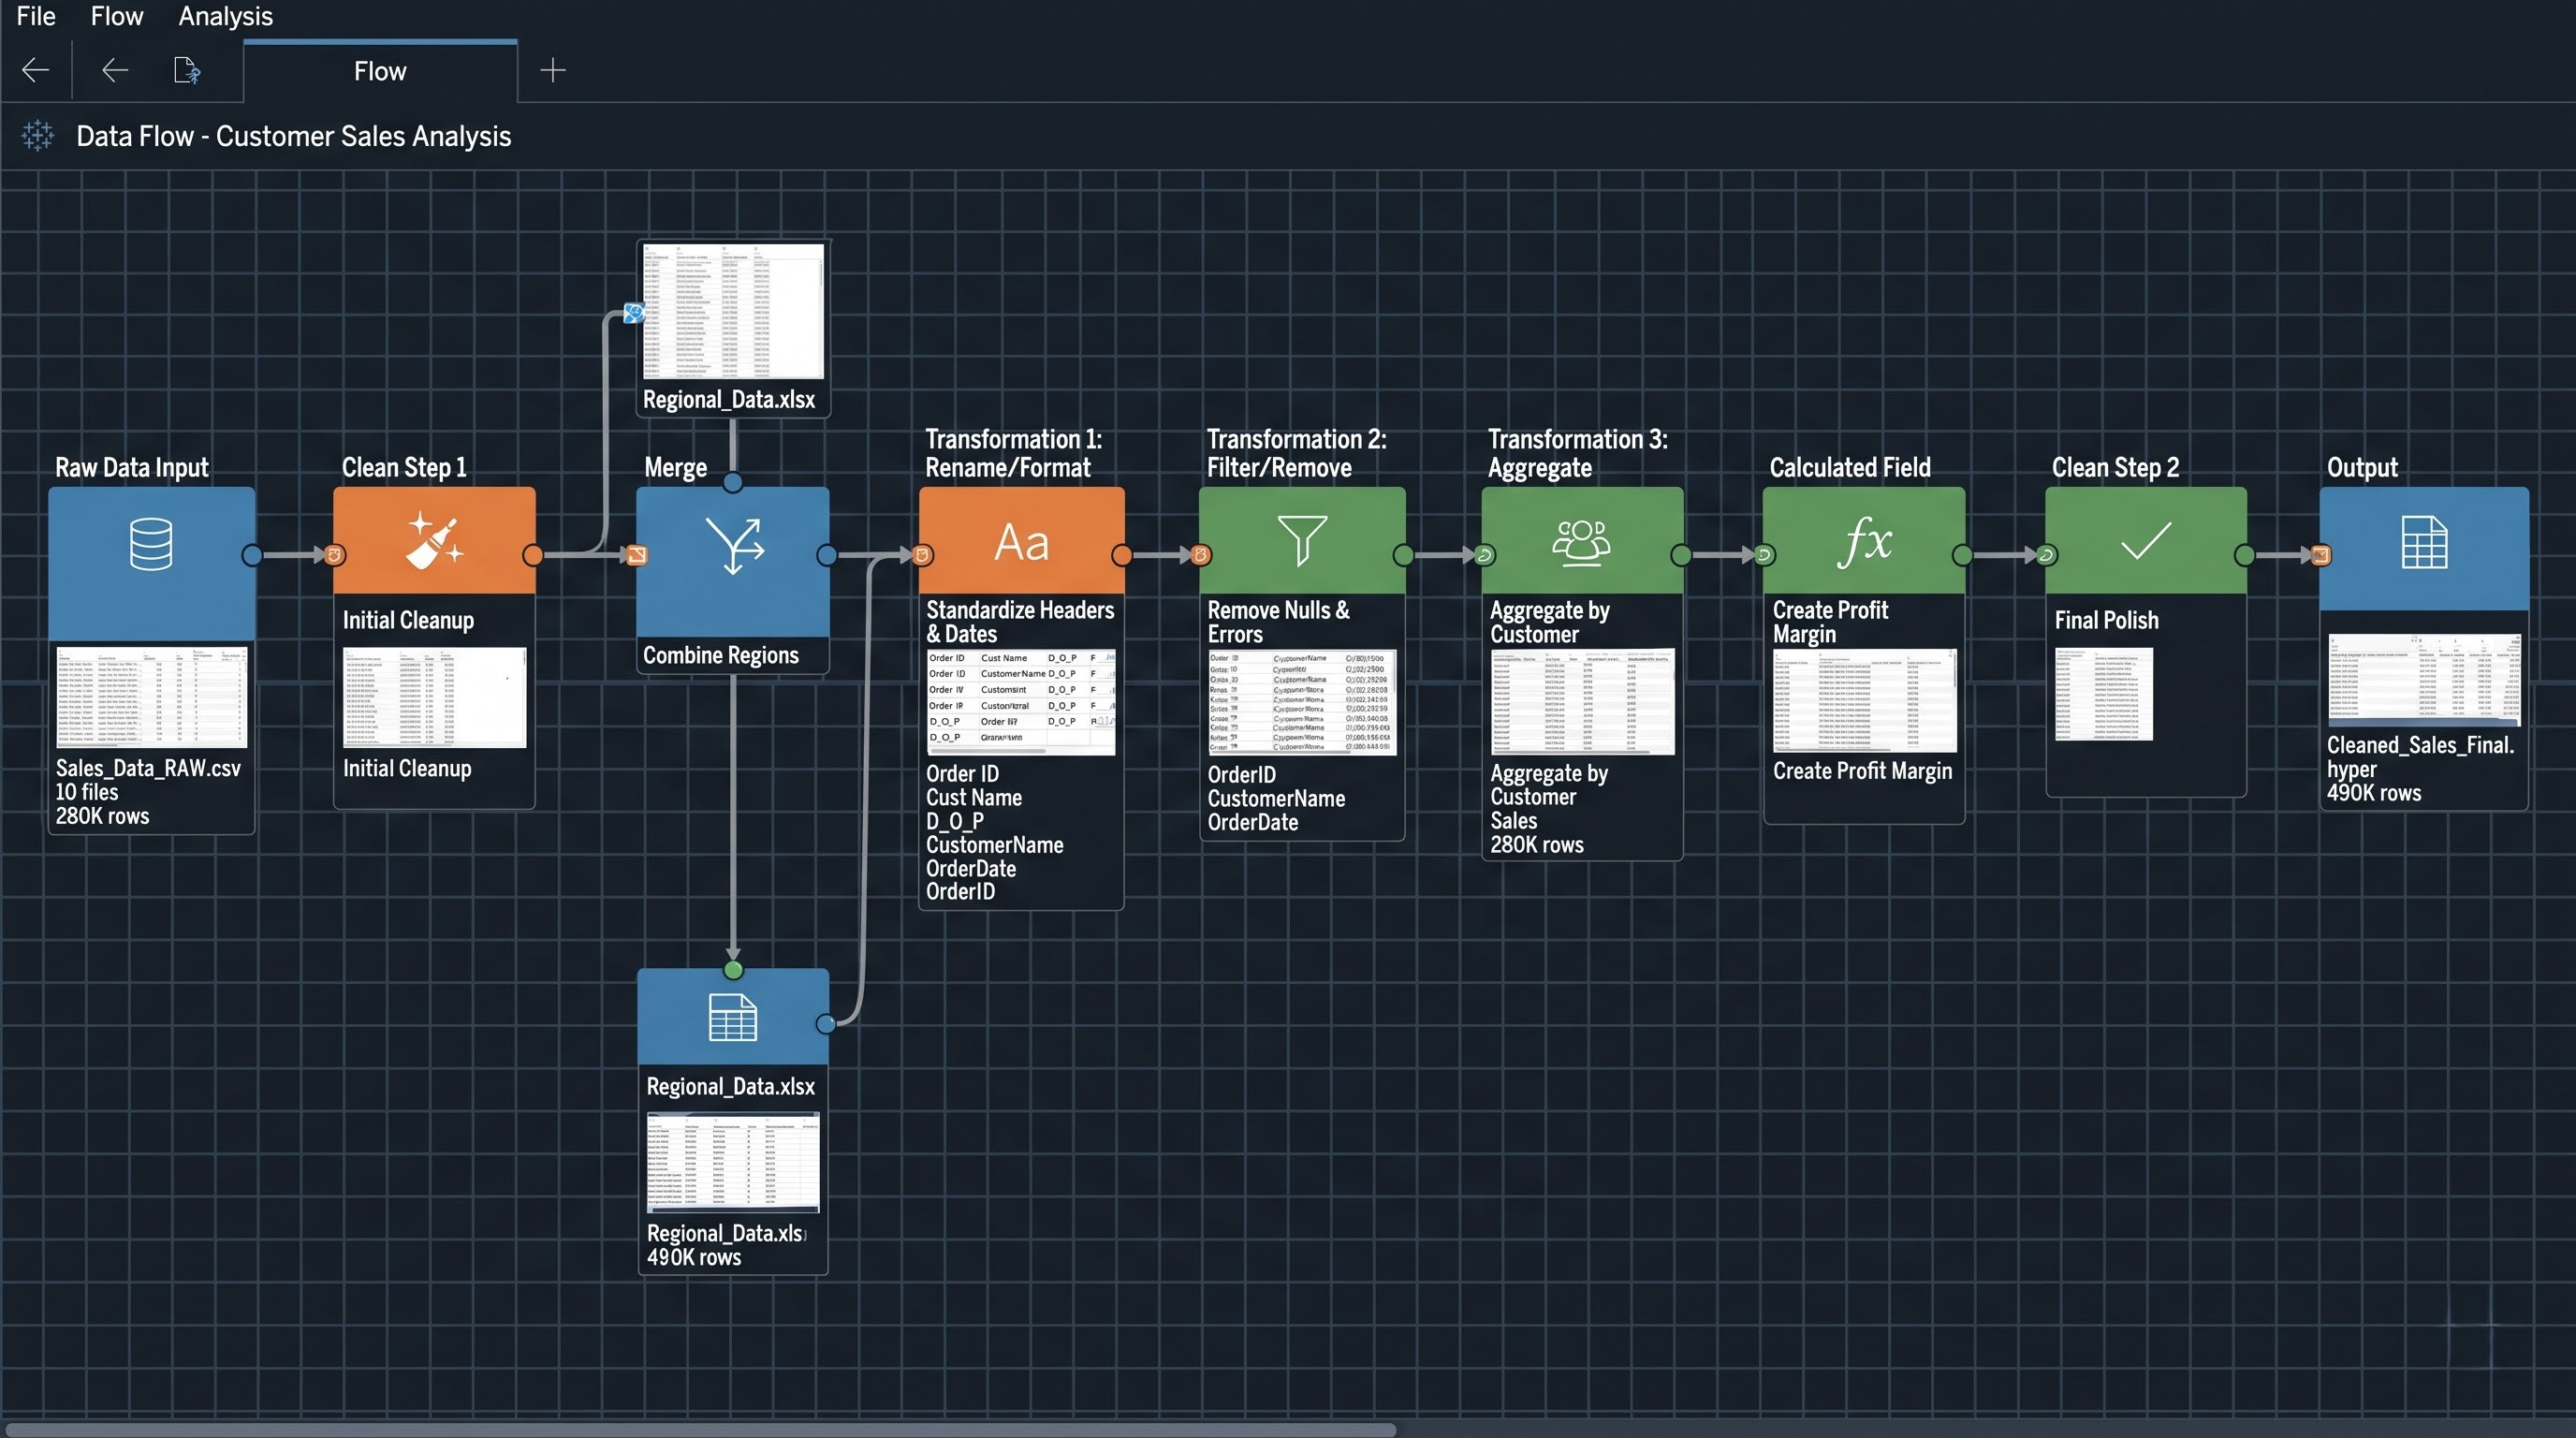
That distinction becomes particularly clear in Tableau Prep. Users can describe a data-cleaning or transformation task in natural language, and Agent can return a suggested set of steps that can be reviewed and applied to the flow. Tableau says Agent can help with tasks such as cleaning and shaping data, creating calculations, and building multi-step preparation plans. For people learning how these workflows fit together, classes in tableau can provide a useful foundation by helping users understand the underlying preparation and analytical concepts rather than simply relying on AI to perform them.
The human remains in the loop. The proposed changes can be reviewed, edited, applied, or undone. That makes the workflow more practical than simply asking an AI model to “clean my data” and trusting whatever comes back. The same principle applies to calculations and visualizations. Agent can help produce the technical output, but the user still has to determine whether the result is appropriate. That distinction—assistance rather than blind automation—is central to understanding Tableau Agent.
The AI Can Enter the Workflow Before the Dashboard
Dashboards tend to receive most of the attention because they are what business users see. But much of the difficult work happens earlier. Data often arrives with inconsistent formats, unclear field names, missing values, duplicated records, awkward structures, or fields that need to be reshaped before analysis can begin.
Tableau Agent in Prep is designed to help with some of this preparation through natural-language instructions. Users can describe a transformation, review the proposed steps, and apply them to their flow. Tableau's documentation notes that Agent can perform both single actions and multi-step plans, with a current maximum of 10 steps in a plan.
Imagine an analyst receiving a transaction dataset with a combined field containing product, date, category, and price information. Instead of manually searching through every preparation operation, the analyst can describe how the information needs to be separated and structured.
The agent can suggest the sequence.
The analyst reviews it.
The flow is updated.
This does not eliminate the need to understand the data. It reduces some of the mechanical effort required to prepare it. And that distinction matters.
AI can make data preparation faster. It cannot decide whether the resulting data represents the business correctly. That responsibility still belongs to the person working with it.
Calculations Become Easier to Create—and Easier to Question
Calculations are another area where Tableau Agent can reduce friction. For someone new to Tableau, creating a calculated field can mean remembering syntax, understanding available functions, and figuring out how different fields should interact.
Agent can translate a natural-language description into a suggested calculation and explain what the calculation does. Users can review the suggested formula, edit it, and then add it to the analysis. That can remove a common barrier for newer users. But there is a more important lesson here. A calculation can be technically correct and still be wrong for the business.
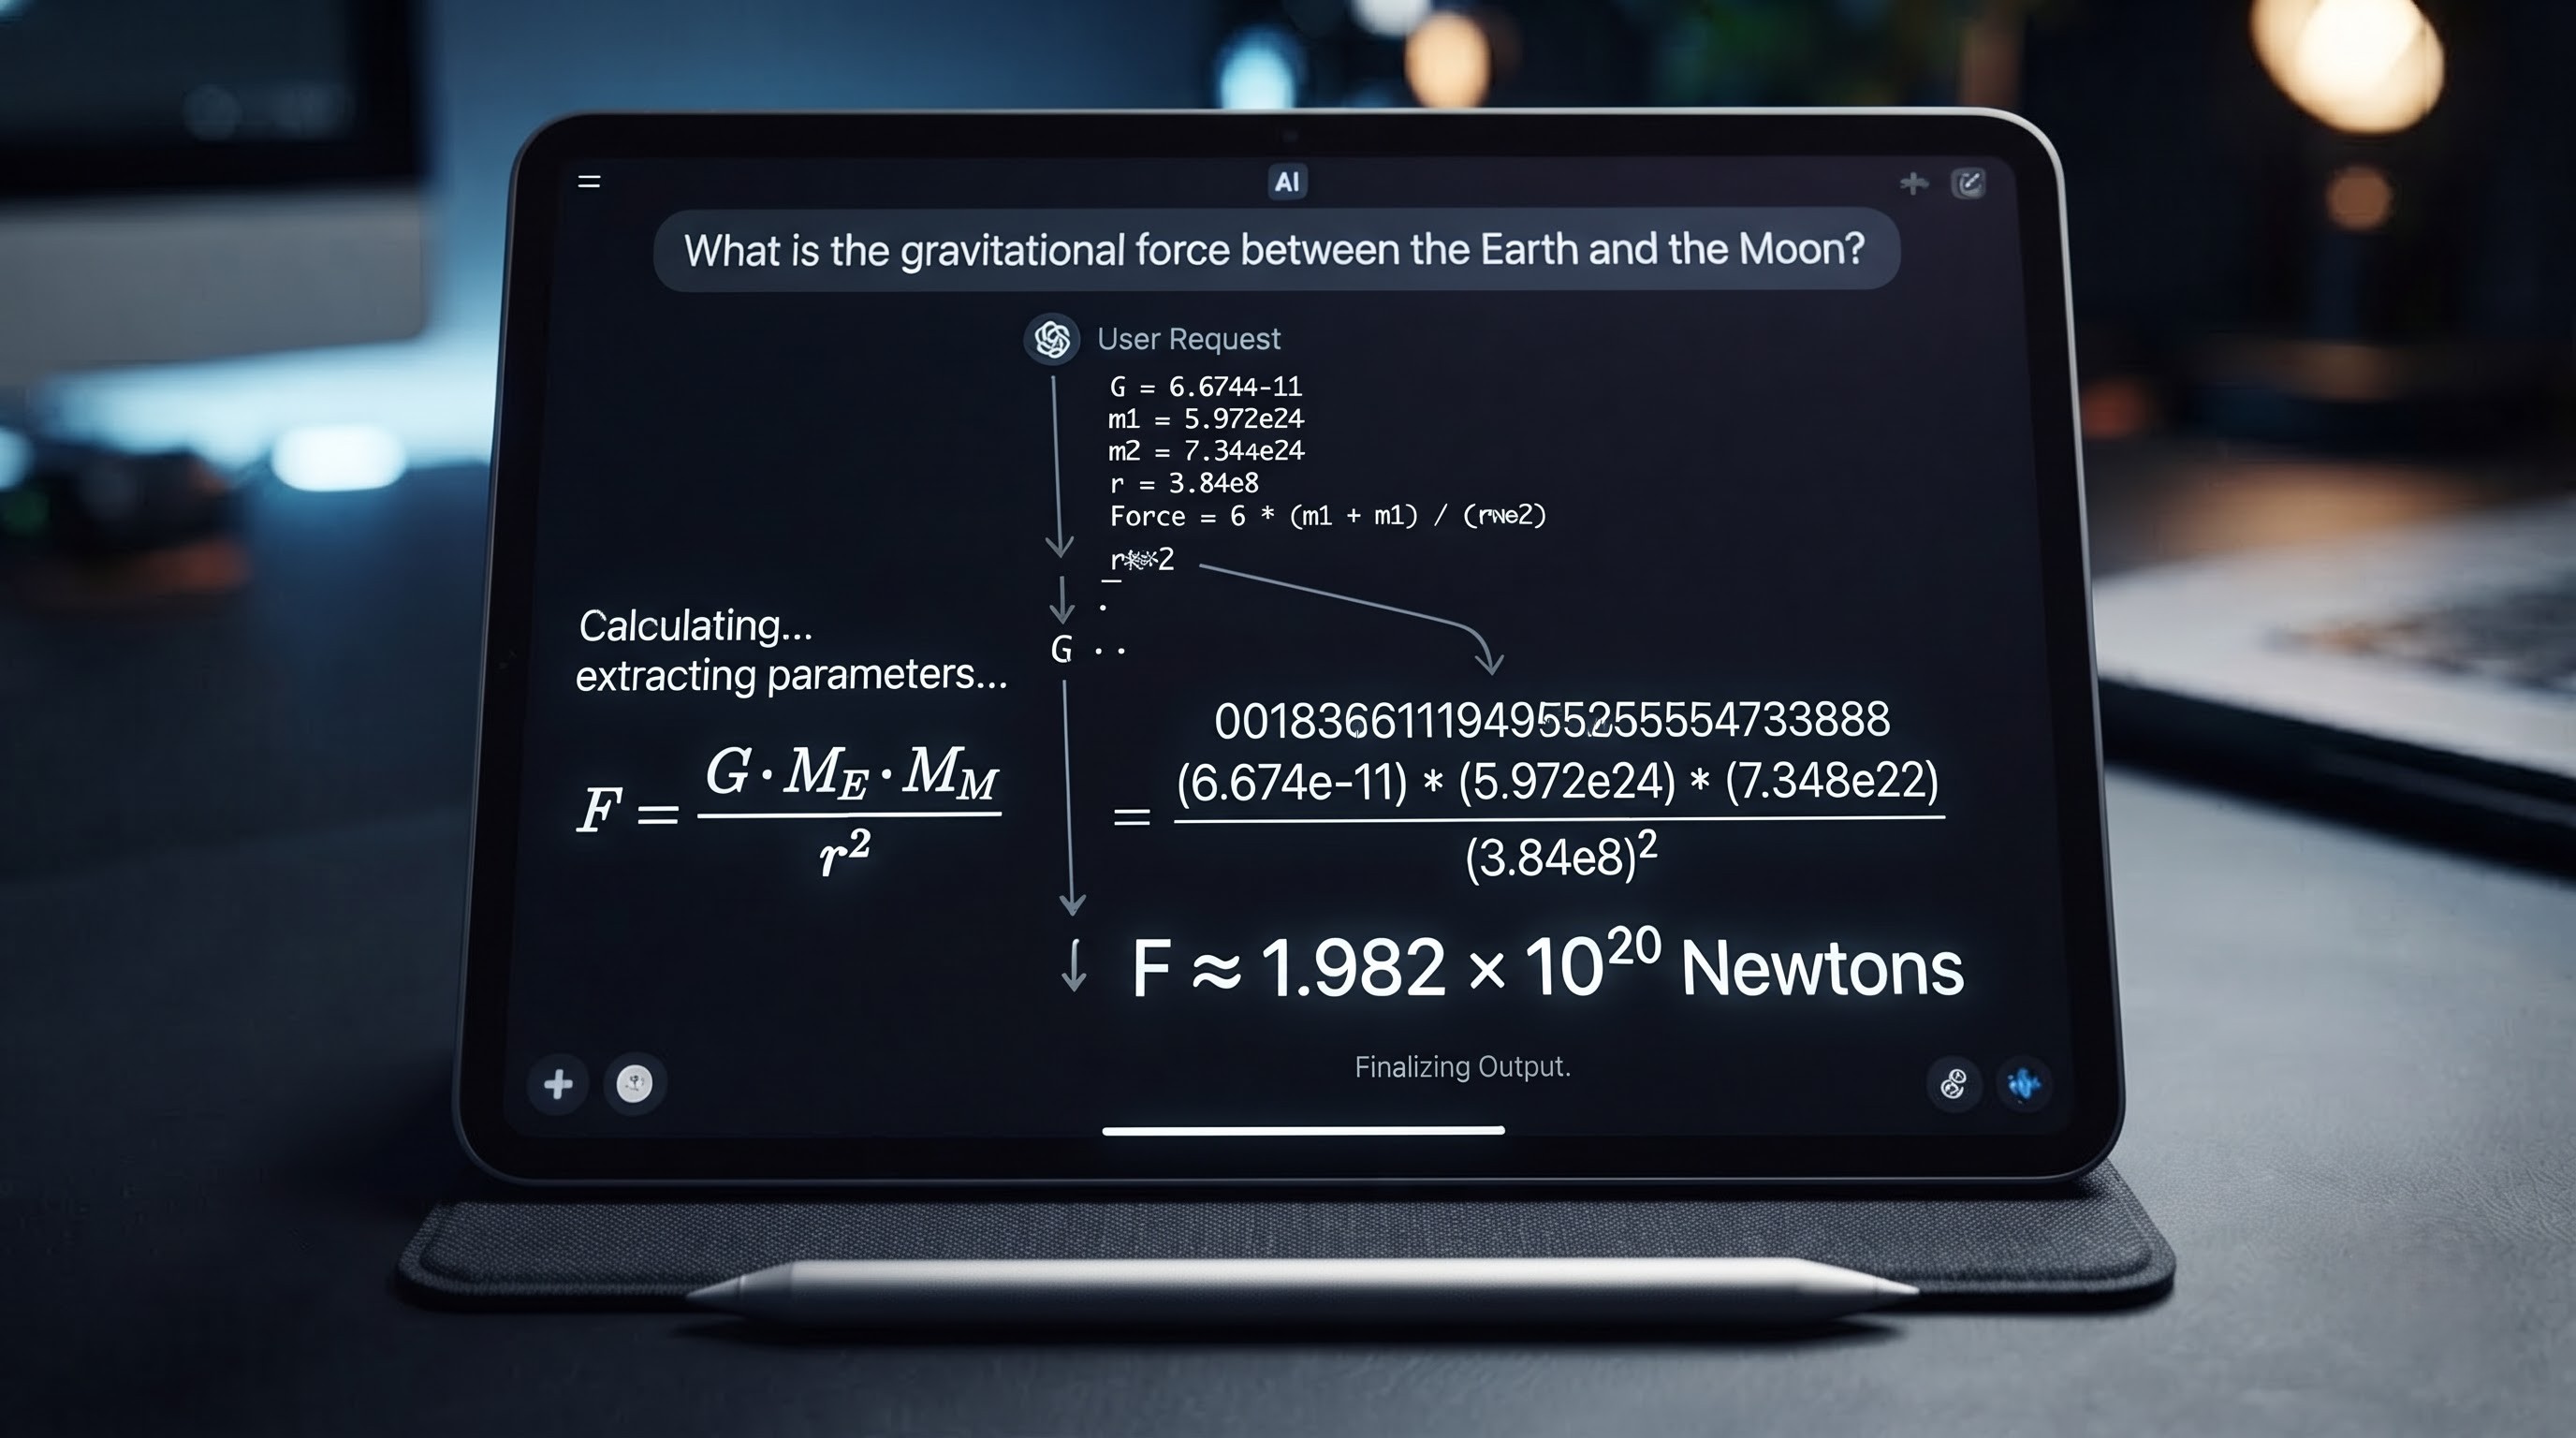
Suppose an organization uses the term “customer growth” to mean the increase in active customers compared with the previous quarter. An AI-generated calculation based simply on customer counts may produce a valid number while missing that internal definition.The formula may work. The metric may still be wrong. That is why Tableau expertise does not disappear when AI can write calculations. Instead, expertise moves upward.
It becomes less about:
“Do I know the syntax?”
and more about:
“Is this calculation actually answering the right business question?”
That is a much harder question—and a much more valuable one.
Natural Language Can Change the Way People Explore Data
The most noticeable change for many users may happen when they start exploring a dataset.Traditional Tableau gives users a visual environment for building and manipulating views. Users select fields, change chart types, add filters, compare measures, and investigate patterns.
Tableau Agent adds another route into that process.
A user might start with:
“Show revenue by region over time.”
Then continue:
“Compare it with the previous year.”
Then:
“Which region contributed most to the decline?”
Then:
“Break that region down by product category.”
The analysis becomes iterative.
Ask → inspect → refine → ask again.
Tableau Agent can currently support visualization creation, chart selection for supported chart types, time-series analysis, filtering, sorting, and calculation creation. That does not mean every analytical question can be solved perfectly through conversation.
It means the user has another way to get into the analysis. For people who understand what they want to investigate but are less comfortable navigating every Tableau feature, that can lower the barrier to self-service analytics.
But AI Does Not Know Why the Business Question Matters
Q:) What Changed ? or "Why does it matter?"
These two questions address fundamentally different needs. Consider a scenario where revenue grows by 12%—an outcome that initially appears encouraging. However, deeper analysis may reveal critical underlying risks:
Customer acquisition dropped by 20%.
The growth was driven almost entirely by a single account.
Heavy discounting eroded profit margins despite higher top-line numbers.
Overall gains masked the loss of the company's most valuable customer segment.
While visual charts highlight trends and AI helps uncover them, only business context determines whether a pattern holds real significance. This distinction highlights why Tableau Agent cannot substitute for human analytical judgment; as Tableau's own documentation notes, AI boundaries remain around data modeling, data-source selection, broader consulting tasks, and specific authoring functions. AI streamlines the technical mechanics, but defining and understanding the underlying problem still requires human oversight.
The Dashboard Is Becoming More Conversational
For a long time, a dashboard was essentially a destination. You opened it, looked at the charts, applied filters, and interpreted what you saw. That model is beginning to change. Tableau Agent in Dashboards is currently documented as a beta capability that can provide dashboard overviews, summarize insights from visualizations, and allow users to ask questions about the underlying data.
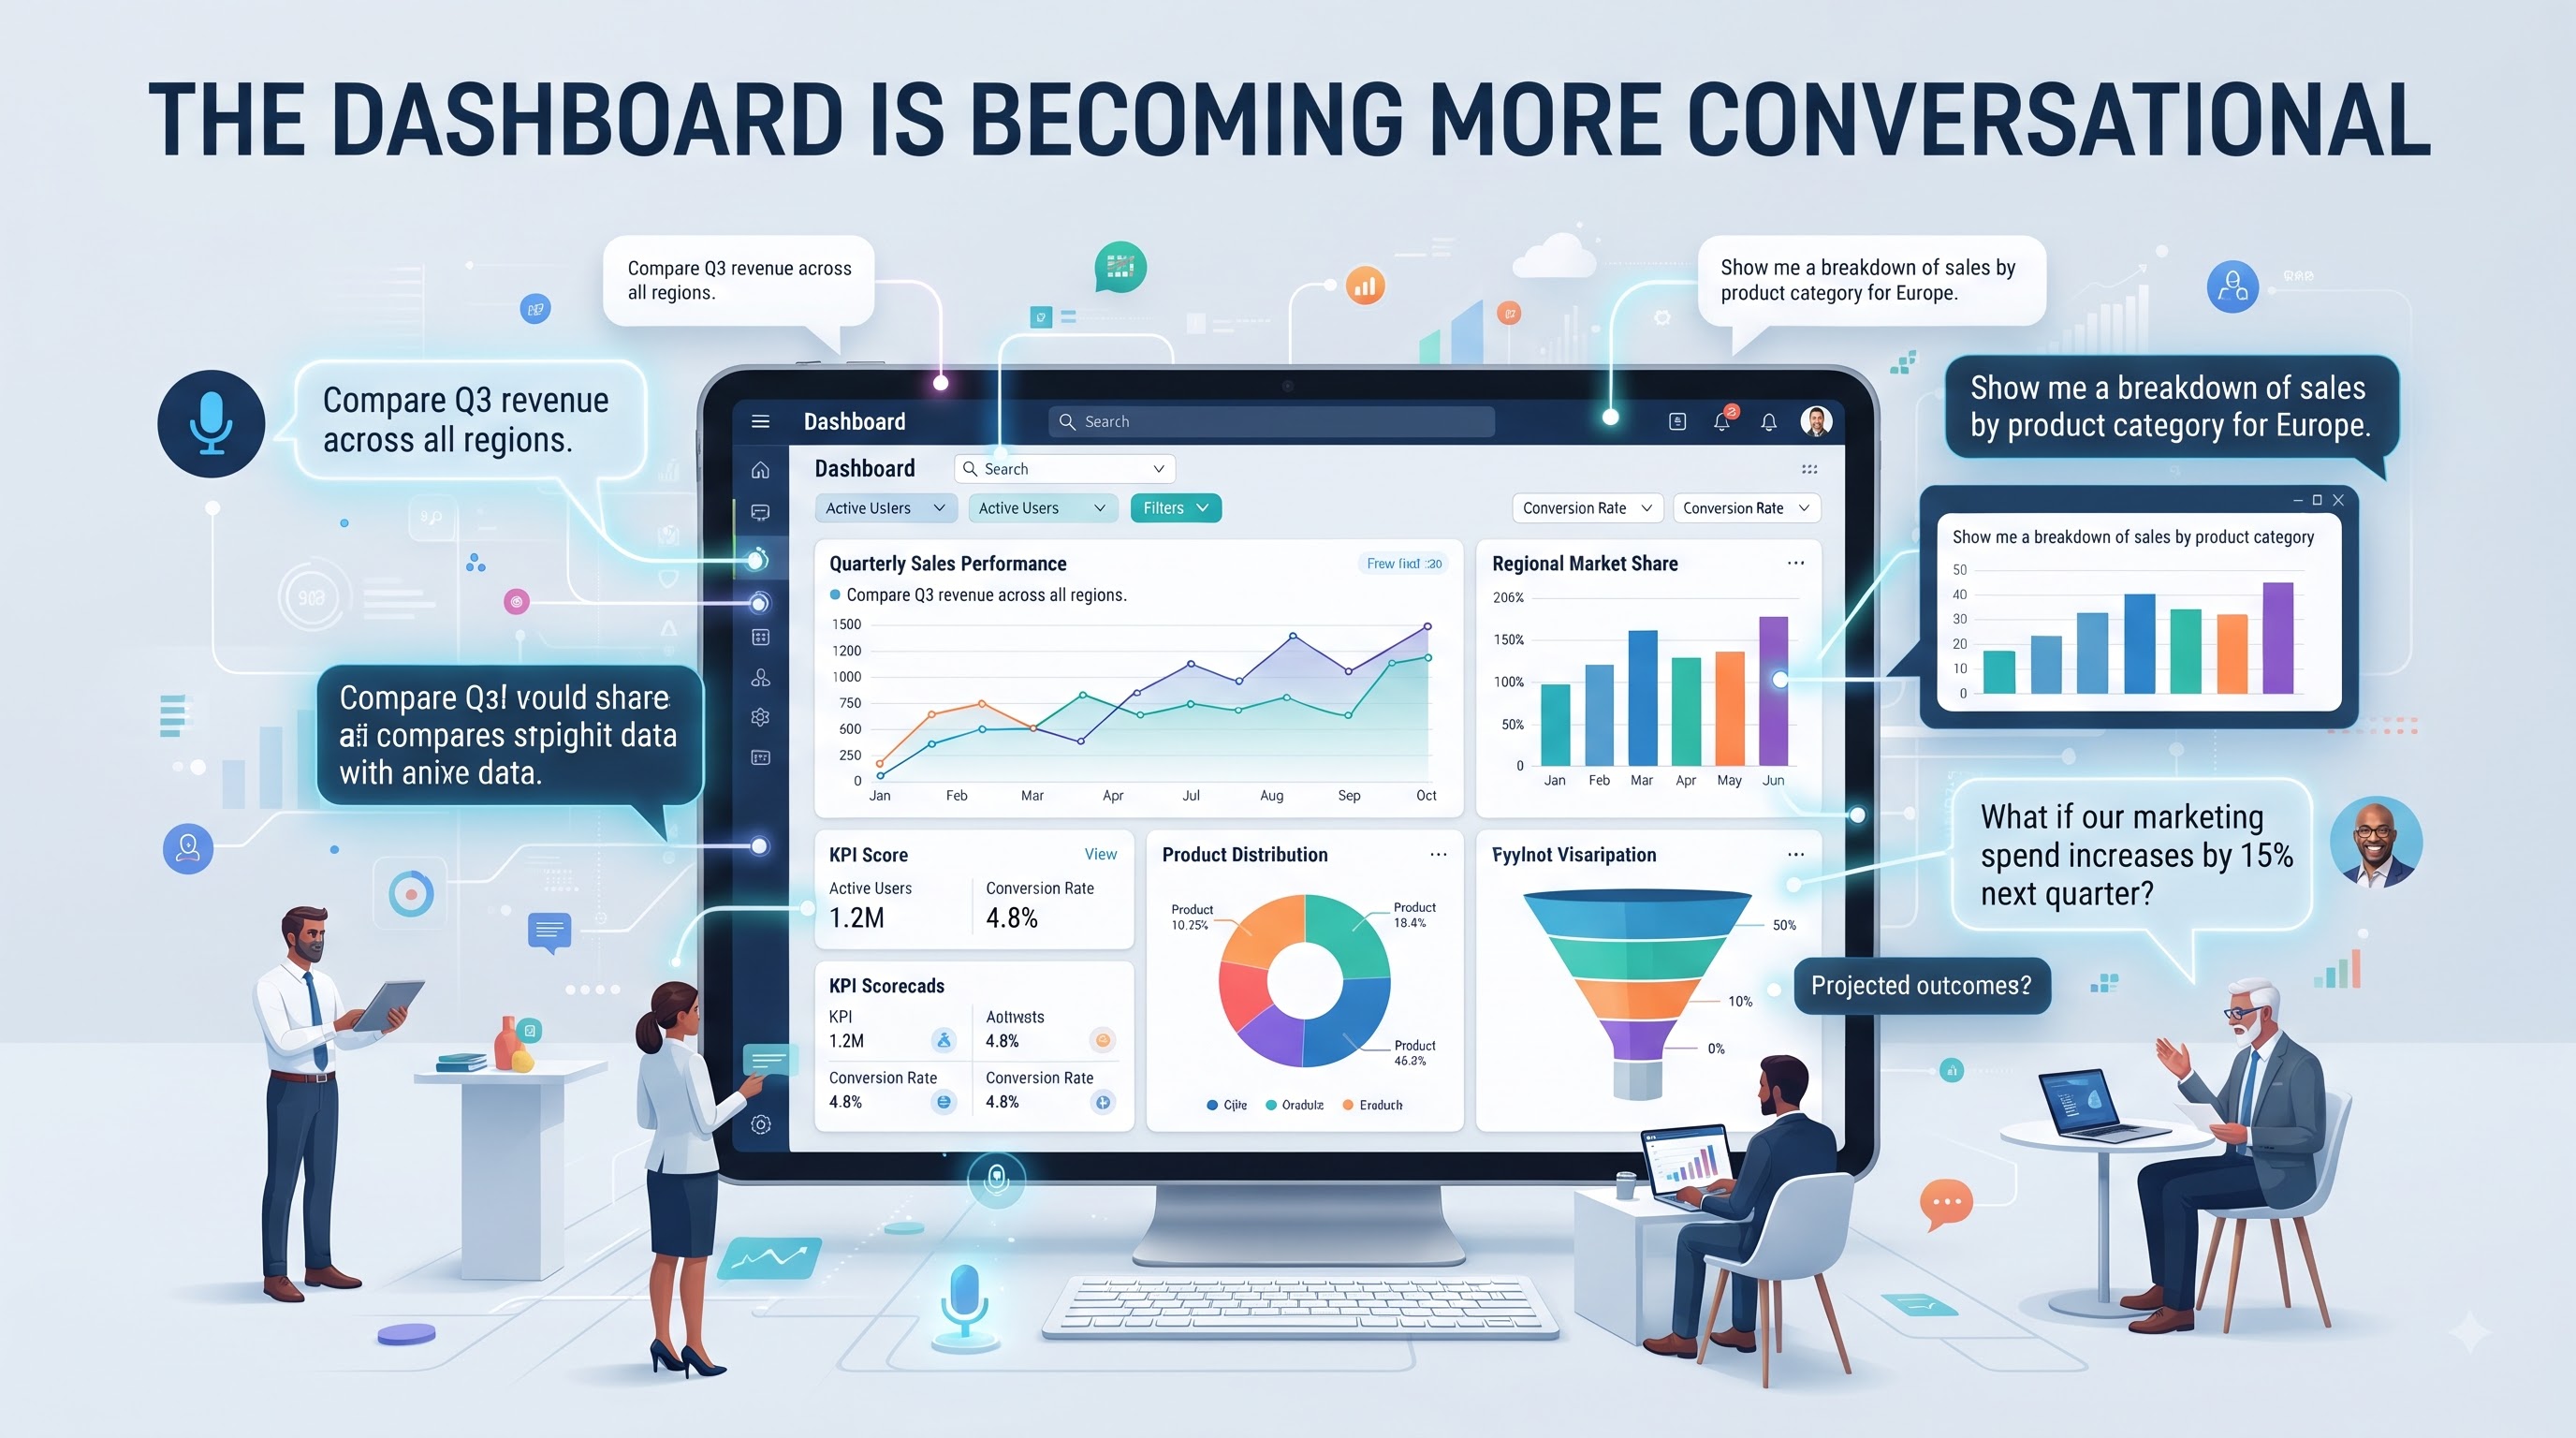
This introduces a different relationship between the dashboard and its audience. Instead of expecting every user to scan every visualization, AI can help point attention toward useful information. A sales leader might open a dashboard and immediately want to know what changed, while an operations manager might want to understand where performance has deteriorated.
A finance executive might want to investigate an unexpected movement in a metric without manually working through every chart. For users exploring these newer capabilities, a tableau course online can be useful when it combines the platform's fundamentals with practical analytics and AI-assisted workflows. Rather than treating the dashboard as a fixed report, users can increasingly treat it as a starting point for investigation. That is a subtle but meaningful shift.
AI Does Not Make the Dashboard Obsolete
There is a temptation to frame this as a battle between dashboards and AI. That misses what makes BI useful in the first place.
A written explanation can tell you that revenue increased.
A visualization can show you how that increase happened.
A trend line can reveal the timing.
A regional map can show where it happened.
A distribution can reveal whether the result was broad or driven by a small number of observations.
Visual analytics still provides something that conversational answers do not always replace: context. The more likely future is not:
Dashboard vs. AI
but:
Dashboard + AI
The dashboard provides the visual evidence. AI helps users interrogate that evidence. The user decides what deserves attention. That combination could make BI more useful without removing the visual layer that made Tableau successful in the first place.
Better AI Makes Better Data More Important
Here is one of the less obvious consequences of AI-powered analytics:
The easier it becomes to ask questions, the more important it becomes to have trustworthy data underneath those questions.
If a field is poorly named, the AI has less context. If two teams use different definitions for the same metric, a natural-language question may produce an answer that looks reasonable but does not match the organization's intended definition. If the data contains inconsistent values, AI cannot simply wish those problems away.
Tableau recommends using clean data, descriptive field names, and useful context to improve the quality of interactions with Agent. This makes areas such as data governance, metadata, lineage, and certified data sources increasingly important.
Consider the difference between two fields:
Revenue
and
Monthly recognized revenue excluding one-time enterprise contracts
The second definition provides considerably more context. AI can work with users. In has a much better chance of interpreting the second correctly. That is why the AI era may make data management more important, not less.
The Human-in-the-Loop Is Not a Technical Detail
One of the most important ideas in Tableau Agent is the continued role of the user. In Tableau Prep, suggested changes can be reviewed before being applied. In calculations, users can inspect and edit the generated formula. Tableau also advises users to evaluate generated results rather than assuming that every output is correct.
That is not merely a safety mechanism. It reflects a broader reality about AI-assisted analytics. The system can generate an answer quickly. The user needs to decide whether the answer makes sense. This is especially important when the output influences a business decision. A wrong chart can be corrected. A wrong interpretation that reaches an executive meeting can influence budgets, forecasts, staffing, pricing, or strategy. The faster AI becomes at generating analytical outputs, the more valuable verification becomes.
Trust Has to Be Built Into AI-Powered BI
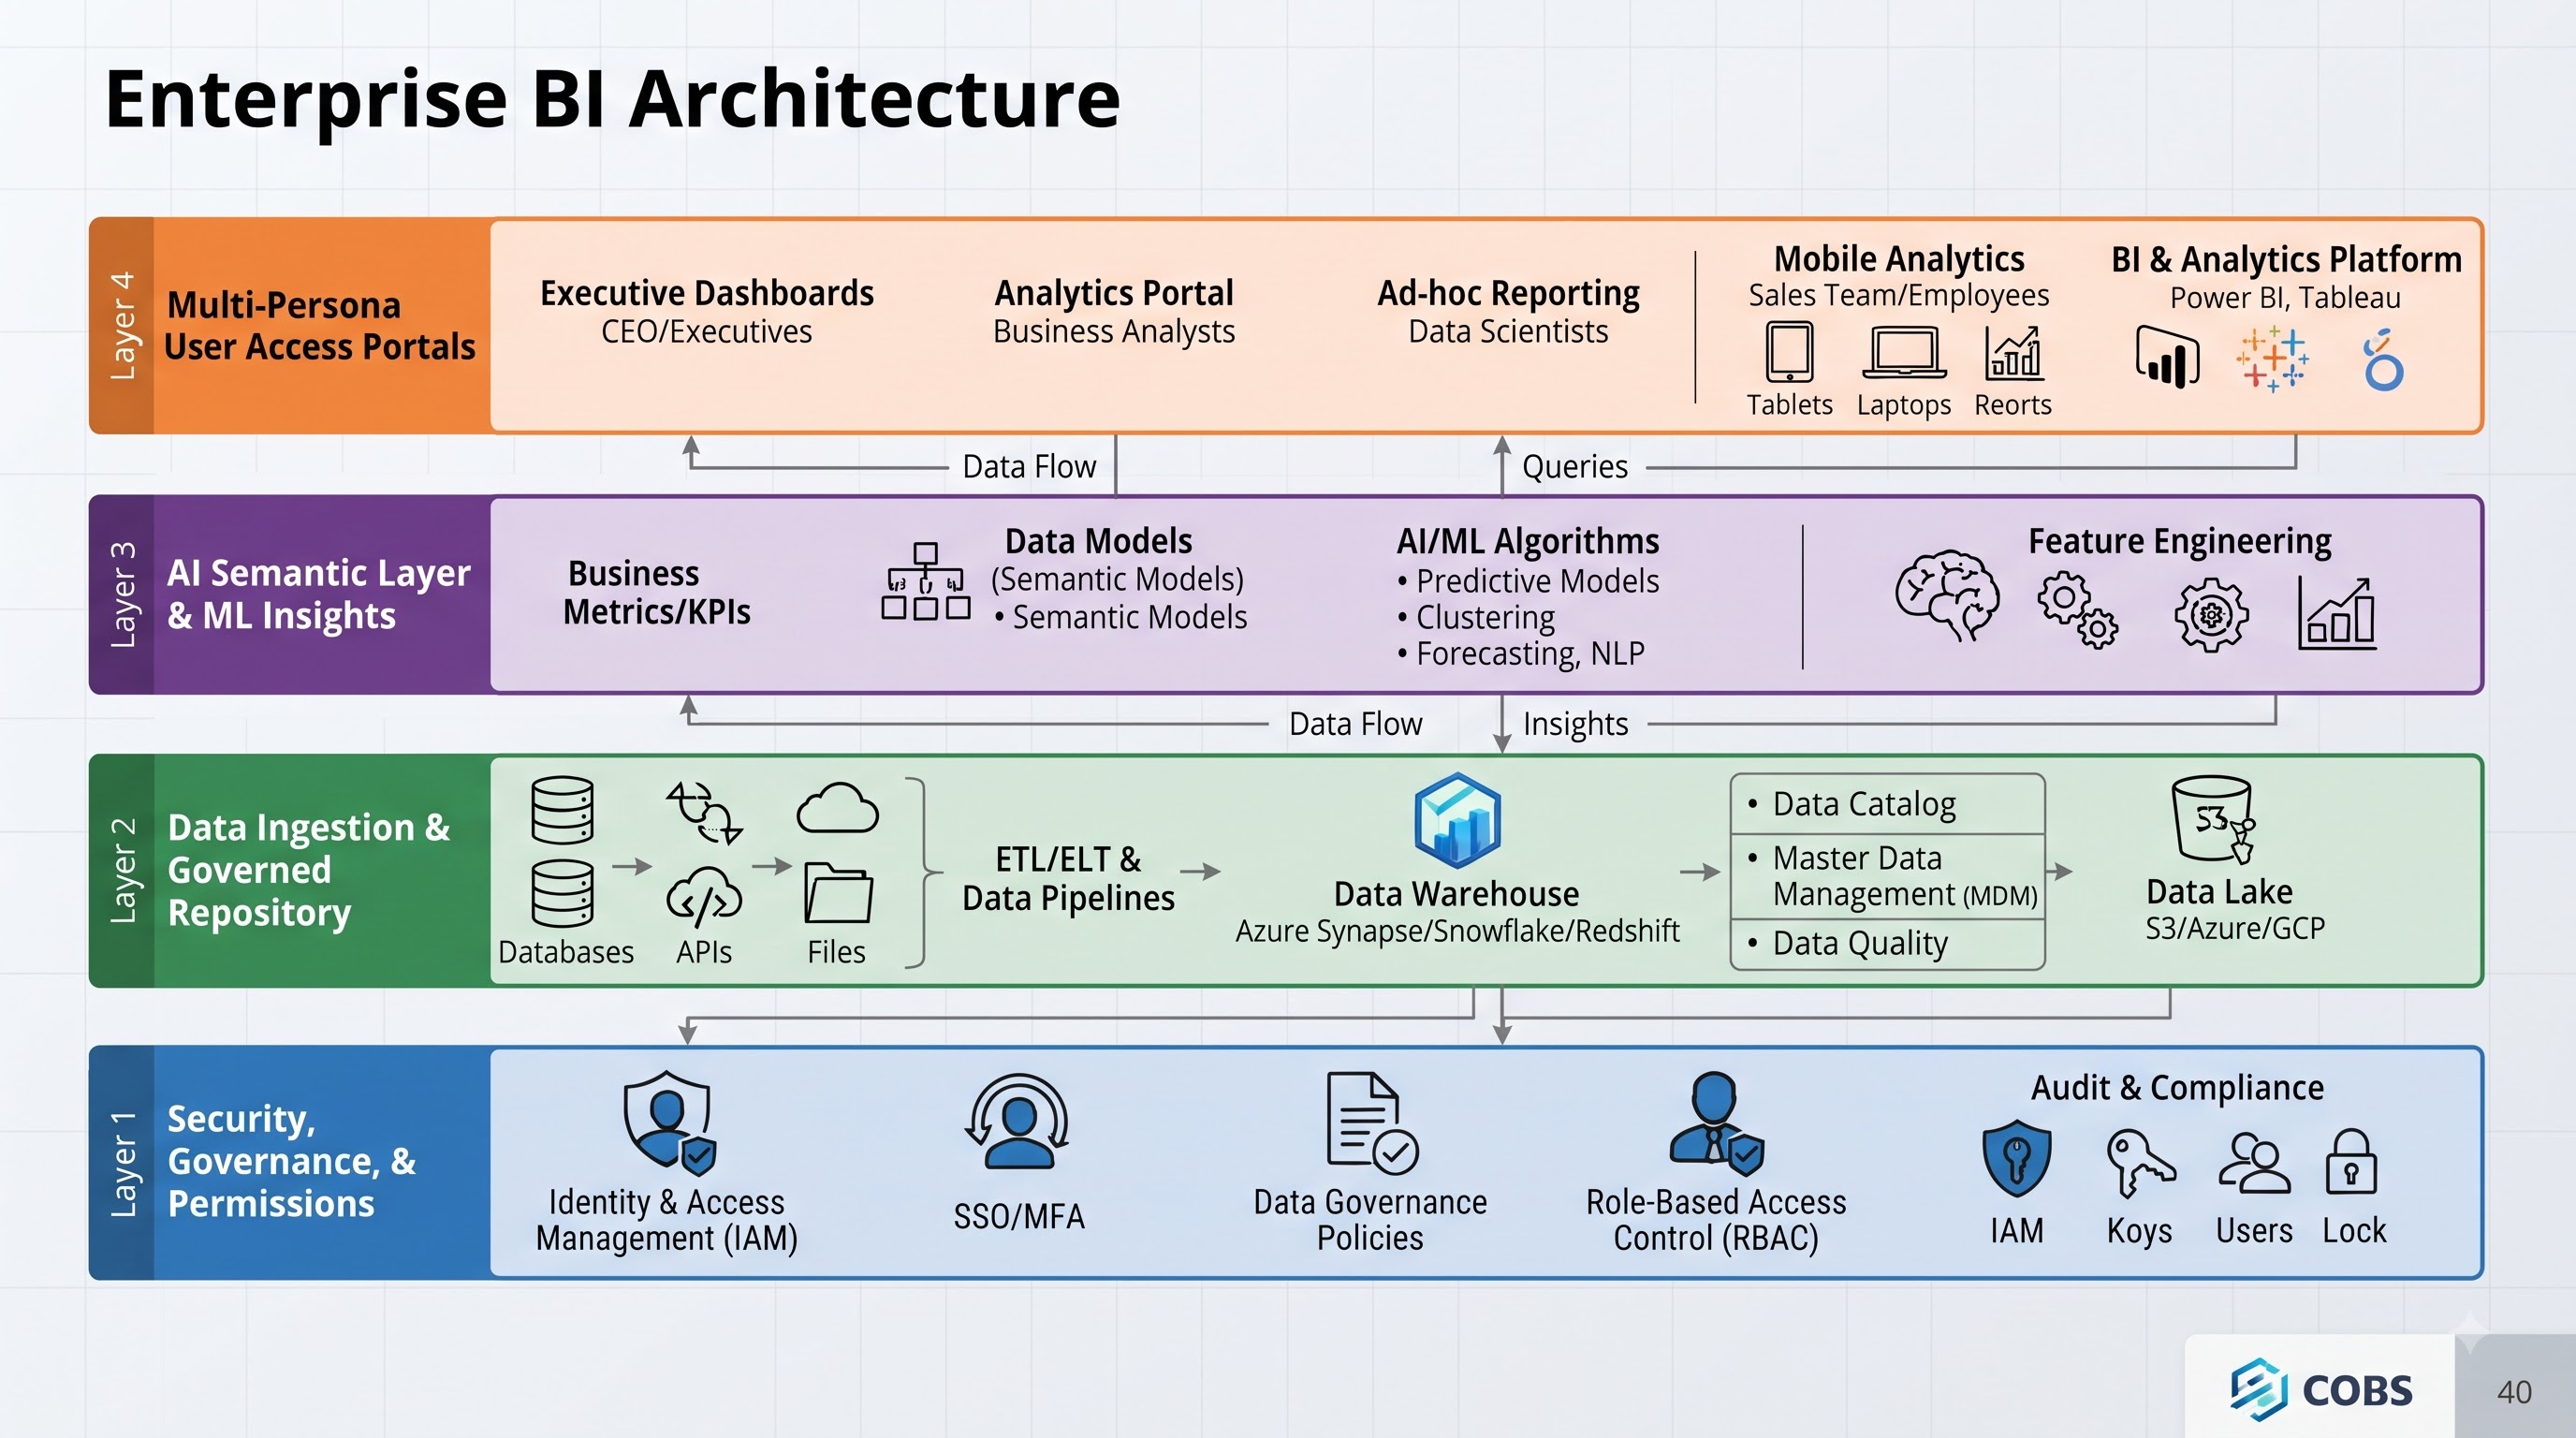
When AI begins interacting with enterprise data, trust becomes part of the architecture. Organizations need to know what information the system can access, how permissions are handled, how generated responses are produced, and whether users can work within existing governance controls.
Tableau says Tableau Agent in Tableau Cloud is built on the Einstein Trust Layer and inherits its security, governance, and trust capabilities. Tableau's documentation also states that data and conversations sent to the LLM are not saved to the LLM in the relevant Tableau Agent workflow.
For enterprises, this matters because AI cannot be judged only by how impressive its answers look.
The better questions are:
Can the user access this data?
Is the underlying source trusted?
Does the answer respect existing permissions?
Can the result be checked?
Is the metric defined consistently?
AI-powered BI has to be both useful and trustworthy. Without the second, the first becomes a liability.
What Happens to Tableau Experts?
This is probably the question that interests Tableau professionals most. If AI can create charts, write calculations, prepare data, and answer questions, what happens to the person who used to do those things? The answer is not simply “nothing changes.”
The role is likely to change. The most repetitive parts of analytics are increasingly exposed to automation. That means professionals can spend less time on mechanical tasks and more time on the decisions surrounding those tasks. Instead of building every basic visualization manually, an analyst can focus on whether the visualization answers the right question. Instead of spending most of the day writing repetitive calculations, they can spend more time defining and validating business metrics.
Instead of manually searching through dozens of charts, they can focus on explaining why a pattern matters. The value moves from producing the view to designing the thinking behind the view. That is not the disappearance of expertise. It is a change in where expertise matters.
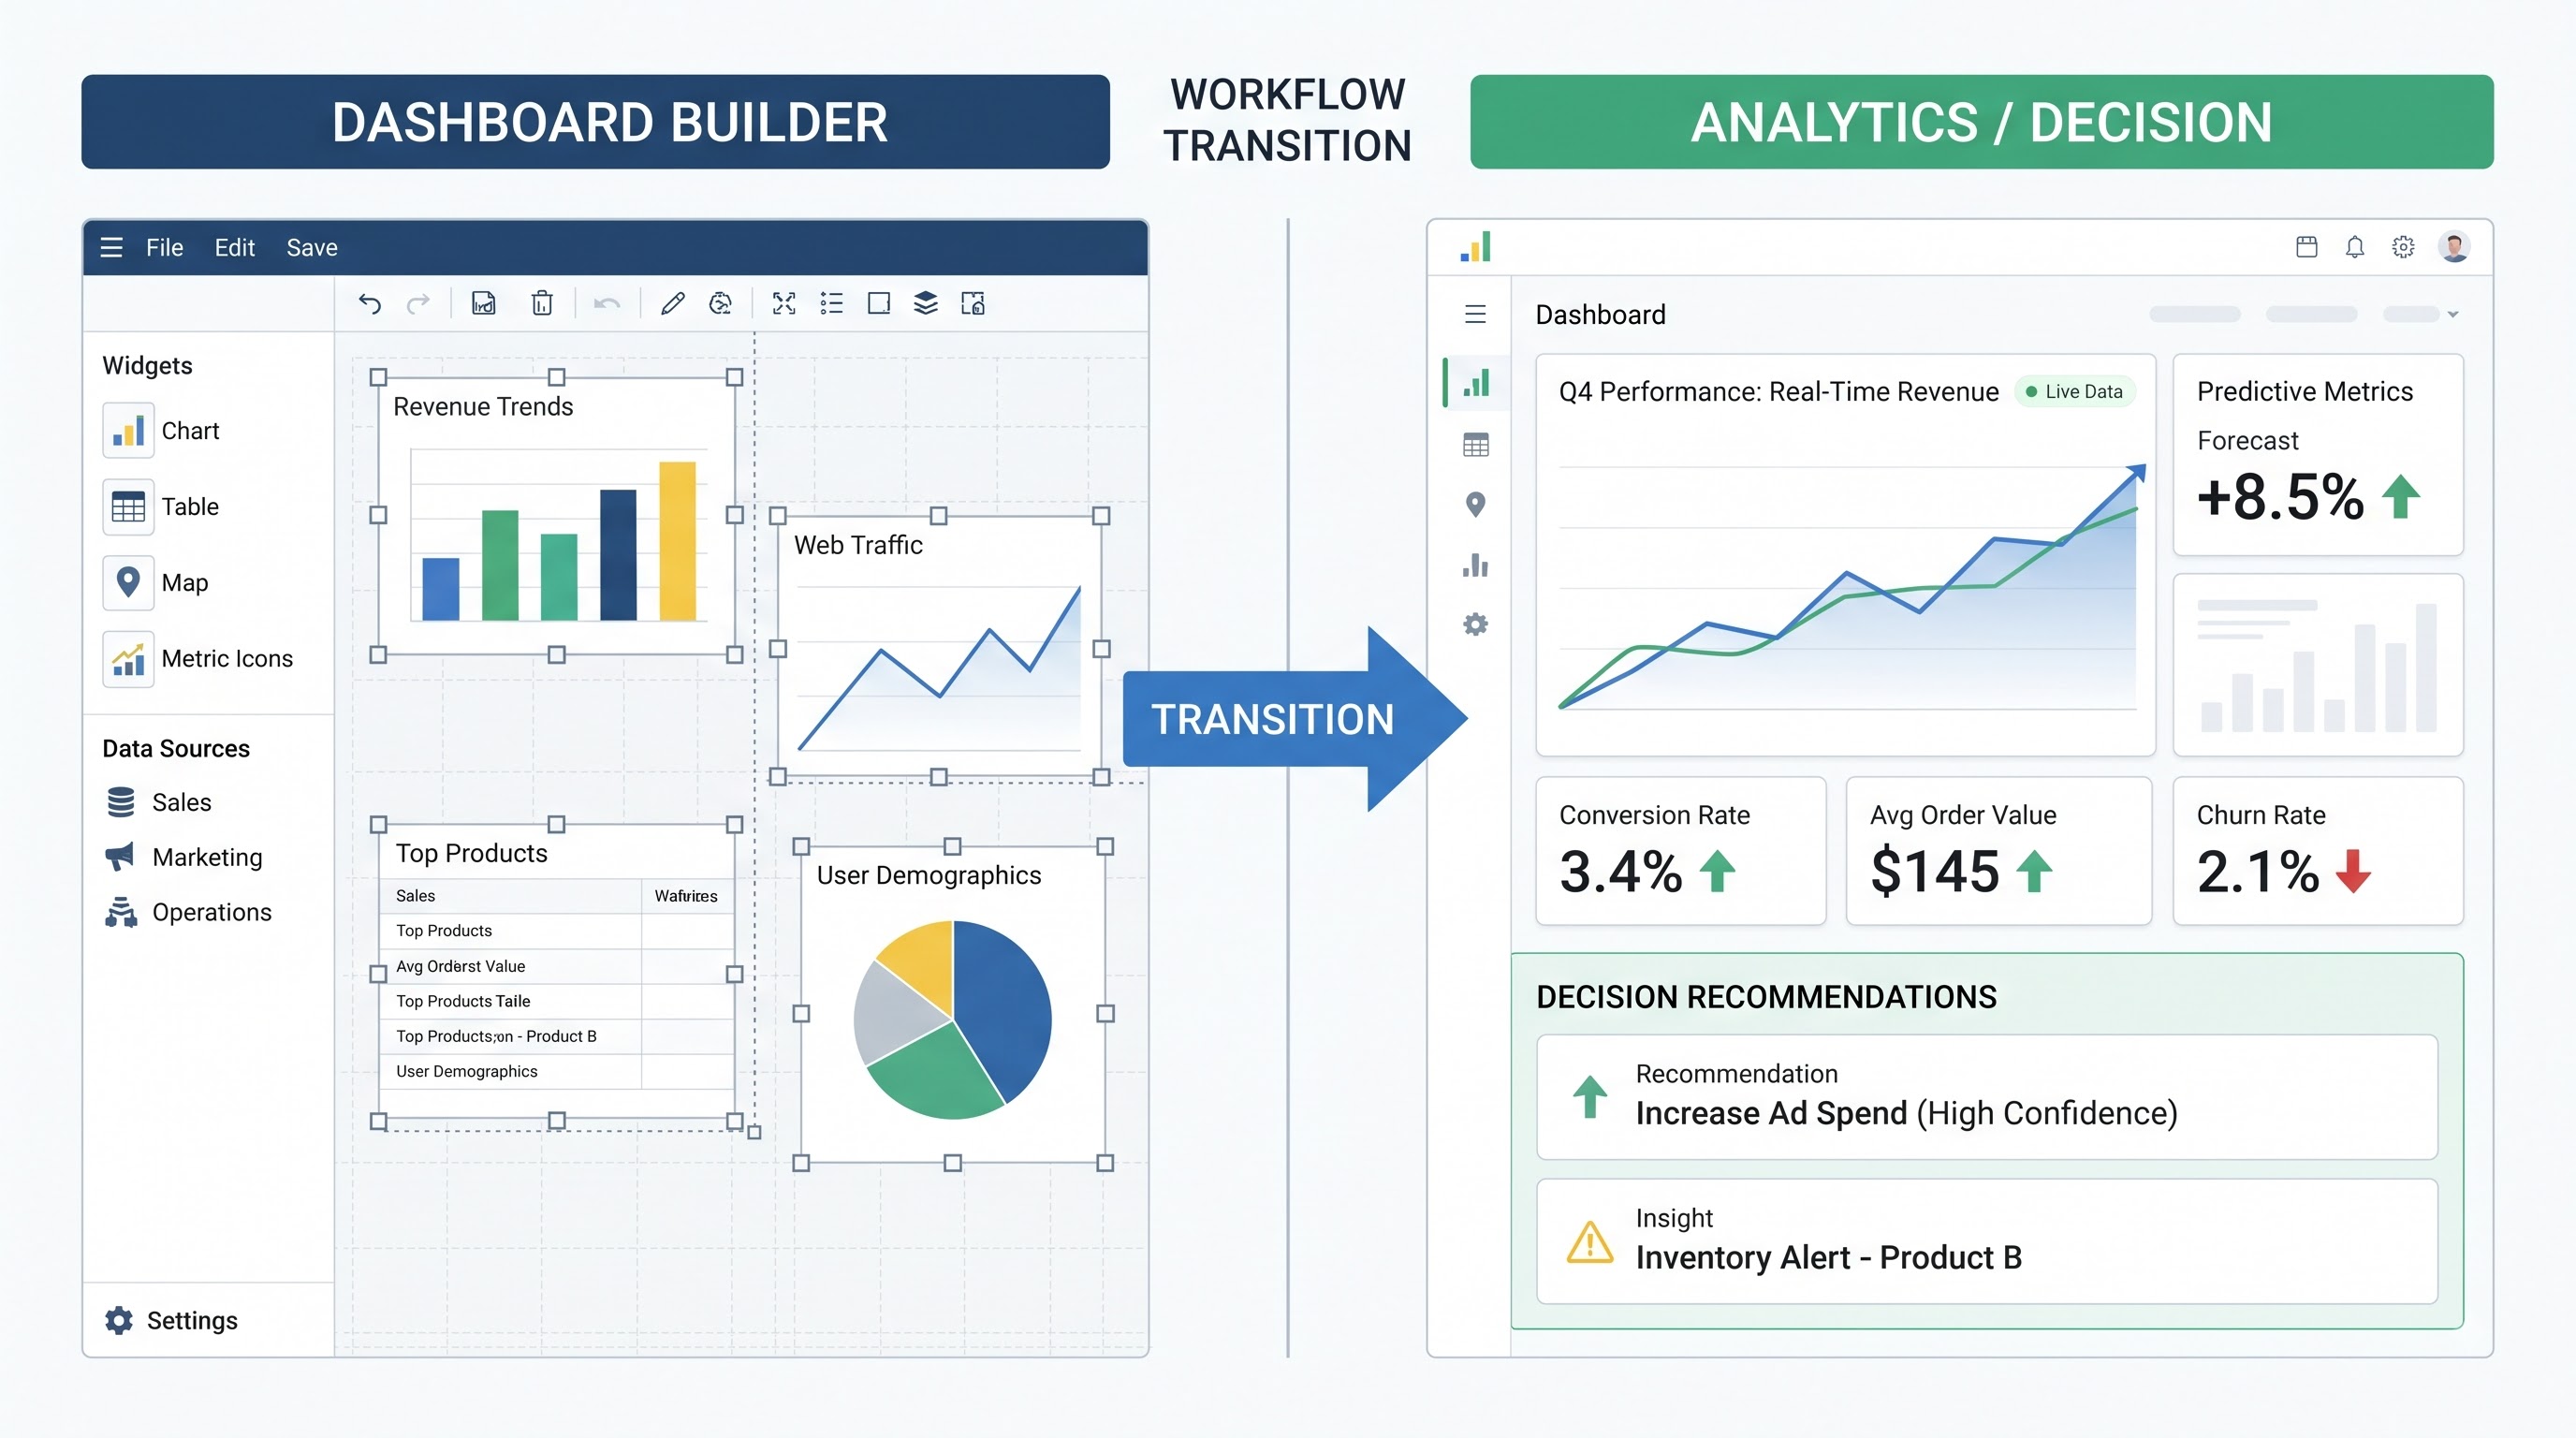
Tableau Skills Are Moving Up the Stack
This shift is also changing what it means to become a strong Tableau professional. Learning Tableau's interface still matters. Professionals need to understand dimensions, measures, relationships, filters, calculations, dashboards, parameters, and visualization principles. But these skills are increasingly just one part of the broader role. A future-ready Tableau professional needs to understand the full path from data preparation and modeling to visualization, AI-assisted analysis, validation, and business decisions.
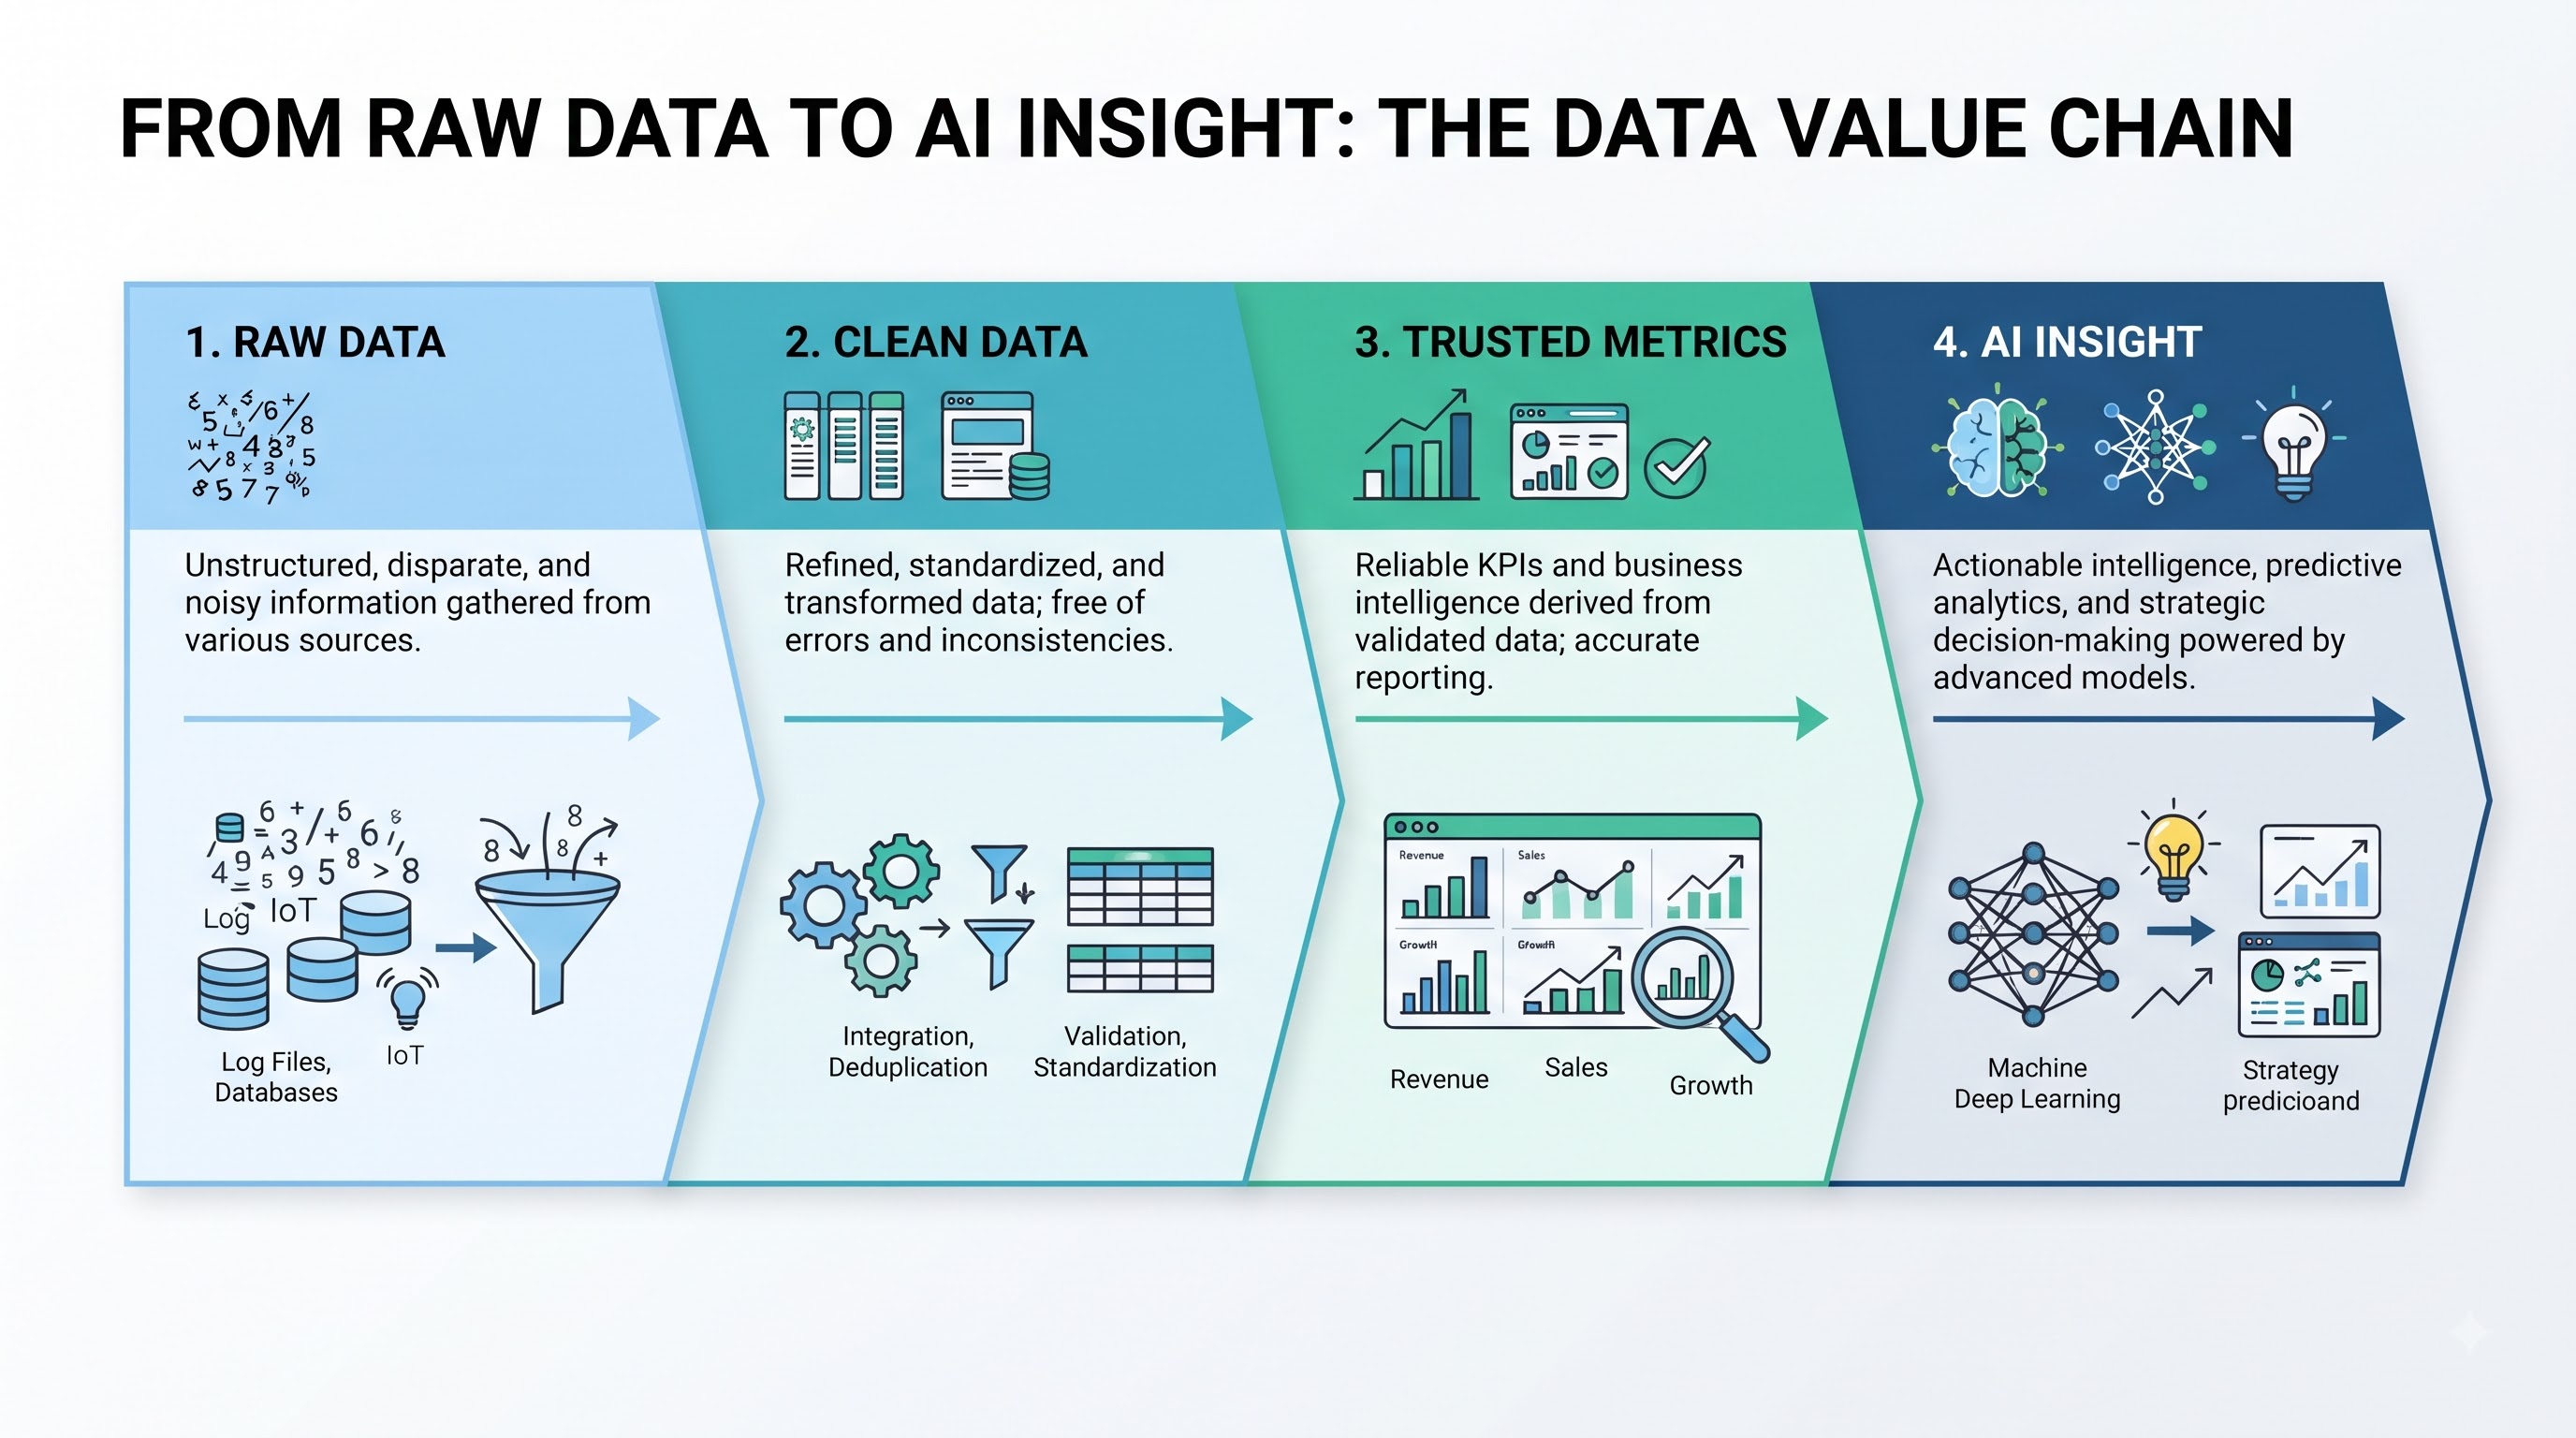
That means SQL matters. Data modeling matters. Data quality matters. Understanding business metrics matters. AI literacy matters, and so does analytical communication. If AI can help someone create a basic bar chart, simply knowing how to build that chart becomes a weaker differentiator. Knowing when the chart is appropriate, what it should compare, and what decision it should support becomes far more valuable.
For people building a career in this field, tableau developer training can be most useful when it goes beyond button-by-button software instruction and includes real datasets, data modeling, calculations, dashboard design, and business problem-solving. The goal should not simply be to learn where every feature is. It should be to understand what to do with the data and why it matters.
From Dashboard Builder to Analytical Storyteller
A dashboard can contain twenty charts and still fail. Why?
Because more information does not necessarily mean more understanding. Good BI requires judgment about hierarchy.
What should users see first?
Which number deserves attention?
Which trend requires investigation?
What comparison provides context?
What action should follow?
As AI makes it easier to generate visualizations, those questions become more important. The professional advantage may shift from building more dashboards to building better analytical experiences. That includes storytelling, visual hierarchy, metric design, business context, and communication. The Tableau expert becomes less like someone assembling charts and more like someone designing the path from information to understanding.
The Real Competition Is Not Human vs. AI
The question “Will AI replace Tableau analysts?” is attractive because it sounds dramatic. This may be the wrong question.
A better one is:
What can a Tableau analyst accomplish when AI handles more of the repetitive work?
Consider two analysts. One spends most of the day cleaning data, creating routine calculations, producing standard charts, and answering repetitive requests. The other uses AI to accelerate those tasks and spends more time validating metrics, understanding business problems, investigating unusual patterns, designing analytical models, and communicating recommendations.
Both are using Tableau. But their value to the organization is very different. The technology has not removed the analyst. It has changed how the analyst spends time. That is the more realistic way to think about AI's impact on BI.
The Bigger Picture: Tableau Is Moving Toward a More Conversational BI Experience
Tableau Agent is part of a broader direction for Tableau and the BI market. Tableau's current product strategy increasingly connects data preparation, analytics, AI, and action. At Tableau Conference 2026, the company described a broader move toward agentic analytics and said data teams have an opportunity to move beyond simply building visualizations and become “architects of knowledge.”
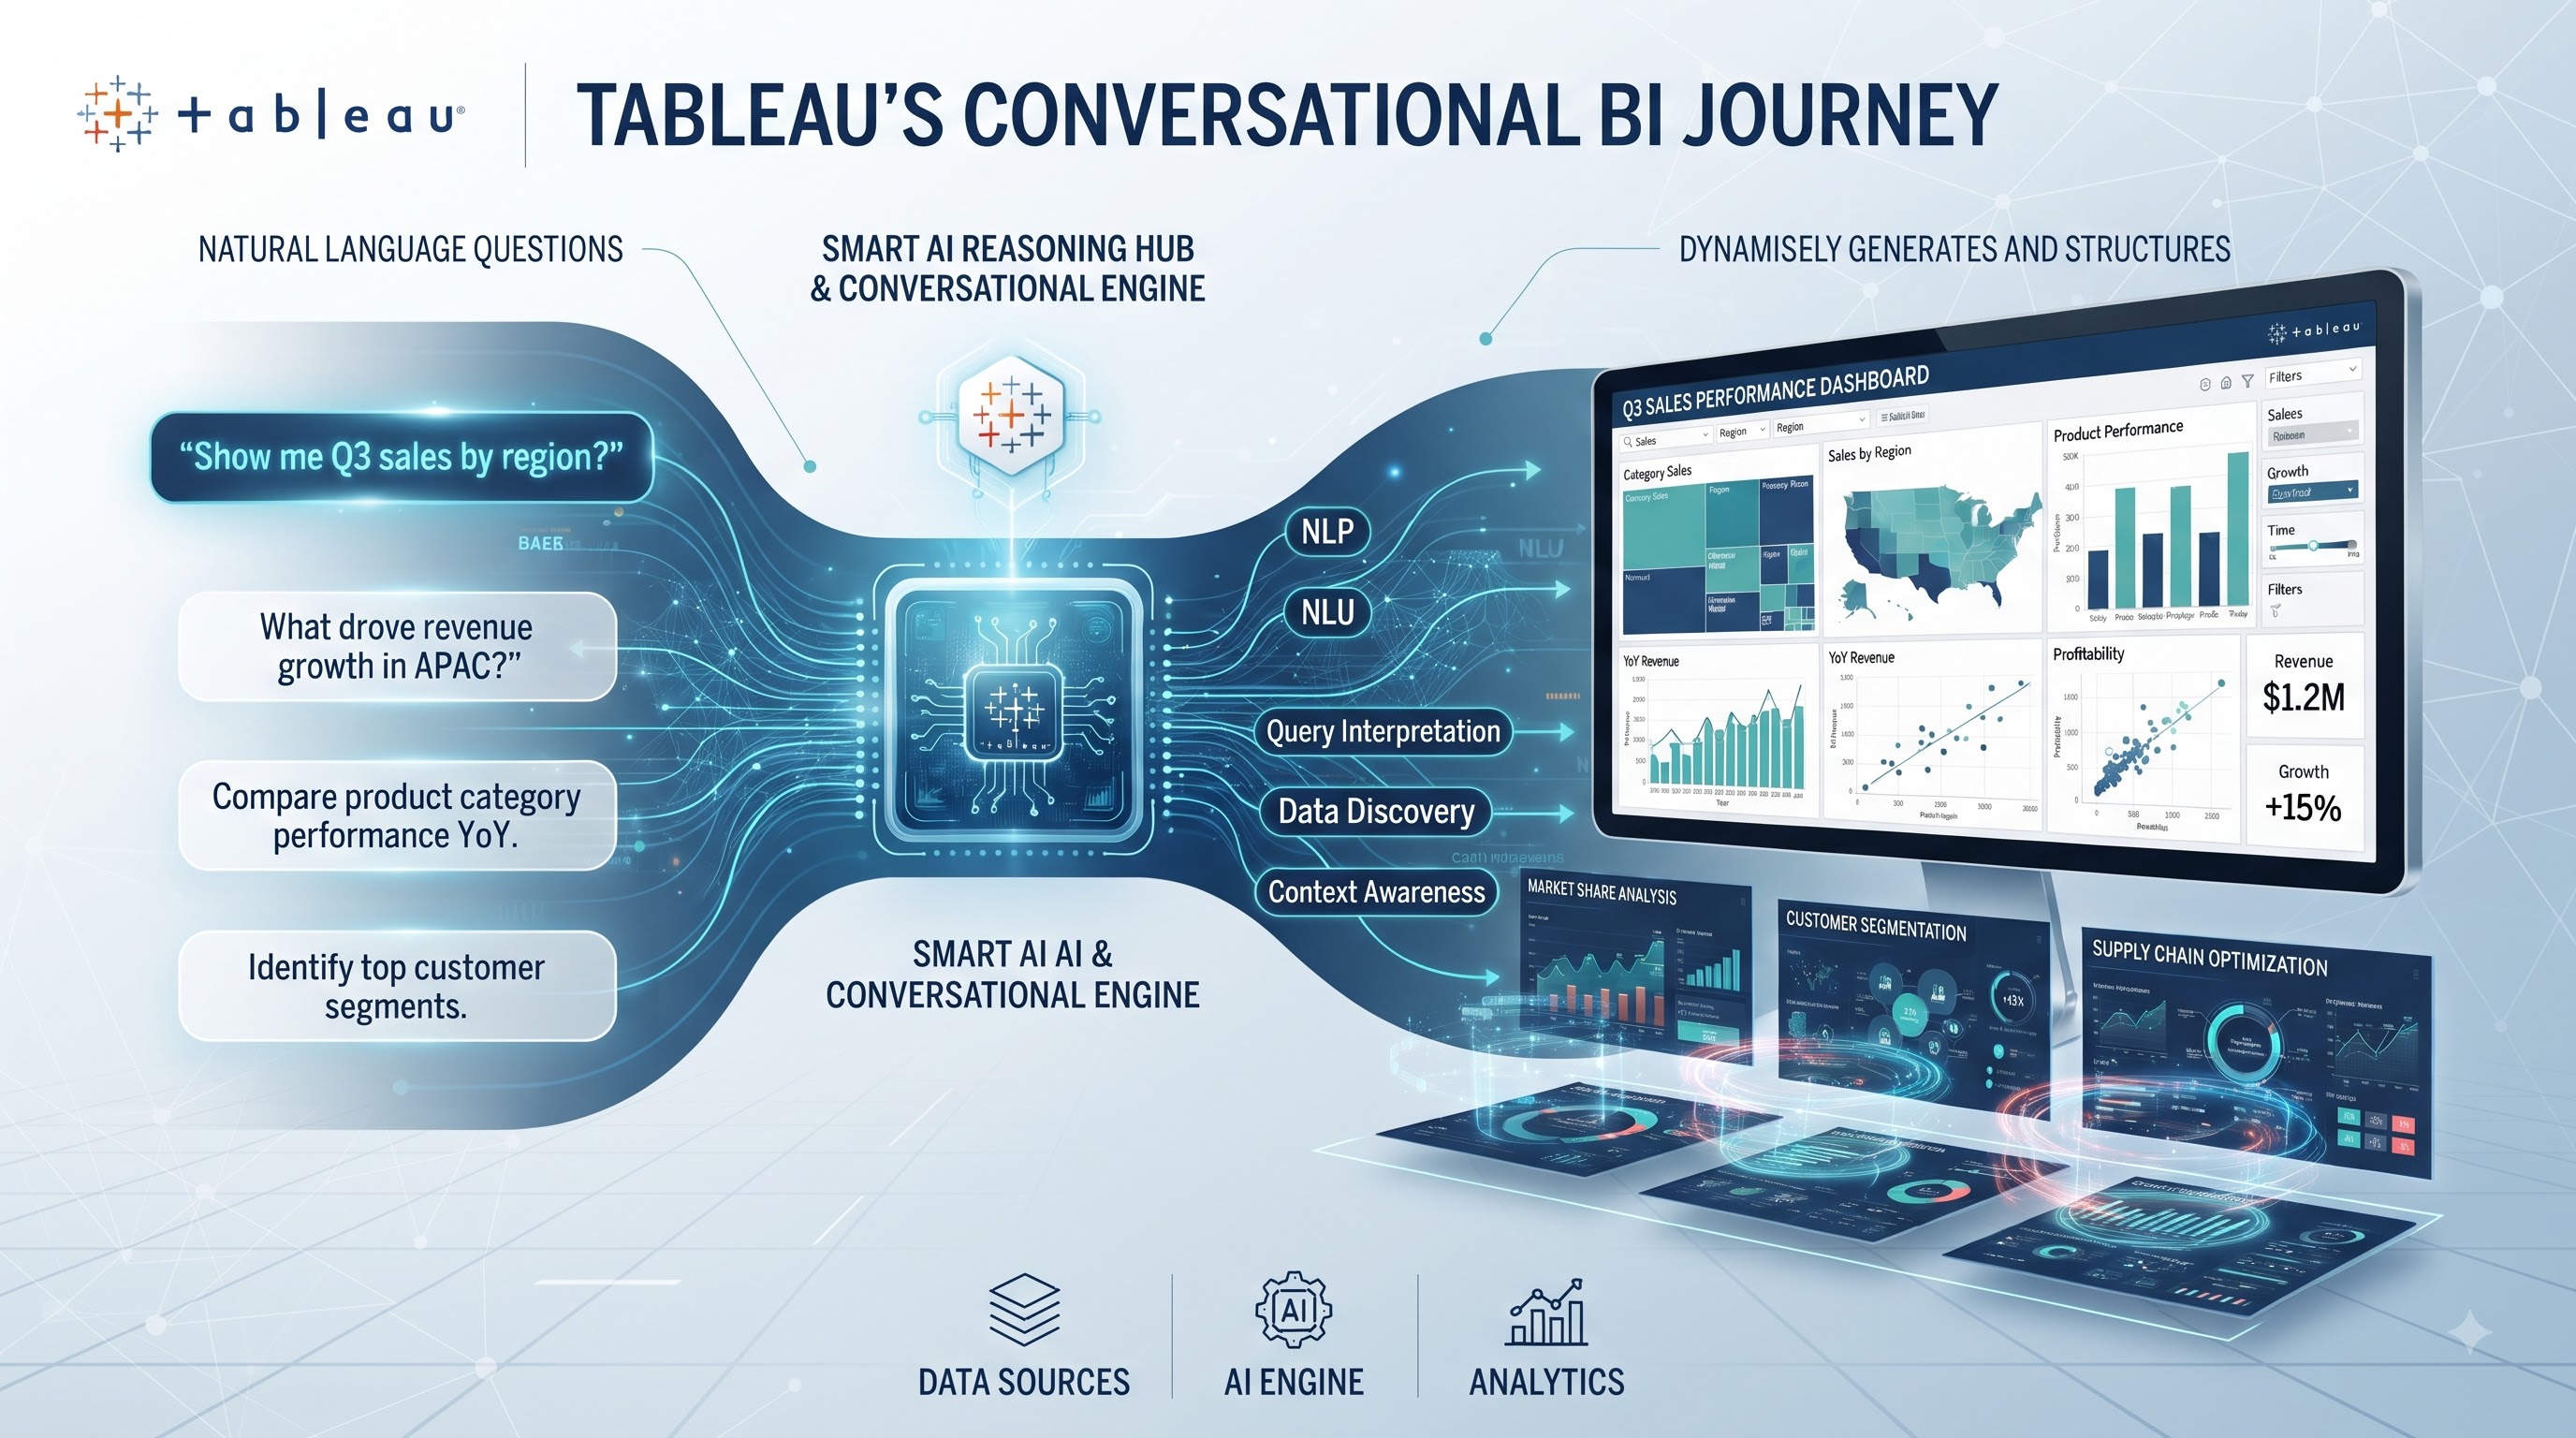
Tableau Next extends that direction further, combining data, semantics, visualization, and action within an agentic analytics platform. Tableau Agent should therefore be viewed as part of a larger transition rather than as an isolated feature.
The direction is clear:
Less friction between the question and the analysis.
But reducing friction does not remove the need for expertise. It changes where that expertise is applied.
The Bigger Shift in BI
Tableau Agent is changing how users interact with business intelligence by bringing AI into more parts of the analytics workflow. It can help with data preparation, calculations, visualizations, exploration, and increasingly with understanding what is happening inside a dashboard. But that does not make the fundamentals of BI less important. Good data, clear metric definitions, strong governance, business context, and human judgment still form the foundation of useful analytics.
The bigger change is that users may no longer need to handle every technical step manually before they can begin exploring a business question. That can make Tableau more accessible for newer users while giving experienced analysts more time to focus on complex problems and meaningful insights. At the same time, it raises the bar for what Tableau expertise means. The professionals who stand out may spend less time asking, “How do I build this chart?” and more time asking, “What should we investigate, and what should we do with what we find?”
That may be the real promise of Tableau Agent—not replacing the person behind the BI workflow, but removing some of the mechanical work so that person has more time to think, question, and make better decisions.