
Tableau Is No Longer Just a Dashboard Tool: How Visual Analytics Is Entering the Age of AI
Last updated on Sep 19, 2026
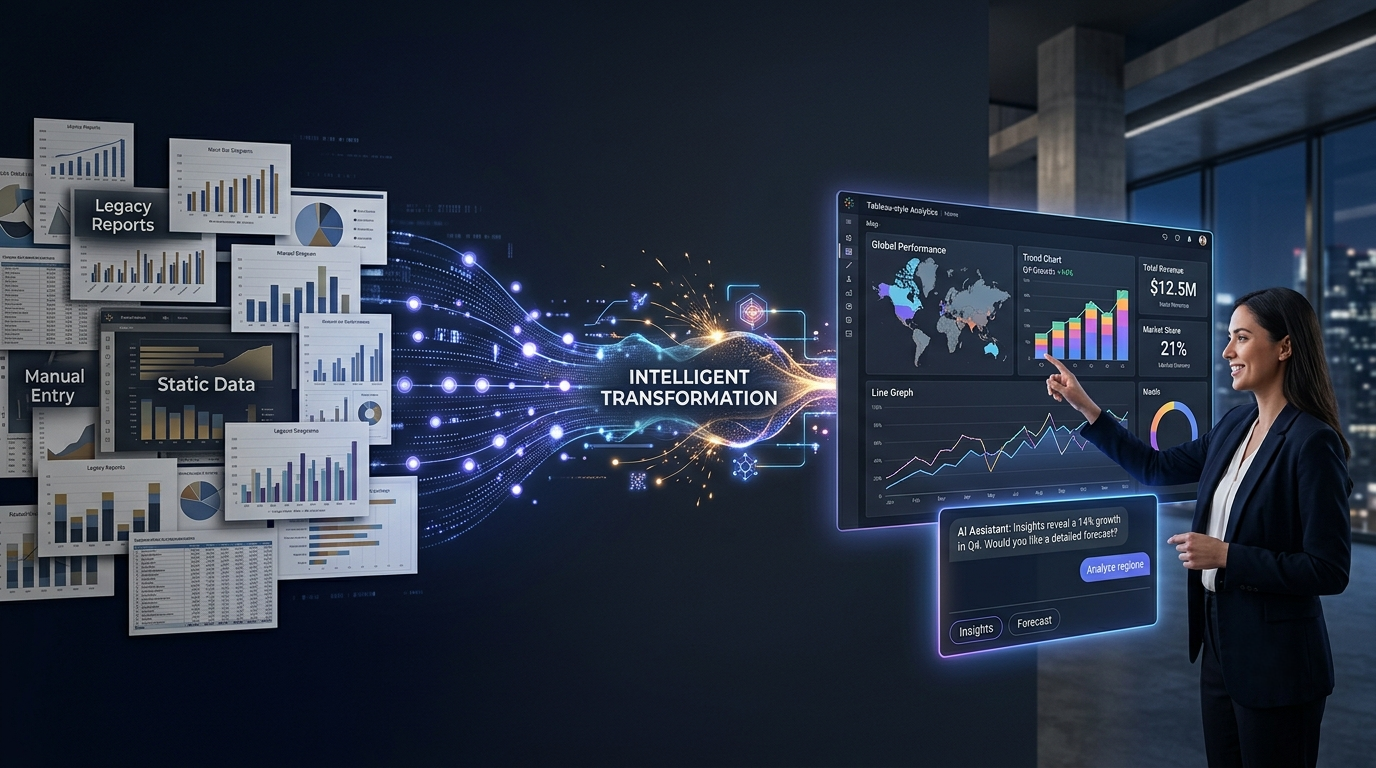
For many years, businesses have been using various analytical tools to study the state of the company and the market. It was enough to create some dashboards to show the necessary indicators for management, and everything went well. The processes went smoothly while the amount of data was relatively small, and the main problems were connected to the analysis of these data.
Now, the situation has changed to a considerable extent. Data has become an essential asset in many areas of activity. Companies work with more diverse environments, networks, partners, customers, and interactions. It also means that the number of indicators and the frequency of their analysis have increased. In such situations, charts and data visualizations help to grasp the information quickly and notice patterns or outliers. Tableau has become one of the central platforms in this environment since it allows users to explore data in greater depth and achieve faster results.
However, right now, the analytics industry is entering a new phase, where artificial intelligence plays a more significant role. Users are no longer satisfied with visual exploration of information. They now want to receive answers to their questions, and they want analytics to behave more like an assistant. Tableau continues to evolve and address these needs with products such as Tableau Pulse, Tableau Agent, Tableau Next, semantic modeling, and conversational analytics.
The most fascinating part of this moment is that the changes in the industry are not limited to one product. The global analytical environment now is evolving in a direction in which companies can address more complex problems. The ability to quickly perform specific actions has become much more important than monitoring the existing indicators.
Tableau Is Moving Beyond The Traditional Dashboard
Often, a dashboard appears simple when one first opens it up – a few charts, some filters, a set of numbers and, maybe, a map will give the impression of a certain analytical simplicity. But behind that dashboard there may be different data sources that need blending, calculations that need to be made, relationships that need to be established, specific refresh schedules or permissions, specific business rules, etc. – the dashboard is only the tip of the analytical iceberg.
And that’s where the importance of a dashboard becomes evident when a business user is trying to ask a specific question about their data. If an executive looks at a dashboard and sees that revenues are down, this is not a complete analytical experience – because the executive would want to understand what’s behind these revenues, why are they down, by which segment, channel or customer cohort, and if this is a one-time thing or a long-term trend.
This is why the analytical experience represented by a dashboard changes – it wants to help the user investigate and discover new insights, and not simply provide the answers that a user may already know. This is where Tableau Pulse is an evolution of the traditional dashboard – by focusing on metrics and context, it wants to help the user experience their data differently and drive investigation. Whereas the dashboard of old would require one to open up and start searching for interesting trends, Pulse will take care of some of these decisions for the user.
The analytical experience of today wants to go from “What is happening with my business?” to “What and why is happening with my business?”.
This is not to say that dashboards are somehow no longer useful – they continue to be excellent tools for investigative journalism about one’s own data. But the experience offered by a dashboard increasingly wants to be part of a more comprehensive analytical experience.
And this places dashboards in the same conceptual space with search engines – the latter of which, until recently, required one to know what they were looking for. One would know what to type in the search box, and then Google would attempt to guess what one might be looking for. Whereas analytics is going through a similar evolution – one where one still needs to have access to the underlying data, but increasingly the end-user wants to discover what insights are possible and relevant to them.
Tableau Is No Longer Just a Dashboard Tool: How Visual Analytics Is Entering the Age of AI
For many years, businesses have been using various analytical tools to study the state of the company and the market. It was enough to create some dashboards to show the necessary indicators for the management, and everything went well. The processes went smoothly while the amount of data was relatively small, and the main problems were connected to the analysis of these data.
Now, the situation has changed to a considerable extent. Data became an essential asset in many areas of activity. Companies work with more diverse environments, networks, partners, customers, and interactions. It also means that the number of indicators and the frequency of their analysis increased. In such situations, charts and data visualizations help to grasp the information quickly and notice patterns or outliers. Tableau has become one of the central platforms in this environment since it allowed users to explore data in greater depth and achieve faster results.
However, right now, the analytics industry is entering a new phase, where artificial intelligence plays a more significant role. Users are no longer satisfied with visual exploration of information. They now want to receive answers to their questions, and they want analytics to behave more like an assistant. Tableau continues to evolve and address these needs with products such as Tableau Pulse, Tableau Agent, Tableau Next, semantic modeling, and conversational analytics.
The most fascinating part of this moment is that the changes in the industry are not limited to one product. The global analytical environment is now evolving in a direction where companies can address more complex problems and connect data more closely with everyday decision-making. As tableau course continues to evolve beyond traditional visualization toward more intelligent and interactive analytics, the ability to quickly perform specific actions and investigate emerging insights has become much more important than simply monitoring existing indicators.
The Hidden Problem: More Data Can Create More Confusion
Most often, it is not a dearth of data that organizations have, but rather the opposite — an embarrassment of riches. There is data everywhere, and different groups are using it in different ways. One team may have one dashboard for customer retention. Another may have another. The finance team may have a different way of calculating revenue than the sales team does. The marketing team may have its own metrics for its campaigns. Analysts can end up creating their own data sets because they are unable to find or understand others’ sets.
It sounds great that everyone has the freedom to do whatever they want, but the issue arises once you start looking at what everyone is actually doing. The organization can start to find itself with dozens or even hundreds of divergent perspectives on the same business problems. That is when analytics fragmentation starts to become a problem. It is not that having many dashboards is a problem, but that we have too many dashboards with too little shared context around how they should relate to each other. When two dashboards present conflicting information, it can lead to people spending more time arguing over whose dashboard contains the right information instead of actually using those dashboards to get work done. Modern analytics is seeing a movement towards increased governance and semantics to help organizations get more value out of their analytics investments.
Instead of everybody defining everything in whatever way they want, there is more value in getting people to agree on certain things while leaving others up for interpretation. Tableau’s movement towards semantic modeling and composable data sources fits into this trend. It is important that individuals have the flexibility they need to apply their domain expertise to define what they need while being able to share that in a way that others can understand and build on top of.
Finding the right balance is the challenge.
If there is too much control, then analysts may not be able to quickly experiment or answer questions the way they want. But if there is too much freedom, then it can be challenging to ensure that dashboards and reports are actually using the same definitions. The value is not in choosing one over the other, but rather in finding how the two can be combined.
It is not a matter of whether enterprises should have a governance policy or not, but rather how they can have one and still let their analysts be flexible.
It is much easier to have such a conversation if you have only a few people in the same room. It would be much harder for an enterprise to have such a conversation and get a similar result. Having an analytical foundation helps to enable different teams to move faster while still being able to share the same concepts.
That also changes the conversation that companies have around tools like Tableau. It is not just about democratizing data visualization, but rather how Tableau can be used as part of a larger system for organizing, discovering, governing, and communicating business information. The more of an investment that a company makes in analytics, the more they will need something like Tableau to help them realize the full potential of everything they are doing.
How AI Is Changing the Tableau Experience
Artificial intelligence (AI) is changing what users expect from applications. That includes analytics software. For years, business intelligence (BI) platforms have required users to intuit the product: Find the right dashboard, choose the right filter, select the right chart, and so on. Even expert users occasionally get stuck navigating this complexity, but the experience is especially challenging for non-experts. Conversational analytics can change that.
Instead of drilling into a dashboard to find an answer, users would be able to ask a question and receive an answer similar to how they might ask a human assistant.
“How did revenue change this quarter?”
That example seems straightforward, but an accurate response might involve a multi-step drill. Users would want to know whether the change was driven by customer counts or average order value, for instance, and whether that affected one region or all regions. Was there a specific time period that drove the change? These are all questions an AI assistant could handle, while a traditional analytics application would require the user to manually drill from one visualization to the next.
That’s the promise of a product like Tableau, which has been quietly but steadily moving toward this future through Tableau Agent and Tableau Pulse. New features are being added to support conversational analytics, analysis trends, comparison, and other operations that support human discovery of insights. The end result could be an analytics experience that’s intuitive enough for casual business users, without requiring extensive training to get started. Tableau’s tools do not require analysts to become experts at data visualization design before they can contribute meaningfully.
But there is one showstopping caveat: An AI tool is only as good as the data it uses. An AI system can explain correlations; it can’t identify causation. If the metrics are defined incorrectly, if the data collection process contains errors, if the right permissions aren’t applied, then an easy-to-use interface simply makes these mistakes more accessible. That’s why analytics tools like Tableau are likely to continue to require human analysts. If anything, AI assistants make analysts even more valuable by changing what they do.
Analysts and data scientists will still be needed to define and defend the metrics used in analyses, troubleshoot errors, ensure appropriate data governance, and understand how changes in metrics might affect results. In other words, instead of creating dashboards, analysts may be called on to create environments in which dashboards can be discovered by non-analysts. For casual business users, that represents a huge opportunity. For analysts and data analysts, it may create new challenges. It remains to be seen how this new class of analytics assistants will reshape the industry. But there is no doubt that it will happen.
The New Skills Behind Modern Tableau Analytics Essay
In the world, many people learn Tableau and focus on making dashboards. Still, there is always more to learn for anyone who works with data and analytics. A person learning Tableau will often learn how to connect data, create charts, use filters, build dashboards, and use calculated fields.. This is just the start. Most companies want people who understand how to use Tableau for analysis and reporting. As data and analytics lead business decisions, it becomes more important for a Tableau professional to know how data is prepared, connected, analyzed, and shown in dashboards.
Beyond the knowledge of Tableau tools and analytics professionals should know how these features are used in different contexts. This includes preparing data establishing relationships performing calculations improving performance publishing reports and working with permissions, quality and governance settings. The need also depends on the professional’s area of expertise and a Tableau analyst working in a field needs to know its fundamentals, such as the role of SQL, databases, cloud storage, data warehousing and business processes.
Therefore training and learning Tableau should involve connecting the dots between features and tools in the software and how they apply to an organization’s functions. It should encourage thinking about the tools and tests needed to analyze the right data for a business problem rather than learning only how to build dashboards and charts. Thus people learn Tableau for its ability to support their process and the best way to use Tableau is not to memorize where and how to find particular functions.
Anyone who wants to become a Tableau professional should learn more than just how to present data through charts and dashboards. A tableau developer course can help build the technical foundation needed to work with dashboards, data connections, calculations, and analytical requirements, but practical understanding is equally important. It is not enough to know how to build a dashboard; a professional must understand what the dashboard is supposed to achieve, which data can answer the business question, which metric should be defined, and who will use the final result. It is possible to create an accurate dashboard that still fails to answer the actual question because it misses the metric or context that matters to the user. Likewise, the visualization should represent the data correctly, use an appropriate chart type, avoid unnecessary complexity, and load efficiently so that the final dashboard is both useful and easy to work with.
As AI becomes part of the data and analytics space some tasks will become easier such as building reports and dashboards in Tableau. However the fundamental skills needed for someone who works in analytics with Tableau are likely to change. Of learning where to find tools or how to make calculations people will need to use their analytical and critical thinking skills and check whether an automated process produces the correct results.
Why Architecture, Governance, and Trust Matter
A beautiful dashboard is part of the equation. The real question is whether this dashboard will continue to be useful as the days, weeks and months go. Dashboards that are slow, require calculations, use different definitions of the same metric and need to be reloaded or refreshed every day create more frustration than insights. An analytical product must have value from day one. It must also keep that value as it gets more complex.
There are reasons why this might happen. It could be related to the data volume and connections, extracts and calculations relationships and filters query complexity and layout, permissions and refresh, monitoring and lineage, deployment, and data quality in general. The list of things that affect the analytical experience can seem never-ending. In words, Tableau development is part of data and analytics engineering, not just visual design and dashboard building.
Who Needs a Dashboard? Different professionals have to work to achieve a common goal of creating a valuable analytical product regardless of its form (a dashboard, an API, a server-side application or something else). For instance, data analysts might extract, transform and load the data while analytics engineers could design the model. Tableau developers would build the product and administrators would configure permissions, schedules and other aspects. Business users in turn would define the context and the set of metrics in which the target audience operates.
These considerations become more important when it comes to the role of artificial intelligence in analytics activities. There is no doubt that AI makes an analytical product more valuable than ever. At the time there are certain limitations that have to be taken into account. One of them is data quality. It does not matter how advanced the AI tool is it will never produce results if given low-quality input data. The same goes for the definitions of metrics that have to be the same across all data sources. In addition access permissions are another matter of governance. Context and clear definitions are important in making the analytical product valuable. Governance is a term that refers to control and organizational matters. AI analytics tools, in conversational agents cannot replace the need for governance and control. A common mistake is to see governance as a limiting factor, a brake on processes. However that is not the case. Long as governance enables new opportunities and supports the work of data scientists and analysts it is valuable. The truth is that governance enables self-service analytics. The concept of self-service analytics is simple: it refers to the ability to explore and analyze data regardless of the complexities of the underlying infrastructure. The word "self-service" does not mean that everyone has to operate data lakes and warehouses. Rather it means that analysts and business analysts have to receive the information in the right format.
To summarize, analytics in general and the role of the dashboard in particular in the age of data and artificial intelligence require a multi-faceted approach. It is necessary to enable the right people to receive the information in a timely manner. The concept of governance has to be applied to data and analytics not avoided. In words, people who engage in analytical activities have to explore data that they can trust. Governance, compliance and quality audits are not obstacles to the work of data scientists, analysts and business analysts. On the contrary, these activities support their work, especially when it comes to analytics.
From Dashboards to Decision Intelligence: Where Tableau Is Heading
Reporting concentrates only on answering the question of what happened. Modern analytics however, is increasingly judged by its ability to go further and investigate why things happen.
If revenue is down 12 percent, a simple report will give the number. An analytical experience will help investigate whether that drop happened in a particular region, product category, customer segment, sales channel or time period.
This subtle difference completely reshapes the nature of the conversation. Analytics becomes less about the number and more about the context and circumstances that make the number what it is. This is one of the reasons why Tableau’s progress toward insights, conversational analytics and AI‑fueled investigation is so important and compelling. Analytics workhorses rarely exist in a vacuum. Revenue is often linked to customer acquisition, which is frequently driven by marketing spend. Acquisition cost varies by device and geography. Conversion depends on product availability and so on. The true analytical challenge is not the number itself but understanding the situation in which the number appeared.
As important is the recognition that analytics capabilities are coming into workplaces in entirely new ways. Long gone are the days when people would have to stop what they were doing navigate to a business intelligence platform, find the relevant dashboard, spend time interpreting it, and then return to their original task. Modern analytics experiences are increasingly embedded directly into the tools people use daily, collaborate in, and consume on devices.
That shift represents a reimagining of the analytics lifecycle: Data → Insight → Workflow → Decision, as opposed to Data → Dashboard → User → Interpretation → Workflow.
I think a minuscule change to the process can have a surprisingly huge impact on the bottom line.
If people have to navigate to a dashboard, analytics success is predicated on a continuous stream of engaged and motivated users. By contrast if insights come directly into the flow of work, people are more likely to absorb them and act on them. Essentially, it is no longer enough to equip people with dashboards; organizations need to ensure they receive the right information in the right context. This is why a finance director does not need a sales manager’s dashboard while a sales manager may have use for a finance director’s.
Specialists need to consume information relevant to their area of responsibility and be given analytical tools appropriate to their needs and capabilities. It is also the reason why modern analytics is increasingly about visual analysis. Analytics will always be visual because people need visuals to grasp the situation and see the picture. However, semantic models, conversational analytics and AI agents increasingly power the process in the background, becoming more sophisticated and capable with every iteration. At the time, embedded analytics and governance solutions put analytics in the hands of more business people while reducing the risks associated with democratizing data. None of this is to say that dashboards are dead; they are simply no longer the end‑all be‑all. From a development perspective, this means that visual analytics expertise is no longer enough to prepare people for the future of Tableau.
Beyond visuals, professionals need to be familiar with the data life cycle in general and data analytics in particular, along with business processes, analytical thinking and logic, governance, performance, and AI-fueled analytics. As tableau software continues to become part of this broader analytical environment, understanding how data moves from collection and preparation to analysis and decision-making becomes increasingly important. From this standpoint, the future of analytics is less about how much data an organization can amass and more about how effectively it can transform that data into knowledge and use it to drive real-world outcomes.
It is about closing the loop between the question and the answer, between information and action and between business potential and performance.Ultimately, this is what makes the evolution of Tableau so fascinating to watch. Not because it will necessarily disrupt the industry, but rather because it will quietly redefine it.