
Tableau Learning Roadmap: From Beginner to Pro in 2026
Last updated on Nov 7, 2026

The Current State of Data
In this tough environment, which involves a struggle for dominance using data, gathering of information stops being a competitive advantage altogether. Every business in any industry is trying to deal with petabytes of operational telemetry data, customer statistics, financial accounting data, and internet traffic logs. What separates a business from being merely lagging behind to becoming an industry leader is the business ability to transform all this mass of numbers into understandable concepts. And this is where data visualization tools, such as Tableau, come into play.
To learn how to work with Tableau software, it is not enough just to understand how to drag objects across the screen. To master this tool, it is necessary to rethink one's approach to the data, the analysis of business problems, and decision-making. Irrespective of whether you have never used spreadsheets before or you are already an advanced user of data, a structured learning path is required. You will find the information necessary for becoming a Tableau expert below.
Phase One: Creating a Strong Foundation for a Beginner
Every professional at some point was a beginner who could not comprehend all the terms and complicated interface. Your introduction into the world of Tableau will be more focused on learning the basic principles of data literacy and gaining an understanding of the philosophy of visual analytics.
Tableau Environment Understanding
Prior to diving into the software itself and its navigation system, you need to understand what is Tableau and its role in life. Tableau is aimed at helping people to visualize and understand their data. It is the mediator between data storage and human data processing. First, it is necessary to get acquainted with the entire ecosystem of products. Tableau Desktop will be your primary place to create workbooks. Tableau Server and Tableau Cloud will be your collaborative environment where your company will share the insights generated by Tableau. Finally, Tableau Prep Builder will be the dedicated data preparation companion application for Tableau.
Controlling the Interface and Navigation
The initial things that you will have to do consist of starting the Tableau Desktop software and navigating the software interface. It is crucial to learn a lot about the Home Screen, since it helps control your recent workbooks, global settings, and connection to different sources of data. Then, you will have to work with the Data Source page, which is used for creating connections to local data (Excel or CSV) or business cloud databases.
In the core analytics interface, you will see the familiar drag-and-drop interface of Tableau. It is necessary to understand the difference between dimensions and measures. Dimensions normally contain qualitative and categorical data, including variables such as the names of clients, shipment dates, and geographical regions. Measures consist of quantitative and numeric data, like sales, margins of profit, or quantity sold. The awareness of how Tableau automatically categorizes your data into discrete (blue pills) and continuous (green pills) is one of the key aspects of learning views.
Creating Your First Visuals
Once the interface has been navigated, the next step is that of creating your first basic visuals. Learn to drag dimensions and measures on to the Columns and Rows shelves in order to create your first visualizations immediately. You can try working with the Marks card in order to work with color, size, text, detail, and tooltips.
Now, it is advised that you spend time practicing the creation of simple visualizations such as bar charts, time series line charts, scatter plot to identify correlation, and filled maps. At this stage, you should not bother about anything other than understanding what happens when you drag and drop pills. The only data sets you should be using at this stage are those provided by the community.
Cultivation of Analytical State of Mind from the Beginning
In addition to just clicking on buttons and being able to use menus, acquiring a higher-level of proficiency in Tableau is all about changing one’s mentality from reporting to analysis. When working with a new dataset, avoid making a dashboard right away and think about hypotheses instead. Try to think what business problem you are looking for, what the target audience of the report might be, and how the visualisation will affect the process of decision-making. This will ensure that your technical skills have a real business value, not only the aesthetics of them.
To increase the learning process and make a smooth transition from the basics to the professional field, the ideal way is to enroll yourself in a tableau developer course.
Phase Two: Progressing Towards Intermediate Level of Expertise
After you have learned how to build basic individual charts, the next stage on your way will demand from you to acquire analytical skills. Intermediate Tableau users do not only visualize data. They analyse it and transform and also create several individual charts into one data story.
Connecting Data, Joins, and Blending

Real data is usually messy and scattered across different tables. Being an intermediate user, you should learn how to correctly connect data. Study the Data Source tab, where you can learn more about data connections. Understand what the differences between inner join, left join, right join, and full outer join are. Learn how data duplications and data loss occur in case joins are not done correctly.
Also, learn data blending that allows you to blend data from completely different data sources according to a particular level of detail without any classical database join. Know when to extract your data in a fast Tableau's Hyper format and work with it offline and when to have a live connection in order to track real-time operations.
Data Preparation and Structuring
Data cleanliness influences the quality of your analysis. Spend a lot of time learning Tableau Prep Builder. Learn how to move your column to rows, split your strings, handle missing values, clean data from noise, and aggregate rows. Mastering the data structuring skills will allow you to save many hours working in Tableau Desktop, thus solving your complex math layout tasks.
Structuring Data for Maximum Insight
Apart from ensuring that you have clean data, it is also important for you to know how to organize the field data in the data pane. It involves categorizing your dimension members into groups, binning the numerical values, and creating hierarchies for ease of drilling. Creation of hierarchy from country level right down to state, city, and even ZIP codes makes it possible for end users to drill down in their analysis.
Filtering and Sorting at an Intermediate Level
Filters are the main way through which you interact with users through reports. Avoid relying solely on dimension filters and go further to understand the order of operations in Tableau. You should have understanding of how extract filters, data source filters, context filters, set filters, dimension filters, and measure filters work in a particular sequence. Knowing why context filters must come before top-n filters is an intermediate-level skill.
Designing Interactive Dashboards
While separate charts can be used to answer specific questions, the business people require interactive dashboards that will provide them with the overall information about the performance of the process under consideration. In order to move from worksheet to the dashboard, it is important to forget about the worksheets and concentrate on designing human-centered and visually effective solutions.
Find out more about how to manage the size of the canvas for the dashboard using the auto-scaling or fixed pixels depending on the medium through which the dashboard will be delivered. Get familiar with the technique of using containers in order to preserve the dashboard layout regardless of screen resolution or changes in filters. Design responsive dashboards with the help of dashboard actions allowing you to select a bar in one chart and get actions on another part of the dashboard.
Telling Stories with Data and Reducing Cognitive Load
As you begin to develop more complex dashboards, it is crucial for you to understand how to create effective visual hierarchy and decrease the cognitive load on the viewers. Your stakeholders will be usually busy executives who need to get the idea in ten seconds. You must learn how to become a master of your visual world. Eliminate chart junk, select colors properly, and apply white spaces well. By adding the narrative text and titles to your visuals, you will be able to convert your visualizations into a business story which will enable you to make better decisions.
Phase Three: Advanced Analytics and Reasoning
Now you will grow into an advanced analyst from being a skilled report writer. Not only do you provide the data but also give the reasons for those figures, forecast future trends, and create scalable calculation systems for enterprise reporting engines.
Learning Calculations in Tableau

Calculations turn Tableau into a powerful calculation engine. There are four major types of calculations that you need to know:
Row level calculations: These are calculations which are executed on the individual row within your data set, enabling you to create your own metrics, conditional string calculations and number derivations.
Aggregate Calculations: These are calculations done at the same level as your current view and enable you to conduct comparison analysis for the sum, average and ratios of categories.
Table Calculations: These are calculations performed on the data which has already been selected into your view. Be adept at calculating Running Totals, Percent Difference from Previous, Moving Average and Rank Calculations. It is important to understand addressing and partitioning and how the calculation differs when you compute along the Table Down or Table Across direction.
Level of Detail (LOD) Expressions: LOD expressions represent a paradigm shift in your Tableau expertise. These calculations will enable you to calculate values not only at the data source level but even at a different level from the one being used in your current view. Understand the different LOD expressions viz., Include, Exclude and Fixed. If you need to calculate Customer Lifetime Values, Cohort Retention and compare Regional Sales with Store Average without changing the visualisation layout, then LOD Expressions are just what you need.
Learning how to make use of advanced calculators and fine-tuning them for better efficiency requires a lot of experience and expertise that can be imparted by an expert. The perfect destination to find best tableau training online is where you will get to do so.
Advanced Statistical Techniques and Analytics
Rather than basing their decisions solely on intuition or trends, advanced professionals build statistics into their visuals right from the beginning. Learn how to use advanced analytics functionality within Tableau. Apply trend lines, reference bands, distributions, and boxplots to show differences and outliers. Use built-in forecasting techniques for predicting future behavior based on exponential smoothing, and use cluster analysis to group your customers or employees according to behavioral traits.
Performance Tuning and Optimization
With data sizes reaching millions and billions of rows, underoptimized workbooks will inevitably slow down, causing user dissatisfaction and server overload for the enterprise. Advanced professionals are well-versed in performance optimization. Learn how to run and read the Performance Recorder in Tableau Desktop. Learn when it makes sense to use pre-aggregated database tables instead of complicated calculations, how to limit marks in visualizations, how to avoid excessive blending of data from unindexed data sources, and how to make effective use of extract filters and proper indexing.
Avoiding Logical Pitfalls and Semantic Ambiguity
The more you progress in calculations, the more logical pitfalls you will face, which will contaminate your calculation without your knowledge. The ability to recognize when aggregate comparison works better than non-aggregate, the potential risk of using nested table calculations, and the time to choose LOD expressions over blends separates the experienced ones from the beginners. Practicing calculations on sparse data and negative numbers can help ensure that your calculations meet the highest corporate standards.
Phase Four: Advanced Professional
To get to the professional level of your work with Tableau, you have to start considering not only your workbooks but also the corporate architecture and culture around the Tableau usage within your company. The advanced Tableau professional is the corporate data leader, providing scalability and governance of the business.
Corporate Governance, Security, and Administration
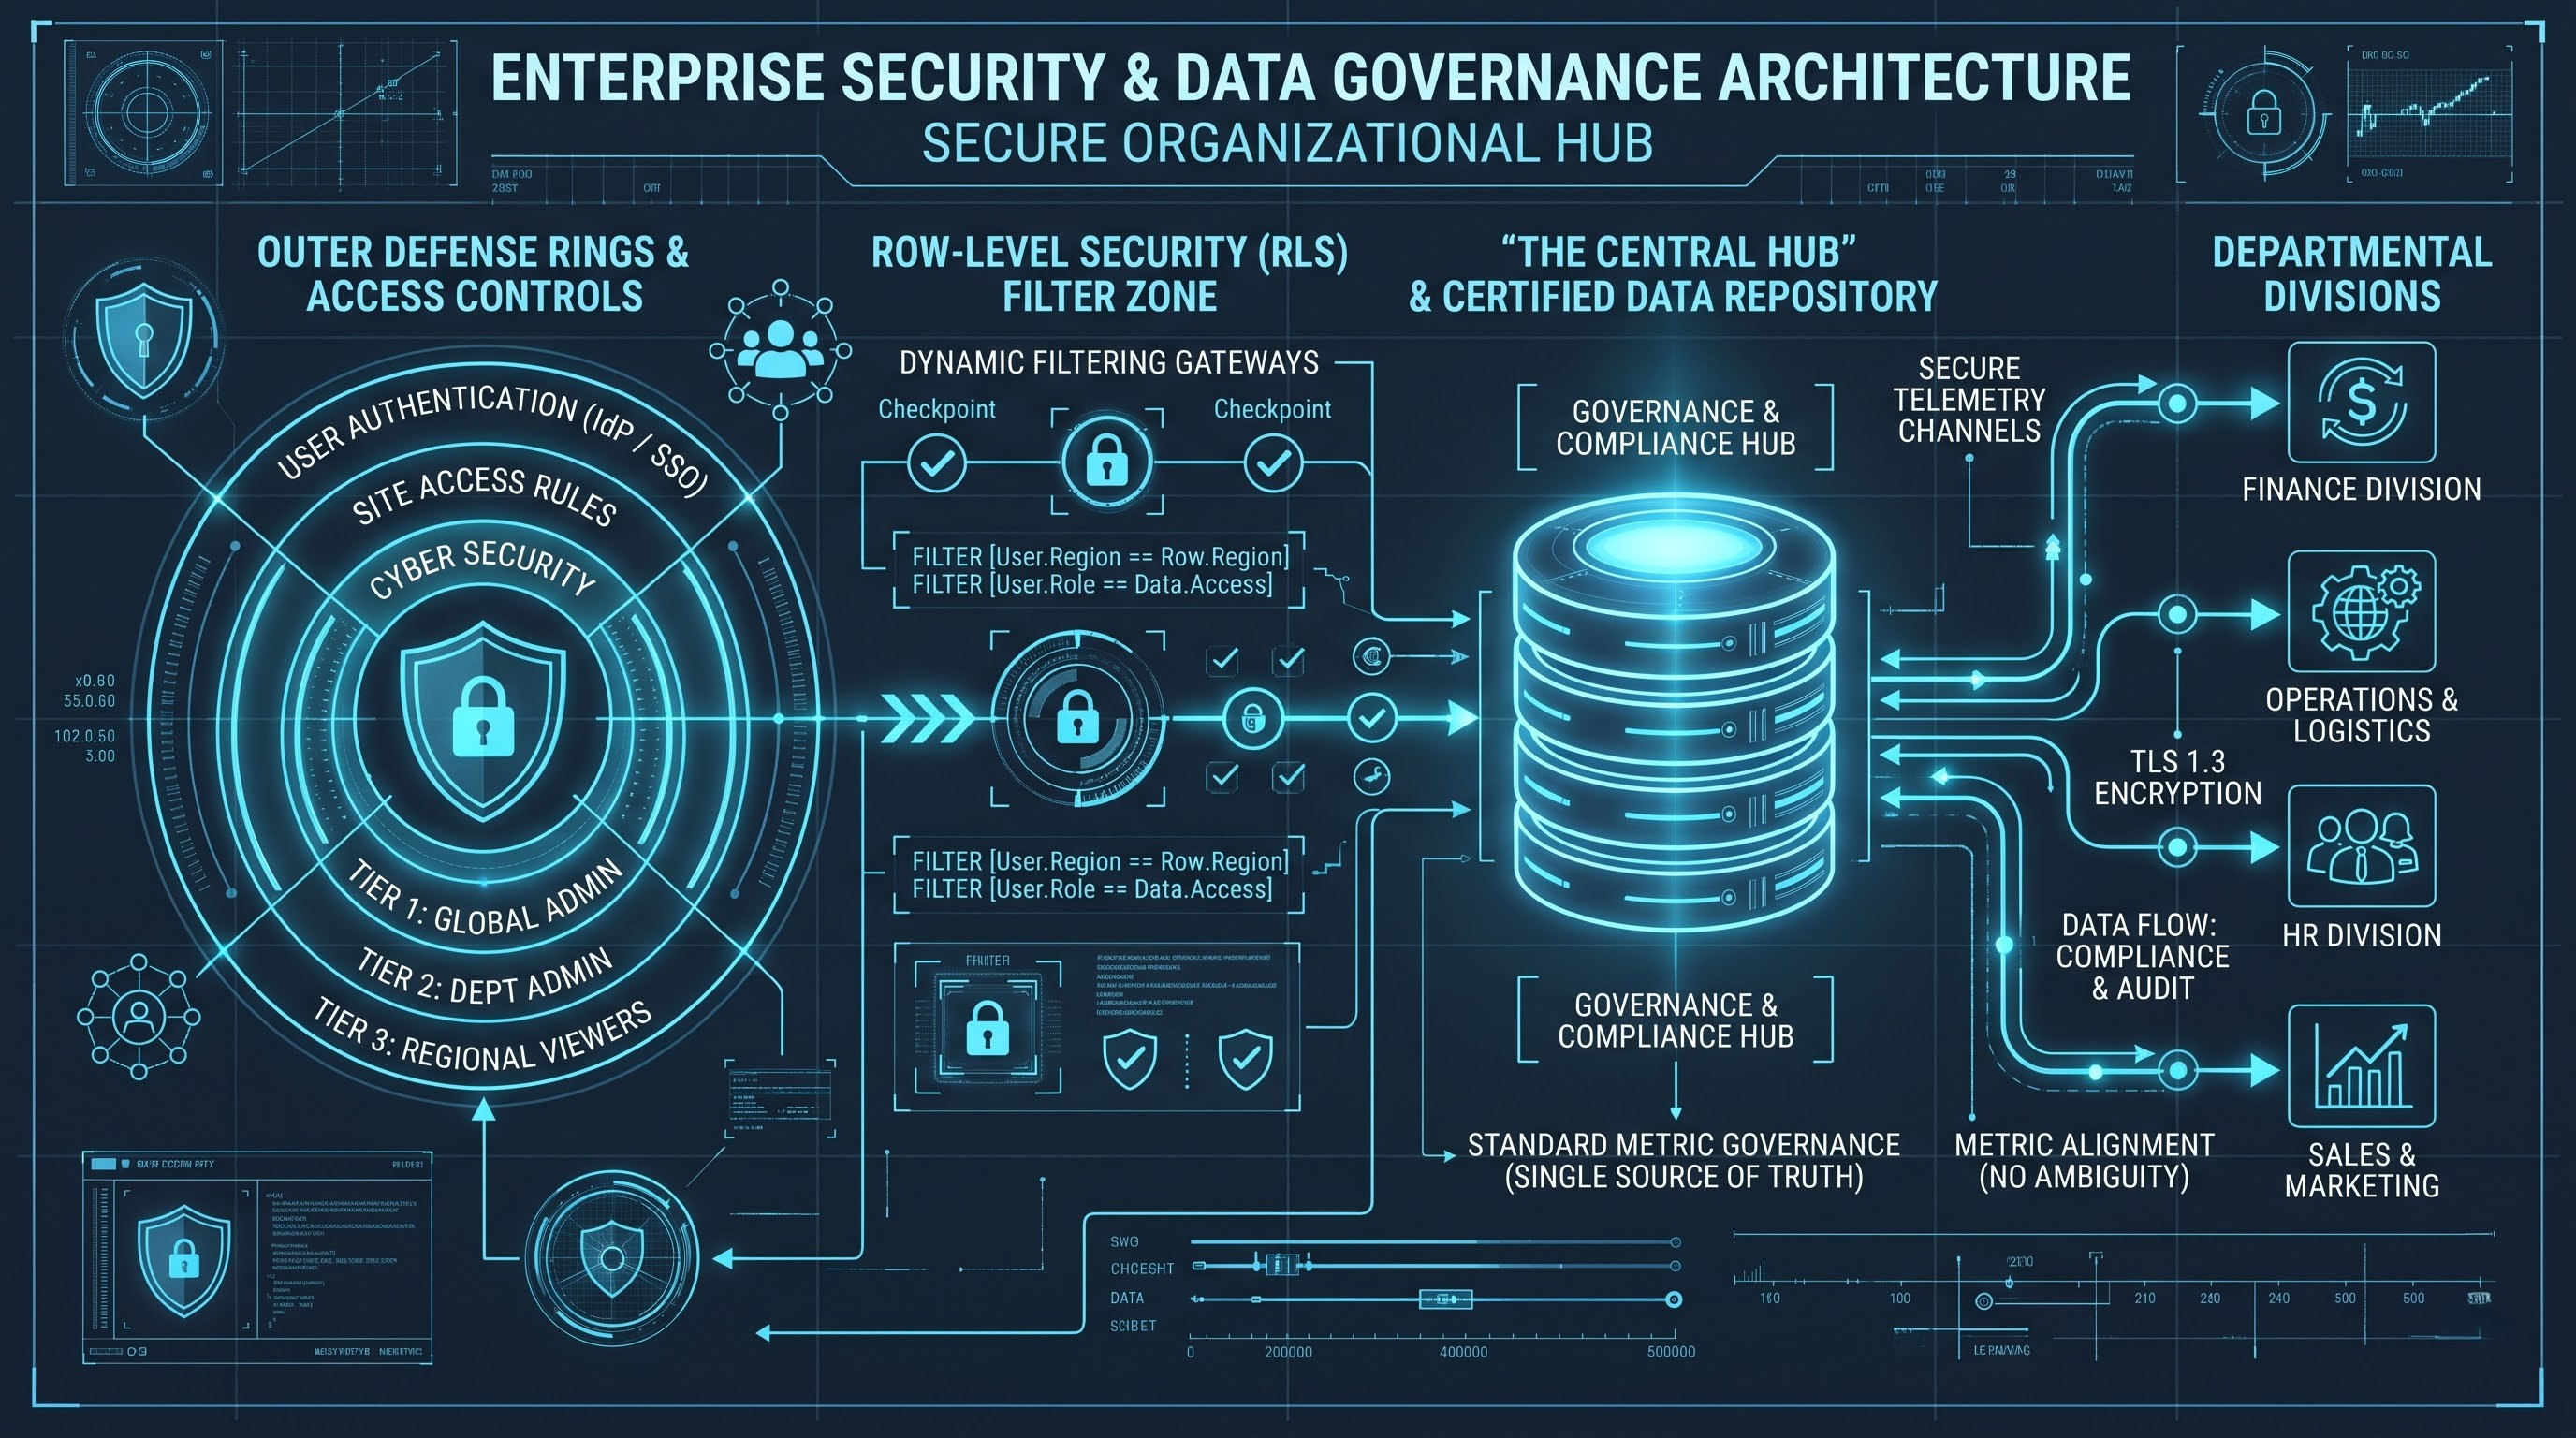
Having several authors writing and publishing content on Tableau Server or Tableau Online, it is guaranteed that there will be chaos without any governance. The advanced professional has to know how to apply the row-level security (RLS), which allows you to restrict access to certain data based on user permissions.
Learn how to structure your sites, define users’ roles, configure authentication procedures, and establish certification flows for data sources. Knowledge of how to raise the level of your workbook to a certified company data source guarantees quality data and avoids problems with metric naming in different departments.
Developing via Tableau Blueprint and Center of Excellence
Businesses that expand the capacity of analytics often form a Tableau Center of Excellence (CoE). As a skilled professional, you will need to define the proper best practices, color schemes, and templates to comply with brand requirements. You will have to represent the Tableau Blueprint and align technical implementations with strategic decisions to foster self-service data culture within the company.
Obtaining Professional Certifications and Career Advancement
In order to officially confirm your competencies and stand out from other candidates on the labor market, you have to take your certifications. Try to be certified in the Tableau Desktop Specialist, Certified Data Analyst, and Server Certified Professional badges. It shows your technical skills, knowledge of the architecture, and proficiency. In addition to that, create your portfolio of work that demonstrates your expertise in creating advanced dashboards.
Developing a Community and Learning Culture
Tableau community is famous for being incredibly welcoming and supportive. Advanced Tableau specialist understands that learning is a never-ending process. Join local Tableau User Groups, participate in different projects implemented by the community like Makeover Monday to improve your design skills, and post your solutions on Tableau Community Forums. Active participation in the community will help you not only develop skills but also boost your reputation in the sphere of data analysis all over the world.
Conclusion: What's Next for You?
Becoming an advanced Tableau professional starting from a beginner level is a process that needs time and willingness to learn. By slowly building your expertise in basics of UI, dashboarding, advanced analytics, governance, and community involvement, you become an indispensable employee of any contemporary organization.
As for the future, we can be sure that the amount and complexity of data will only grow in the years to come, however, your ability to cope with this mess will remain one of the most valued professional skills in the modern economy. Start working now.
To ensure that you develop your career in the right manner and gain industry-certified skills, you can opt to enroll yourself in the tableau courses online through OnlineITGuru.