
Tableau Multi-Cloud Enterprise Data Visualization Strategies
Last updated on Oct 15, 2026
In the modern enterprise, competitive moats are built upon the ability to turn raw telemetry, transactional data, and customer touchpoints into actionable strategic insights. Modern enterprises are frequently data rich, but information poor due to siloed analytics, latency in processing, and governance overhead in sprawling IT environments. Tableau has long been a favorite among enterprises for intuitive data visualization and narrative reporting tools. But Tableau's decoupling from the hyper-scale cloud ecosystems where the data resides causes operational bottlenecks, bloated costs, and security vulnerabilities for enterprises attempting to deploy it at scale.
To fully capitalize on the competitive advantages of data visualization, modern data leaders must develop coherent strategies around unifying Tableau with the big three hyperscalers: Amazon Web Services, Microsoft Azure, and Google Cloud Platform. While each of these cloud providers has native tools for data visualization, Tableau is the preferred choice among enterprises that want to maintain multi-cloud agility while extracting maximum insight from their data. However, designing these unified pipelines requires people who have an advanced understanding of modern connectivity and query tools. To address this particular enterprise talent shortage, engineering and BI leaders often turn to tableau online training courses to teach analysts how to properly navigate live queries and cloud connections.
The Strategic Shift: Decoupling Visual Analytics from Compute and Storage
Business intelligence platforms have long operated on a coupled model where reporting servers ingested, stored, modeled, and rendered data on proprietary appliances or dedicated virtual machines. Such a premise failed under the pressure of ever-growth data, semi-structured formats, and a desire to glean real-time insights. The fundamental principle of cloud analytics is the strict decoupling of storage, distributed compute, and visual consumption.
In this new paradigm, the heavy lifting is done by the hyperscalers which store petabytes inside scalable object storage and orchestrate transformation pipelines, metadata cataloging, and massively parallel queries across dedicated compute engines. Tableau acts as the visual presentation, semantic exploration, and decision-support layer directly on top of these engines.
This kind of decoupled approach needs a rethink in strategy:
Query Pushdown vs. Local Ingestion: Should the data reside inside Tableau data extracts or inside cloud analytical warehouses with optimised live queries pushed down into distributed engines? The architects should weigh in.
Latency vs. Compute Expenditure Rendering dashboards at high frequencies can lead to compute warehouse consumption, requiring intentional caching tiers and semantic aggregation strategies.
Cross-Cloud Ingress and Egress Realities: Moving raw datasets around geos and clouds in a multi-cloud and hybrid world can come with latency and financial penalties that need to be systematically mitigated.
Architectural separation of storage, compute and visual presentation enables organisations to support horizontal scaling and empower business users to analyse large datasets without the risk of impacting transactional databases.
Architectural Patterns: Live Query Pushdown versus Extract Approaches
At the design level, every Tableau cloud implementation must make architectural decisions around whether to query cloud data sources live or import subsets of data into Tableau hyper extracts.
The Argument for Live Connections
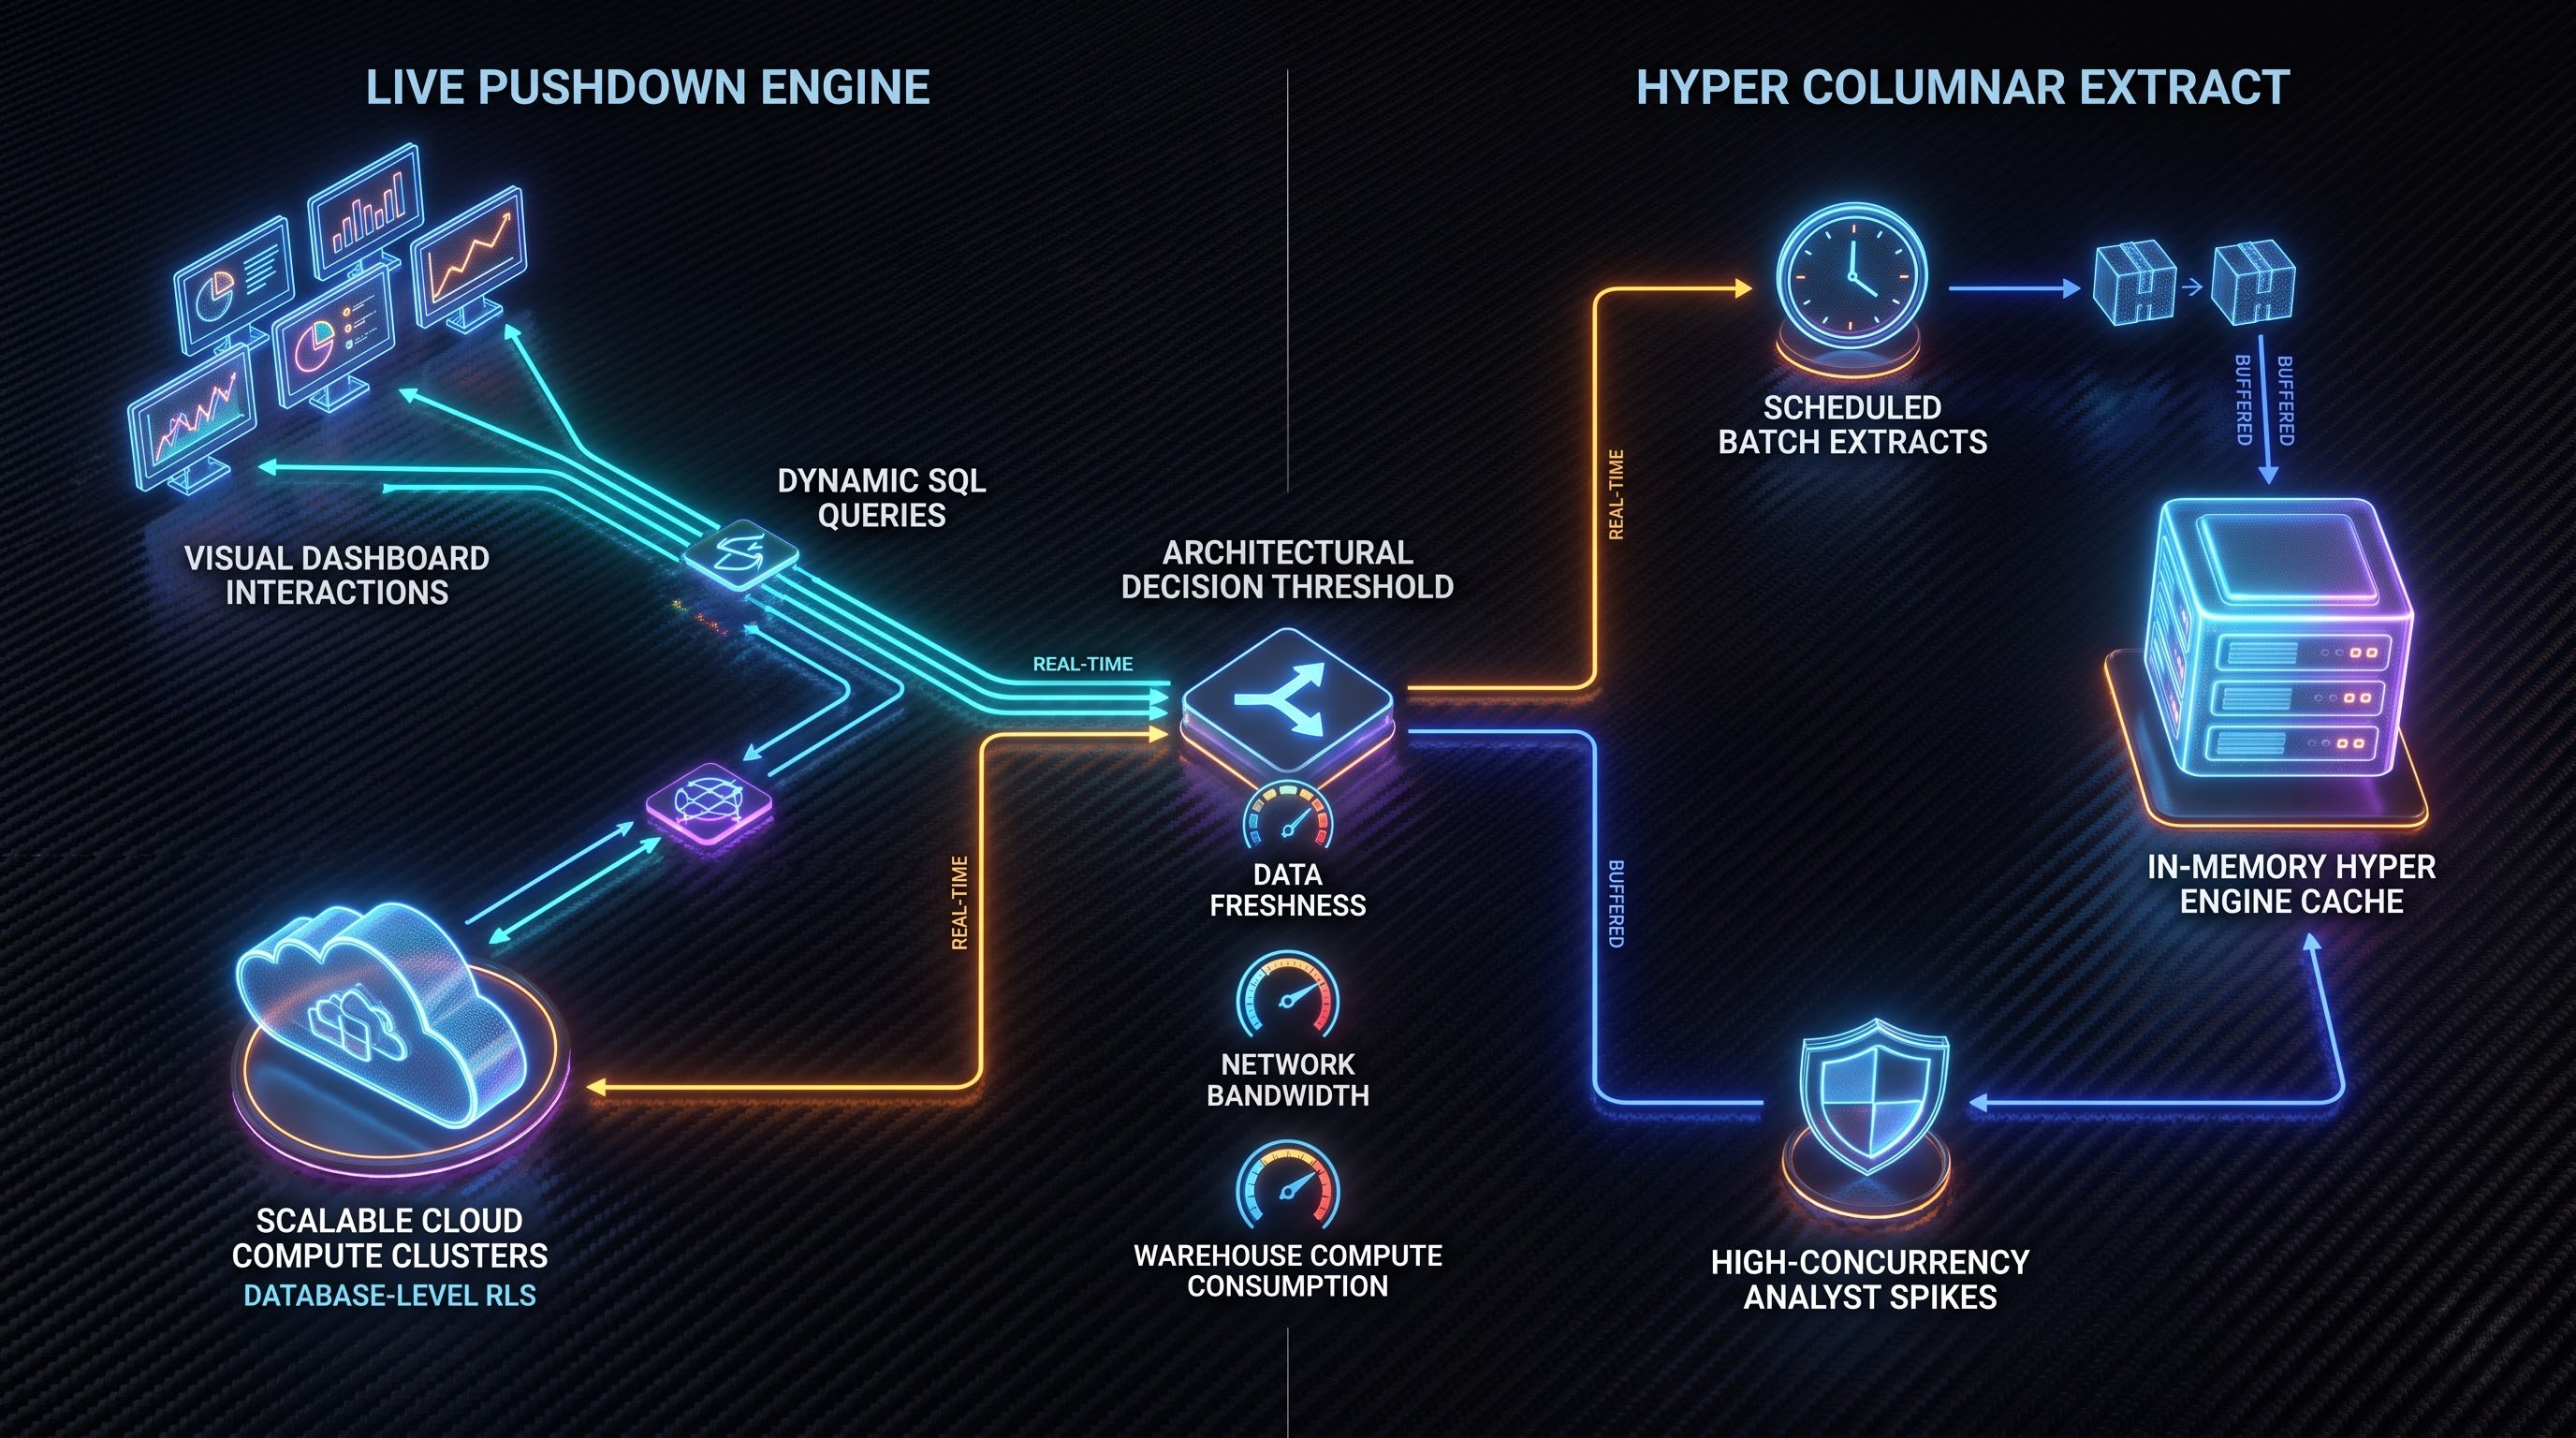
For live connections, data remains in cloud data warehouses and distributed query engines. Every time a business user clicks on a dashboard, traverses drill paths, or changes filters, Tableau translates these visual actions into native SQL queries that run directly against cloud compute engines.
Live connections are needed when:
Freshness Requirements are Absolutely Critical - Operational dashboards, supply chain monitoring, fraud detection systems all require real-time freshness which cannot be met by exact refresh schedules.
Data Volumes Beyond Practical Extract Size Hundreds of millions or billions of rows of transactional data would require too much network bandwidth and disc space to be included in Tableau extracts.
Row-Level Security Policies Enforced in the Database: The modern hyperscale data warehouse applies row level and column level security policies in the database engine. Live connections ensure that Tableau respects these entitlements at the database level.
The drawback of live connections is that they eat up cloud compute resources. If hundreds of business analysts are analysing data on Tableau dashboards that do live queries against big warehouses, the organization may incur a lot of extra cloud computing costs.
The Hyper Extraction Pattern
Tableau Hyper is an in-memory columnar analytical engine designed for fast aggregation and slice and dice exploration. Extracts pulled from the cloud repository stay as local Tableau Server or Tableau Cloud extracts.
Extract patterns are more useful when:
Complex analytical modelling causes live query latency: exploration of live data warehouses can be hindered by highly normalised relational schemas, multi-table joins, and complex string processing. Shifting that analytical processing to the pre-aggregated Hyper engine can help off-load that work into a scheduled batch process.
Protect production warehouses from concurrency spikes: If you have thousands of line-of-business analysts opening the same dashboard every morning, caching that data in an extract can spare your cloud data warehouse from those concurrency spikes.
Use-cases for offline and edge analytics: extracts can decouple the analytics workloads from the corporate network
The costs of extracts are staleness plus synchronisation overhead. Most pragmatic data teams gravitate toward a hybrid of live pushdowns to foundational high volume dimensional reporting plus analytical extract for heavy lifting exploratory processes. Structured online tableau training must include a solid grounding in these precise optimisation workouts and LOD calculations so that developers do not inadvertently create bottlenecks in the warehouse.
AWS & Tableau: High Throughput Analytics and Data Lake Federation
AWS provides a wide range of analytical engines including relational database management systems, massive parallel processing warehouses, and serverless data lake query services. The secret to a successful enterprise Tableau strategy is identifying use cases that best fit around analytical workloads, throughput requirements, and data latency tolerances.
Optimized Data Warehouse Federation for Tableau
Amazon Redshift is the preferred analytical database for thousands of enterprises using Tableau dashboards with AWS. To ensure sub-second response from Tableau visualizations, it is necessary to optimize the schema of Amazon Redshift to reflect Tableau’s analytical operations.
The first optimization step is to define sort and distribution keys according to the most common dimensions used in Tableau visual queries. Most Tableau queries use WHERE clauses to apply filters, GROUP BY operations, and joins to dimension tables. Therefore, it is best to reserve high-cardinality columns for the join keys and use columnar storage to store frequently accessed measures. The second optimization step is to define compound sort keys based on the most frequent combination of dashboard filters. Lastly, it is advisable to use materialized views and concurrency scaling to reduce the amount of direct queries from Tableau to Amazon Redshift. If the enterprise has analytics users who use Tableau during morning hours concurrently, it might be advisable to provision Redshift Concurrency Scaling to ensure that there is no performance degradation due to too many queries.
Unlocking the S3 Data Lake with Amazon Athena
For companies which store raw logs, clickstream data, or IoT payloads in Amazon S3 buckets, Amazon Athena offers serverless Presto/Trino querying directly over open file formats.
Partition pruning
Queries sent from Tableau to Athena which do not specify partitions will scan entire S3 buckets, resulting in exorbitant costs and sluggish dashboards. The partitions in the underlying S3 buckets which Athena queries must match the filters exposed in Tableau. To optimize performance, dashboards should be designed to ensure that Tableau’s mandatory filters match Athena’s partitioning scheme, including year, month, day, or business unit.
File format conversions
Queries sent from Tableau to Athena which traverse raw text or JSON documents will experience significant latency. To allow Athena to scan only the columns specified in the Tableau workbook, it is best to convert raw S3 files to a columnar storage format such as Apache Parquet or Apache ORC.
Enterprise security and IAM federation
The deployment of Tableau on AWS requires direct federation with AWS identity and access management. Hardcoded database credentials embedded in Tableau workbooks should be eschewed in favor of IAM roles, OpenID Connect assertions, and AWS Secrets Manager. This allows for the production of time-limited database credentials which let analysts query Redshift or Athena with the least privilege. All user activity in Tableau is then logged in AWS CloudTrail for auditing purposes.
Azure and Tableau: Unified Enterprise Modeling and Identity Convergence
Microsoft Azure is one of the leading platforms in corporate IT with extensive capabilities for enterprises that are built on Active Directory, Office 365, and other Microsoft products. In it, Tableau’s implementation requires a strategic approach that considers not only visual analytics but also Microsoft’s own technologies for user identity and data storage.
Using Azure Synapse Analytics and Fabric
Azure Synapse Analytics and Microsoft Fabric represent Microsoft’s commitment to the concept of universal data lakehouses that house relational data warehouses, data lakes with Spark processing, and real-time analytical functions.
Dedicated SQL Pools vs. Serverless Exploration: To serve corporate dashboards with analytical information visualized in Tableau for executives and managers at all levels, connecting Tableau to Azure Synapse Dedicated SQL Pools makes sense: it will provide reliable and consistent performance due to allocated and dedicated resources. However, when it comes to exploring data lakes, connecting Tableau to Synapse’s Serverless SQL will be more cost-effective and flexible since no additional resources are required for query execution.
Result-Set Caching: Using the result-set caching technology in Synapse will allow frequently changing dashboard filters to be accessed faster: only one query execution is required per changed filter, which will then be immediately available to Tableau users.
Azure Databricks as the High-Performance Compute Engine
Many Azure enterprises have adopted Azure Databricks as their primary computational engine for data transformation, machine learning workloads, and semantic modeling. The option to connect Tableau to Databricks SQL Warehouses is a great analytical experience.
Photon Engine Utilization: Queries sent from Tableau to Databricks SQL are accelerated by the vectorized C++ Photon execution engine, dramatically accelerating performance on aggregation functions over billions of rows.
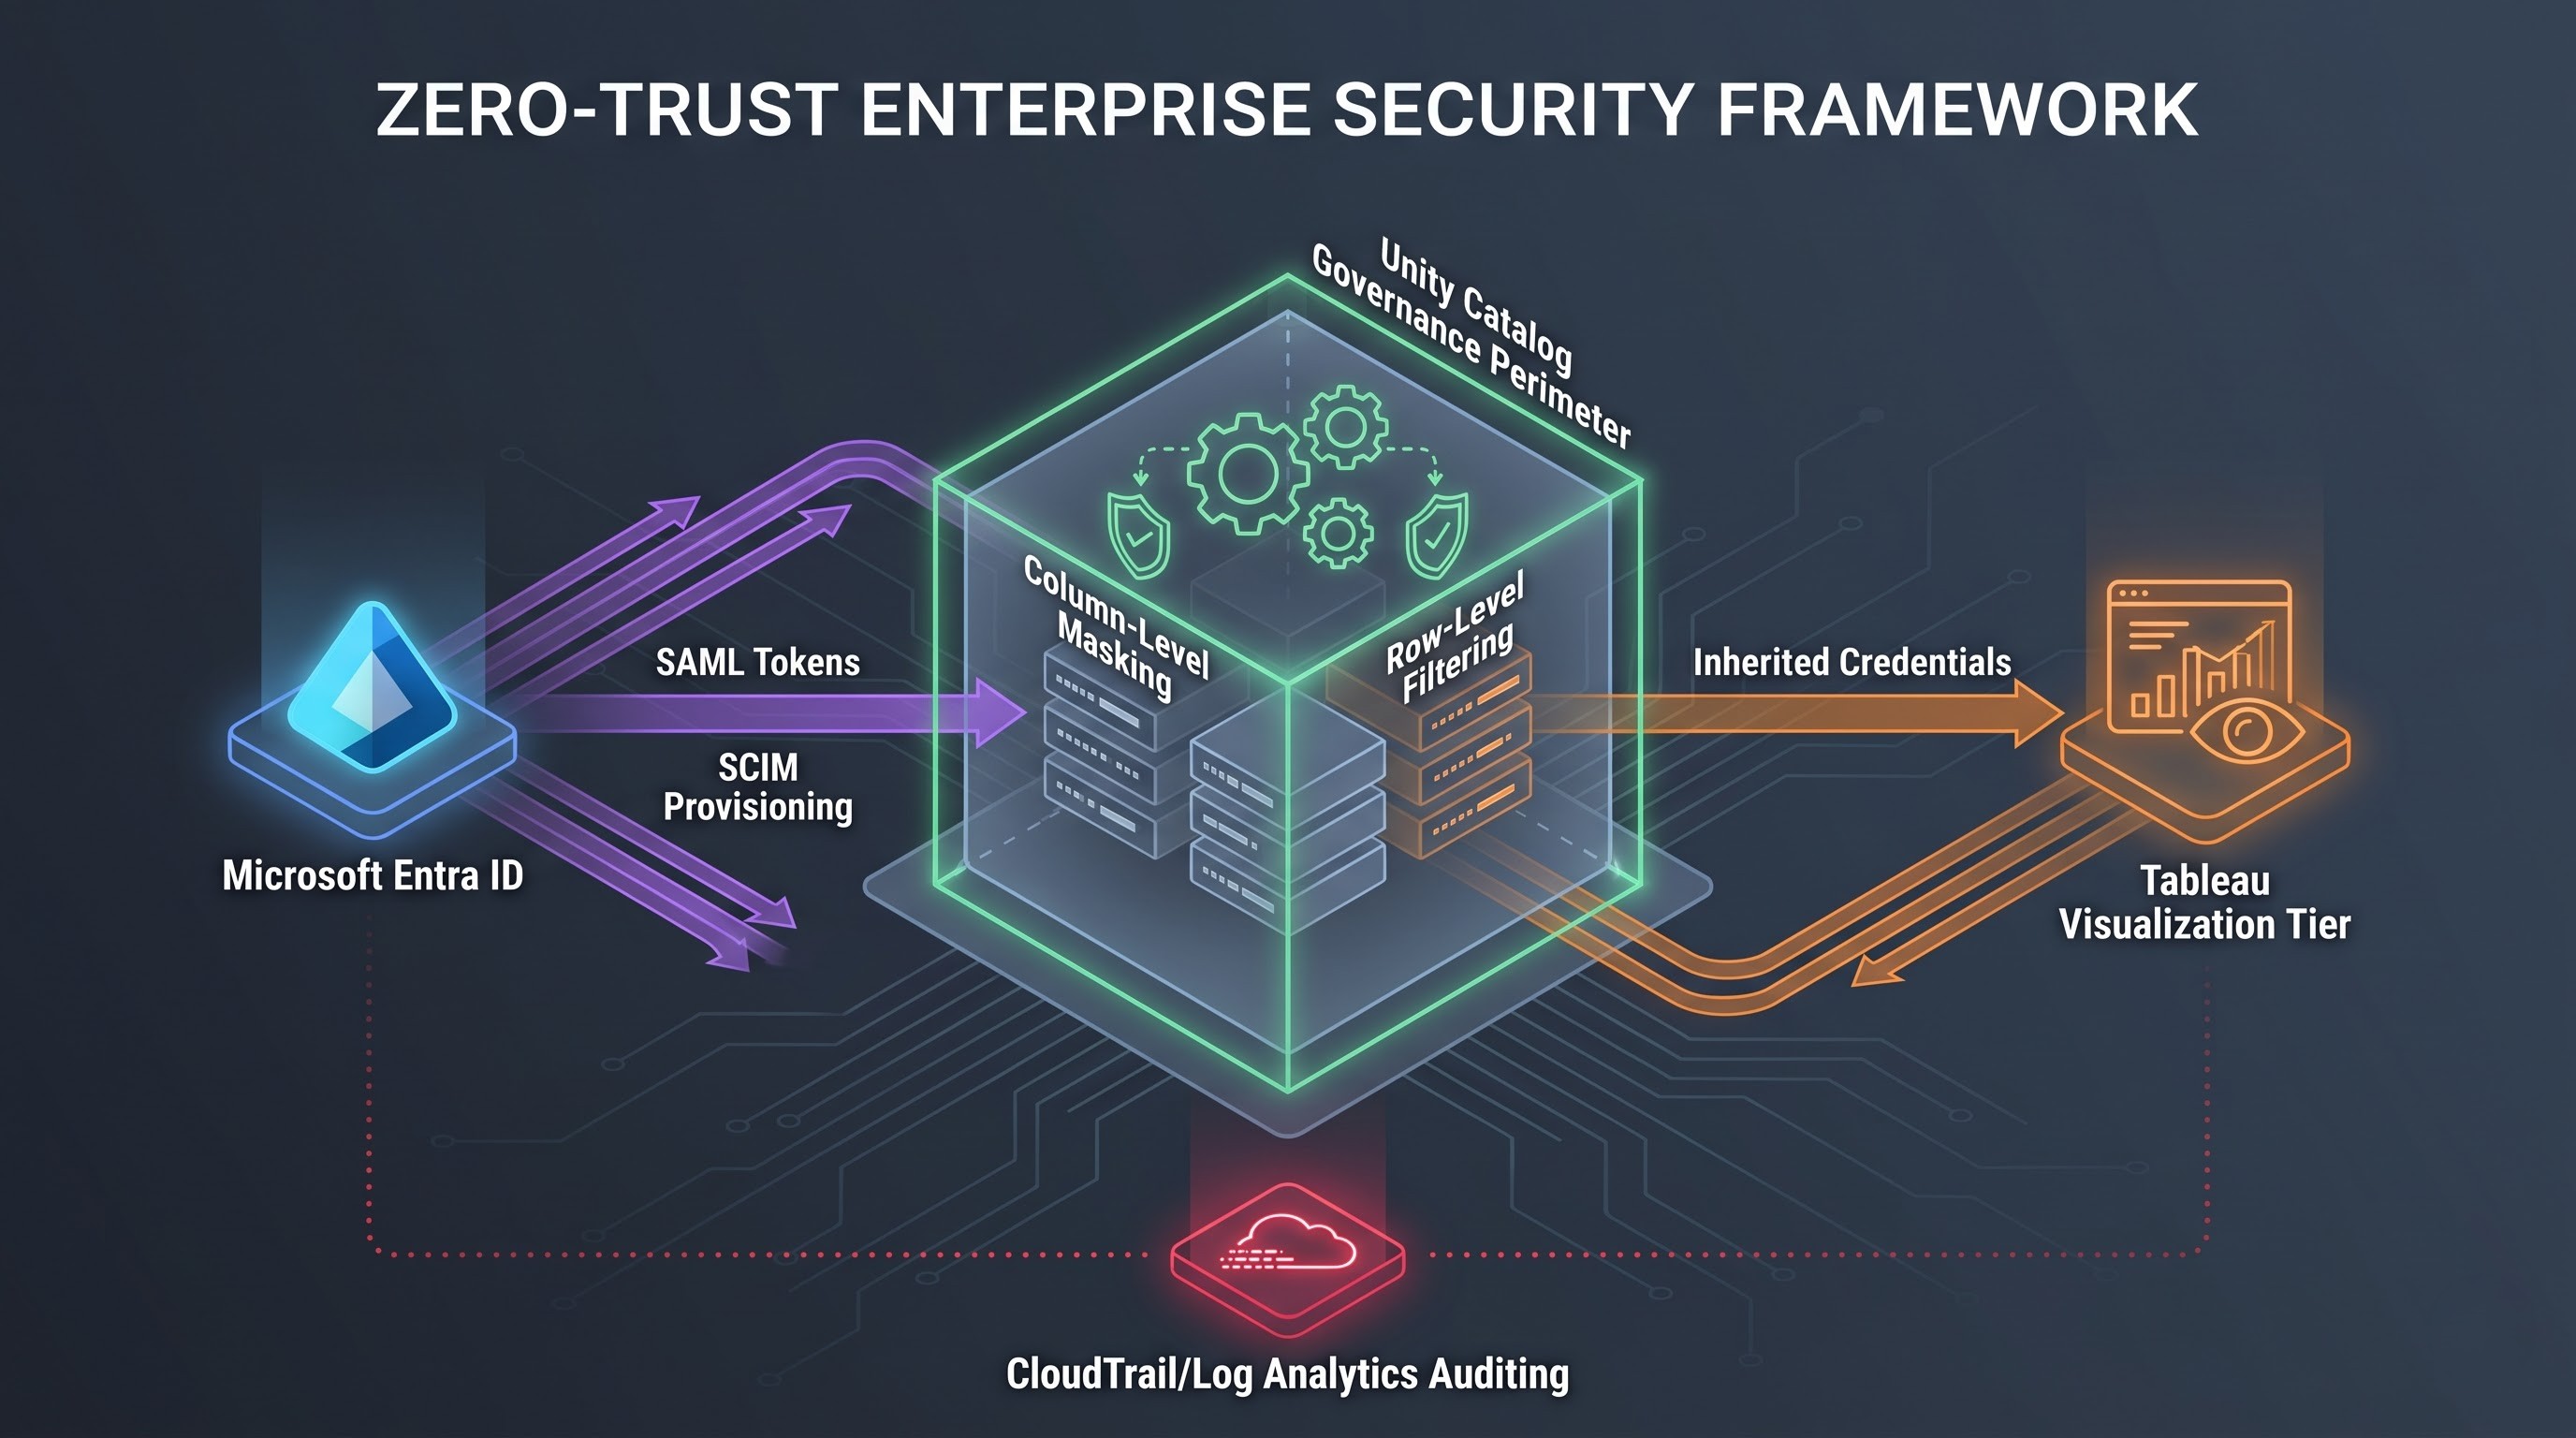
Unity Catalog Integration: Unity Catalog ensures centralized access control, data lineage, and auditing across Azure data assets. Queries sent from Tableau to Azure Databricks are protected with Unity Catalog's column masks and row filters so that no sensitive information is exposed at the visualization tier.
Single Sign-On and Entra ID Governance
The best reason to run Tableau on Azure is to synchronize user management with Microsoft Entra ID (formerly Azure Active Directory).
SAML and SCIM Automation: Configure the System for Cross-domain Identity Management alongside SAML-based single sign-on to automatically provision and de-provision Tableau users, synchronize security groups, and enforce conditional access policies.
Multi-Factor Authentication and Network Boundaries: By anchoring Tableau authentication in Entra ID, organizations can enforce multi-factor authentication, restrict access based on geographic location or device health, and ensure visualization access complies with corporate endpoint management mandates.
Google Cloud Platform and Tableau: Unbounded Scale and Real-Time Telemetry
Google Cloud Platform offers a compelling option for data-intensive enterprises, with BigQuery analytics warehouse representing a serverless scalable alternative for petabyte-class analyses. When combined with Tableau, this architecture allows organizations to consume and analyze unprecedented volumes of information without needing to manage the database infrastructure itself.
BigQuery Performance and Cost Optimization Strategies
BigQuery decouples compute from storage, charging either based on bytes scanned per query or by reserving slots for execution capacity. Because Tableau generates dynamic SQL for every visualization, unoptimized dashboards can easily lead to expensive full-table rescans.
Partitioning and Clustering Alignment: Any analytical table consumed by Tableau should be partitioned by ingestion date or integer ranges and clustered by up to 4 high-cardinality dimensions that analysts will use as filters. When a Tableau user selects a specific customer cohort or regional segment, BigQuery will use the clustering metadata to eliminate unneeded blocks from the query, dramatically improving performance and reducing costs.
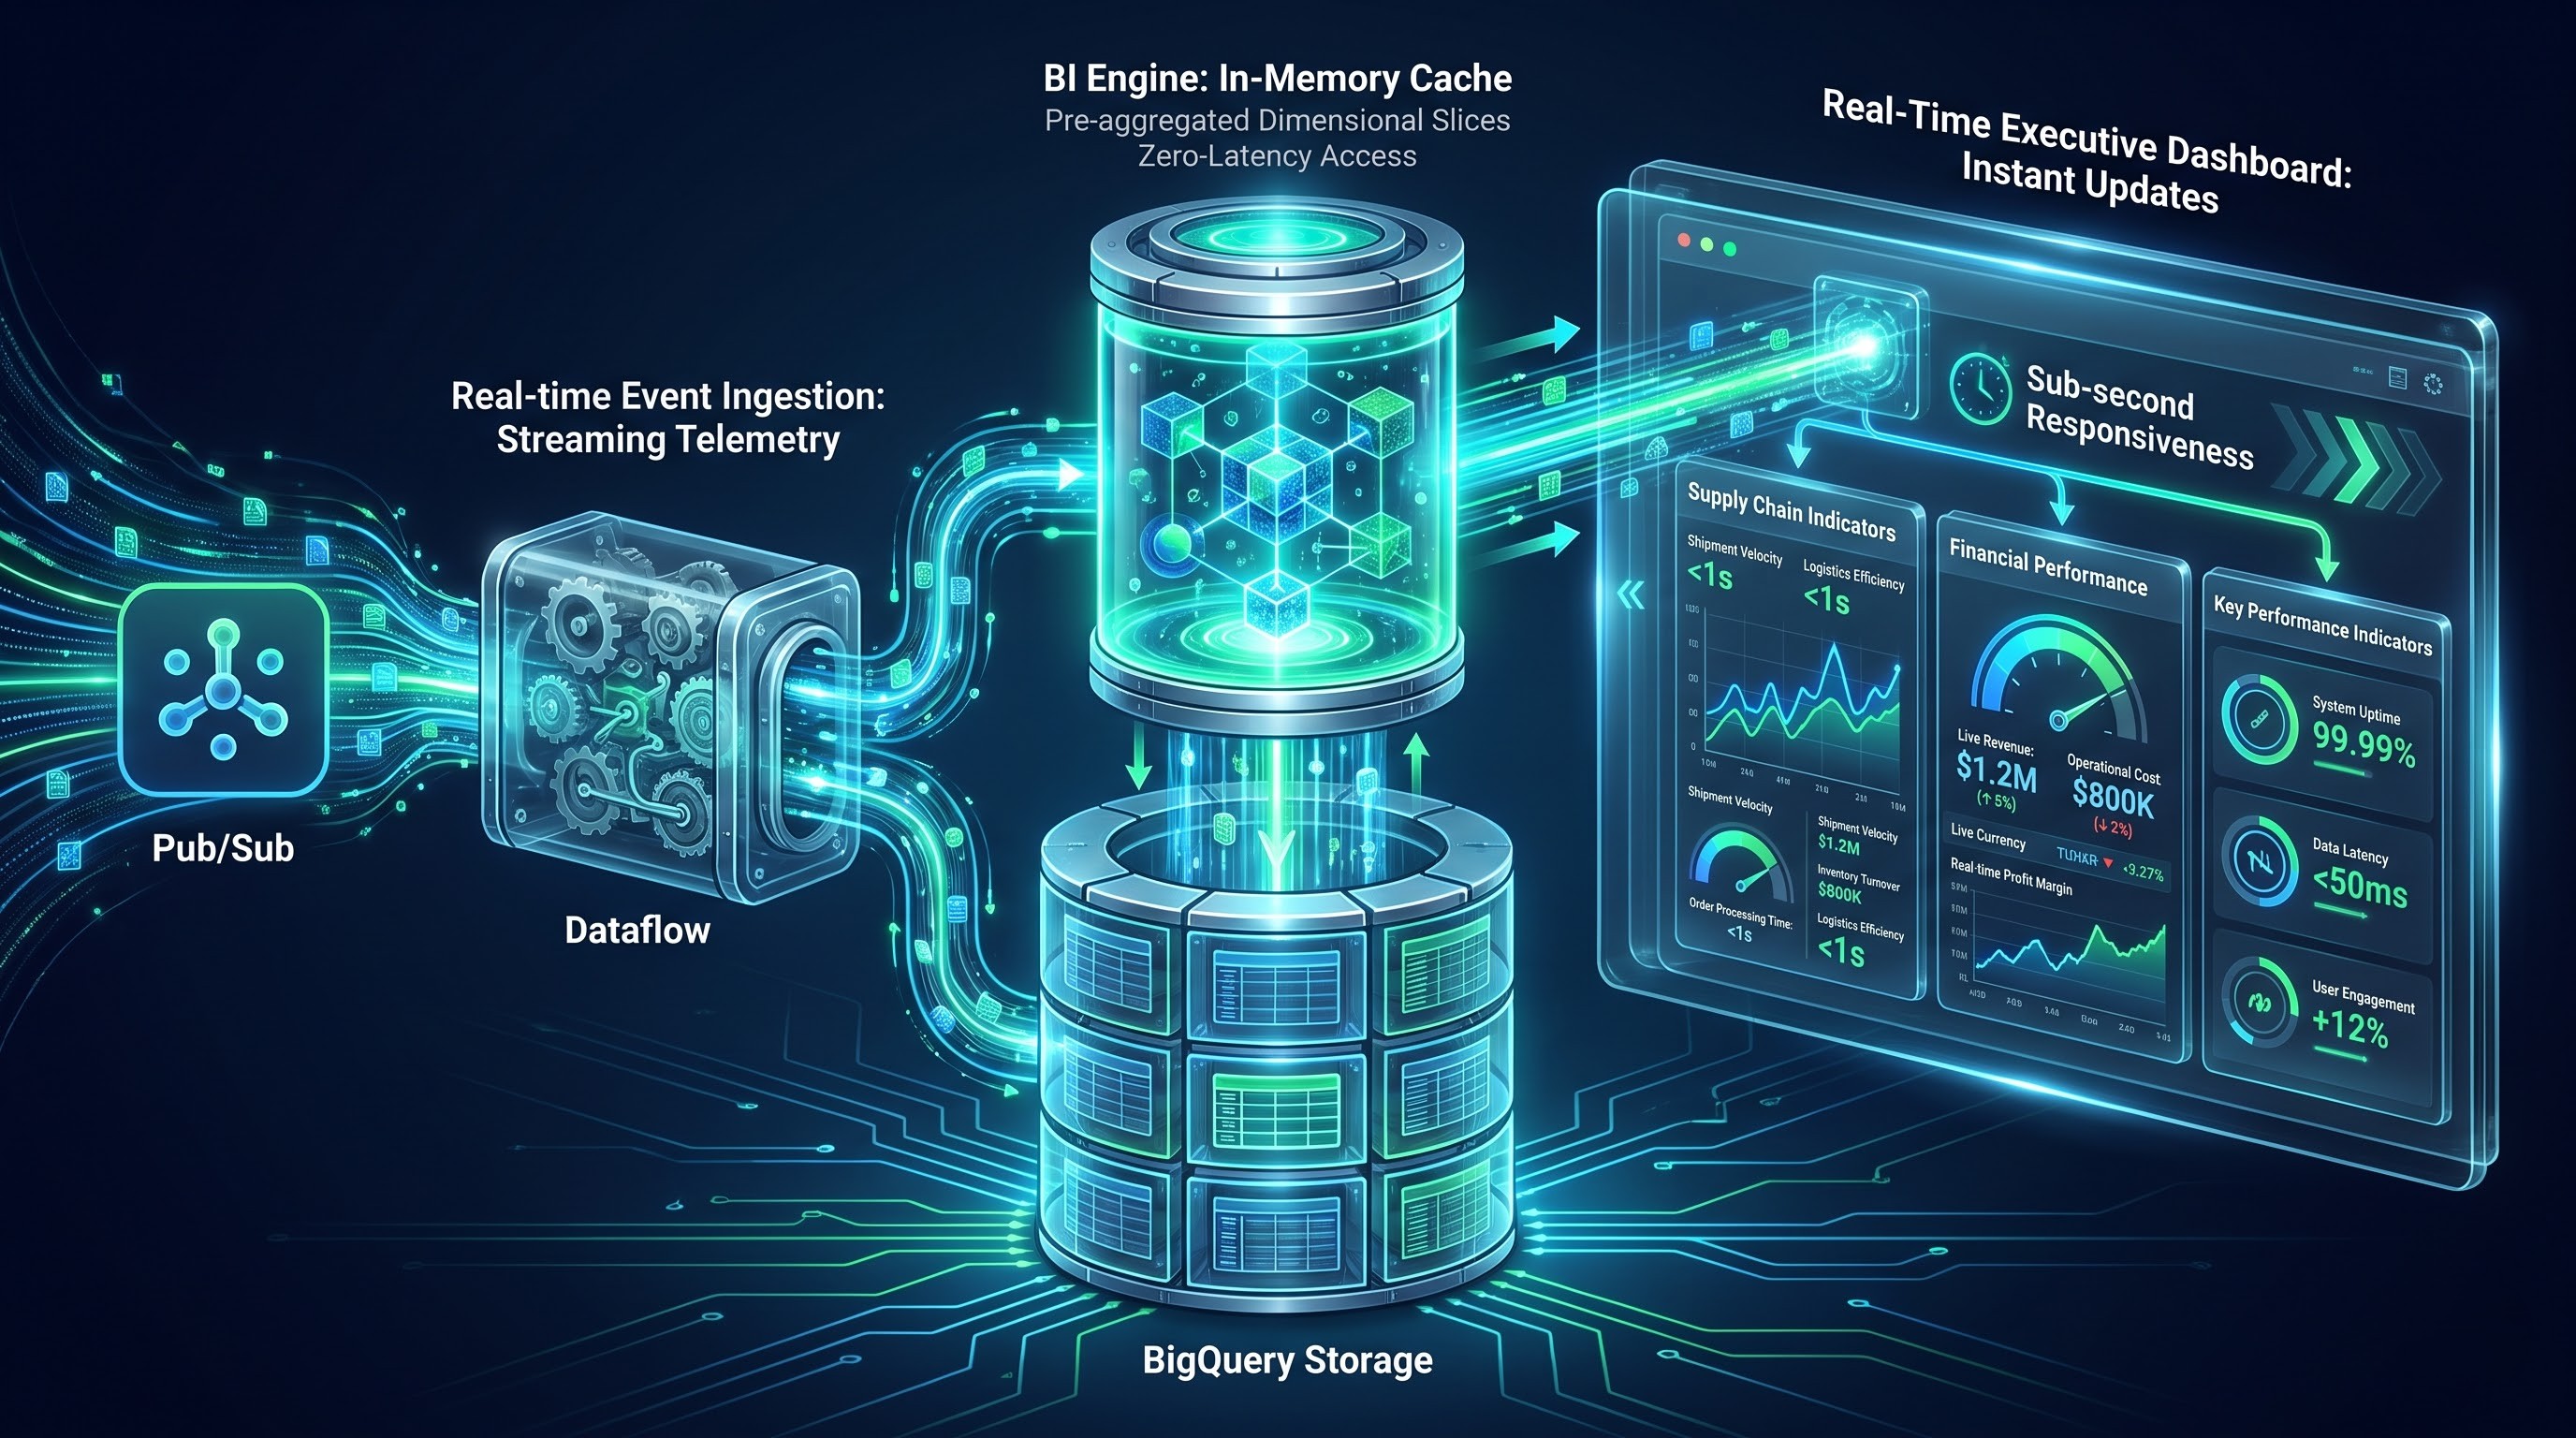
BI Engine Acceleration: Google Cloud provides BigQuery BI Engine, an in-memory analysis engine that accelerates visualization tools like Tableau. By reserving BI Engine memory capacity, organizations enable caching of frequently accessed dimensional slices and aggregations. Tableau queries executed through the BI Engine have direct access to the in-memory cache, eliminating disk access latency.
Materialized Views and Scheduled Queries: For clickstream analysis or massive event log analysis, data engineers should create materialized views within BigQuery. BigQuery will automatically route appropriate Tableau queries to the materialized views, but even when a user writes a query directly against the base table, the materialized view will provide a performance shortcut.
Streaming Ingestion to Executive Dashboards
Streaming data ingestion is one of Google Cloud's core strengths, using Google Cloud Pub/Sub and Dataflow to stream directly into BigQuery storage. By establishing connections between Tableau and BigQuery streaming tables, organizations can enable near-real-time executive dashboards that provide situational awareness regarding marketing attribution, infrastructure issues, or supply chain bottlenecks with only seconds of latency.
Google Cloud IAM and Service Account Security
Establishing connections between Tableau and GCP requires careful IAM configuration. For shared executive dashboards that require automated updates, enterprises should configure GCP Service Accounts with appropriate IAM scopes so that the dashboard can only access the specific dataset. For self-service exploration, organizations should configure OAuth authentication so that every analyst's GCP credentials determine what datasets, tables, and views they can see.
The Multi-Cloud Reality: Architecting a Cohesive Visualization Ecosystem
Global enterprises tend to operate in multiple public clouds, whether due to mergers and acquisitions, regulatory requirements, or operational necessities. As a result, an organization's operational data may reside in AWS, Azure, and Google Cloud simultaneously.
The Anti-Pattern of Cross-Cloud Federation
When faced with the multi-cloud reality, an initial reaction might be to use Tableau's cross-database join capability to combine an Amazon Redshift table, an Azure Synapse table, and a Google BigQuery view within a single workbook.
This represents an architectural anti-pattern that will dramatically impact performance. A cross-cloud join will cause Tableau to extract large record sets from all three clouds, perform joins in-memory within the Tableau process, and return results. This will consume enormous bandwidth and incur significant egress charges from all cloud providers.
Strategic Alternatives for Multi-Cloud Visualization
To enable multi-cloud analytics without sacrificing performance, consider these architectural options:
Hub-and-Spoke Domain Dashboards: Instead of trying to join across clouds, organize dashboards around business domains. Let finance analytics run against Azure, customer telemetry analyze GCP BigQuery, and logistics operations query AWS Redshift. Cross-cloud consolidation should happen at the executive portal level rather than within a single workbook.
Unified Semantic Layers and Data Virtualization: Consider implementing semantic data virtualization products that sit between the cloud and Tableau. These products can unify data across clouds, distributing compute work to the respective cloud vendors while only returning the final results to Tableau.
Decoupled Metric Stores: Consider implementing a metric store pattern, where business logic (calculations, definitions) is stored in a shared code repository accessible to all clouds. Tableau would query the metric store instead of querying the underlying cloud data warehouse.
Governance, Semantic Consistency, and Data Lineage
Granting thousands of business users with self-service visualization tools represents a significant operational risk if the underlying metadata definitions become inconsistent or if security rules are circumvented. A comprehensive Tableau cloud strategy should include governance and cataloging capabilities.
Centralized Semantic Layers via Tableau Published Data Sources
To prevent independent calculation of metrics within different departments, organizations should mandate the use of Tableau Published Data Sources. These data sources create a semantic layer abstraction:
Complex joins, aggregations, and optimized-SQL calculations get certified by data engineers and locked down within a published data source
Standardized metadata definitions, calculated fields, and color palettes get consistently applied
Business analysts work only with certified data sources, ensuring that a metric like active monthly customers will return the exact same number regardless of who built the dashboard.
Integrating Enterprise Data Catalogs
Leading organizations connect Tableau metadata with enterprise cataloging platforms like Microsoft Purview, AWS Glue Data Catalog, Google Cloud Dataplex, or standalone metadata platforms.
End-to-End Lineage Tracking: Using the Tableau Metadata API, data stewards can trace the lineage of a metric on an executive dashboard, following it through Tableau calculations, cloud warehouse views, ETL orchestration, and ultimately back to the originating transactional database.
Automated Impact Analysis: When a database administrator in AWS or Azure modifies a column definition or removes a staging table, catalog integrations can automatically identify all affected Tableau workbooks, enabling communication before production issues arise.
Performance Optimization and FinOps for Visual Analytics
Deploying Tableau against hyperscale cloud platforms means that the performance characteristics of a visualization dashboard directly impact cloud spend. An inefficient dashboard that performs full-table rescans of millions of records every morning represents an unbudgeted operational expense. Developing a FinOps practice around visual analytics ensures performance and cost predictability.
Dashboard Design Principles for Cloud Efficiency
The layout and configuration of a Tableau workbook directly impacts the performance of the underlying cloud queries:
Pruning Marks and Cards: Every card and visualization within a Tableau dashboard generates an individual analytical query. Dashboards with dozens of visualization cards will overwhelm the cloud analytical engine. Group related metrics into meaningful visualizations to reduce the number of queries.
Strategic Filter Architecture: Filters that contain thousands of text values represent high-cardinality dimensions that will cause Tableau to perform scanning queries against the cloud database before displaying filters to the end user. Use parameterized values, relative date filters, and action-based drilldowns instead of open text filters.
Guided Exploration Pathways: Use design patterns that make summary metrics available on landing pages, while detailed transactional tables get displayed only when an analyst drills into a particular metric, reducing overall query expenditure.
Monitoring, Auditing, and Cost Allocation
To maintain control over the visualization environment, data leadership needs to implement ongoing observability:
Tableau Server and Cloud Repository Analysis: Use Tableau's administrative tools and performance recording features to spot slow-performing workbooks, identify heavy dashboard users, and analyze extract refresh patterns.
Correlating Cloud Query Logs with Dashboard Activity: Tag Tableau connection sessions with application metadata so that data platform teams can join Tableau query logs with cloud query audit trails from AWS CloudWatch, Azure Log Analytics, or GCP Cloud Logging. This enables understanding which departments, workbooks, and users are responsible for cloud query costs, while also enabling internal chargeback and cost allocation procedures.
Strategic Implementation Framework
Success with Tableau and the major cloud vendors requires a strategic implementation framework.
The process should begin with an assessment of current analytical needs, identifying what data assets reside in what clouds, and understanding refresh schedules and regulatory requirements. From this baseline, organizations should develop connection patterns - live pushdown for large-scale, secure warehouses, and managed Hyper extracts for high-concurrency exploration scenarios. Security architecture should be standardized around enterprise identity providers, decommodifying database credentials in favor of single sign-on authentication and automated governance. Finally, a culture of performance responsibility must be cultivated inside the company, educating dashboard designers about the relationship between visualization complexity and cloud costs. Signing up for an industry-synchronized tableau online course will ensure that analytical teams create production-grade dashboards, correctly govern semantic layers, and avoid multi-cloud analytical blind spots without bloating the company’s monthly infrastructure spend.