
Tableau Pulse: Transforming Business Insights with AI
Last updated on Nov 13, 2026

Introduction to Business Intelligence and its Evolution
For decades the focus of the enterprise software landscape has been on the collection, storage and reporting of huge quantities of data about organisations. Companies built big data warehouses, created elaborate data pipelines and produced thousands of dashboards to capture everything they did. Despite all these huge investments in data infrastructure, there was a constant bottleneck: human capacity. Old-school business intelligence tools were powerful, but required users to have specialised technical skills, navigate complex visual hierarchies, and actively log into centralised applications to search for answers. There was a lot of information, but often useful insights were buried under layers of filters, dimensions and complex metrics.
The traditional dashboard paradigm assumes that stakeholders have both the time and technical skills to interpret complex data representations as required. The reality is business today is moving at a breakneck speed. Executives, managers, front-line workers, and sales leaders rarely have the bandwidth to investigate multi-tabbed reports every morning to see if key performance indicators are moving in the right direction. The explosion of data and the friction-filled experience of consuming it created a unique imperative for change. Organisations needed to move away from a paradigm of passive reporting, to one of proactive, intelligent and personalised insight delivery.
This is where Tableau Pulse comes in—a reinvention of data experience that bridges that gap, powered by rich artificial intelligence capabilities. Tableau Pulse is deeply integrated into the modern cloud analytics ecosystem and fundamentally changes the way people interact with their metrics. Instead of forcing users to trawl through sprawling dashboards or learn complex query languages, Pulse surfaces custom, contextualised insights into the daily apps where modern professionals already spend their workdays. With rich semantic metrics and generative and adaptive AI, Tableau Pulse transforms static numbers into dynamic, conversational stories that put the power of smarter, faster decisions in the hands of every employee.
The Evolution of Enterprise Data Consumption
To understand fully why Tableau Pulse is such a critical evolutionary step it is instructive to follow the manner in which organisations have engaged with their information assets over the last three decades. In the early days of enterprise computing, reporting was mostly batch-oriented and batch-delivered. Data was guarded by IT departments alone. A business unit that wanted to know their monthly sales performance or inventory turnover would submit a formal inquiry to the data team, wait days or weeks for a custom SQL query to be written, and ultimately get a static spreadsheet or printed report.
Self-serve business intelligence platforms rose in the 2010s, heralded as a huge democratisation of data. Tools such as Tableau enable power users to connect directly to data sources, drag and drop dimensions, and create visual dashboards without coding. The era delivered unprecedented analytical agility, and enabled business analysts and department leads to explore data on their own terms. But as organisations grew, self-service became a source of complications itself. Dashboards blew up. Without strong governance, different teams were creating reports that overlapped and had conflicting definitions, leading to “dashboard sprawl” and a lot of confusion during executive alignment meetings.
Besides, it was still a pull model anyway, self-service or not. The user needed to open an application, find a specific dashboard, select the right date ranges and interpret visual charts. This workflow was intuitive to data analysts and technical folks. For most enterprise workers – sales reps, customer success managers and operational supervisors – opening a complex analytics program felt like an interruption, not an integration. Reporting was pull based, creating friction. Data was often not tracked to avoid issues before they happened, but seen after the crisis had already occurred.
The Core Philosophy of Tableau Pulse
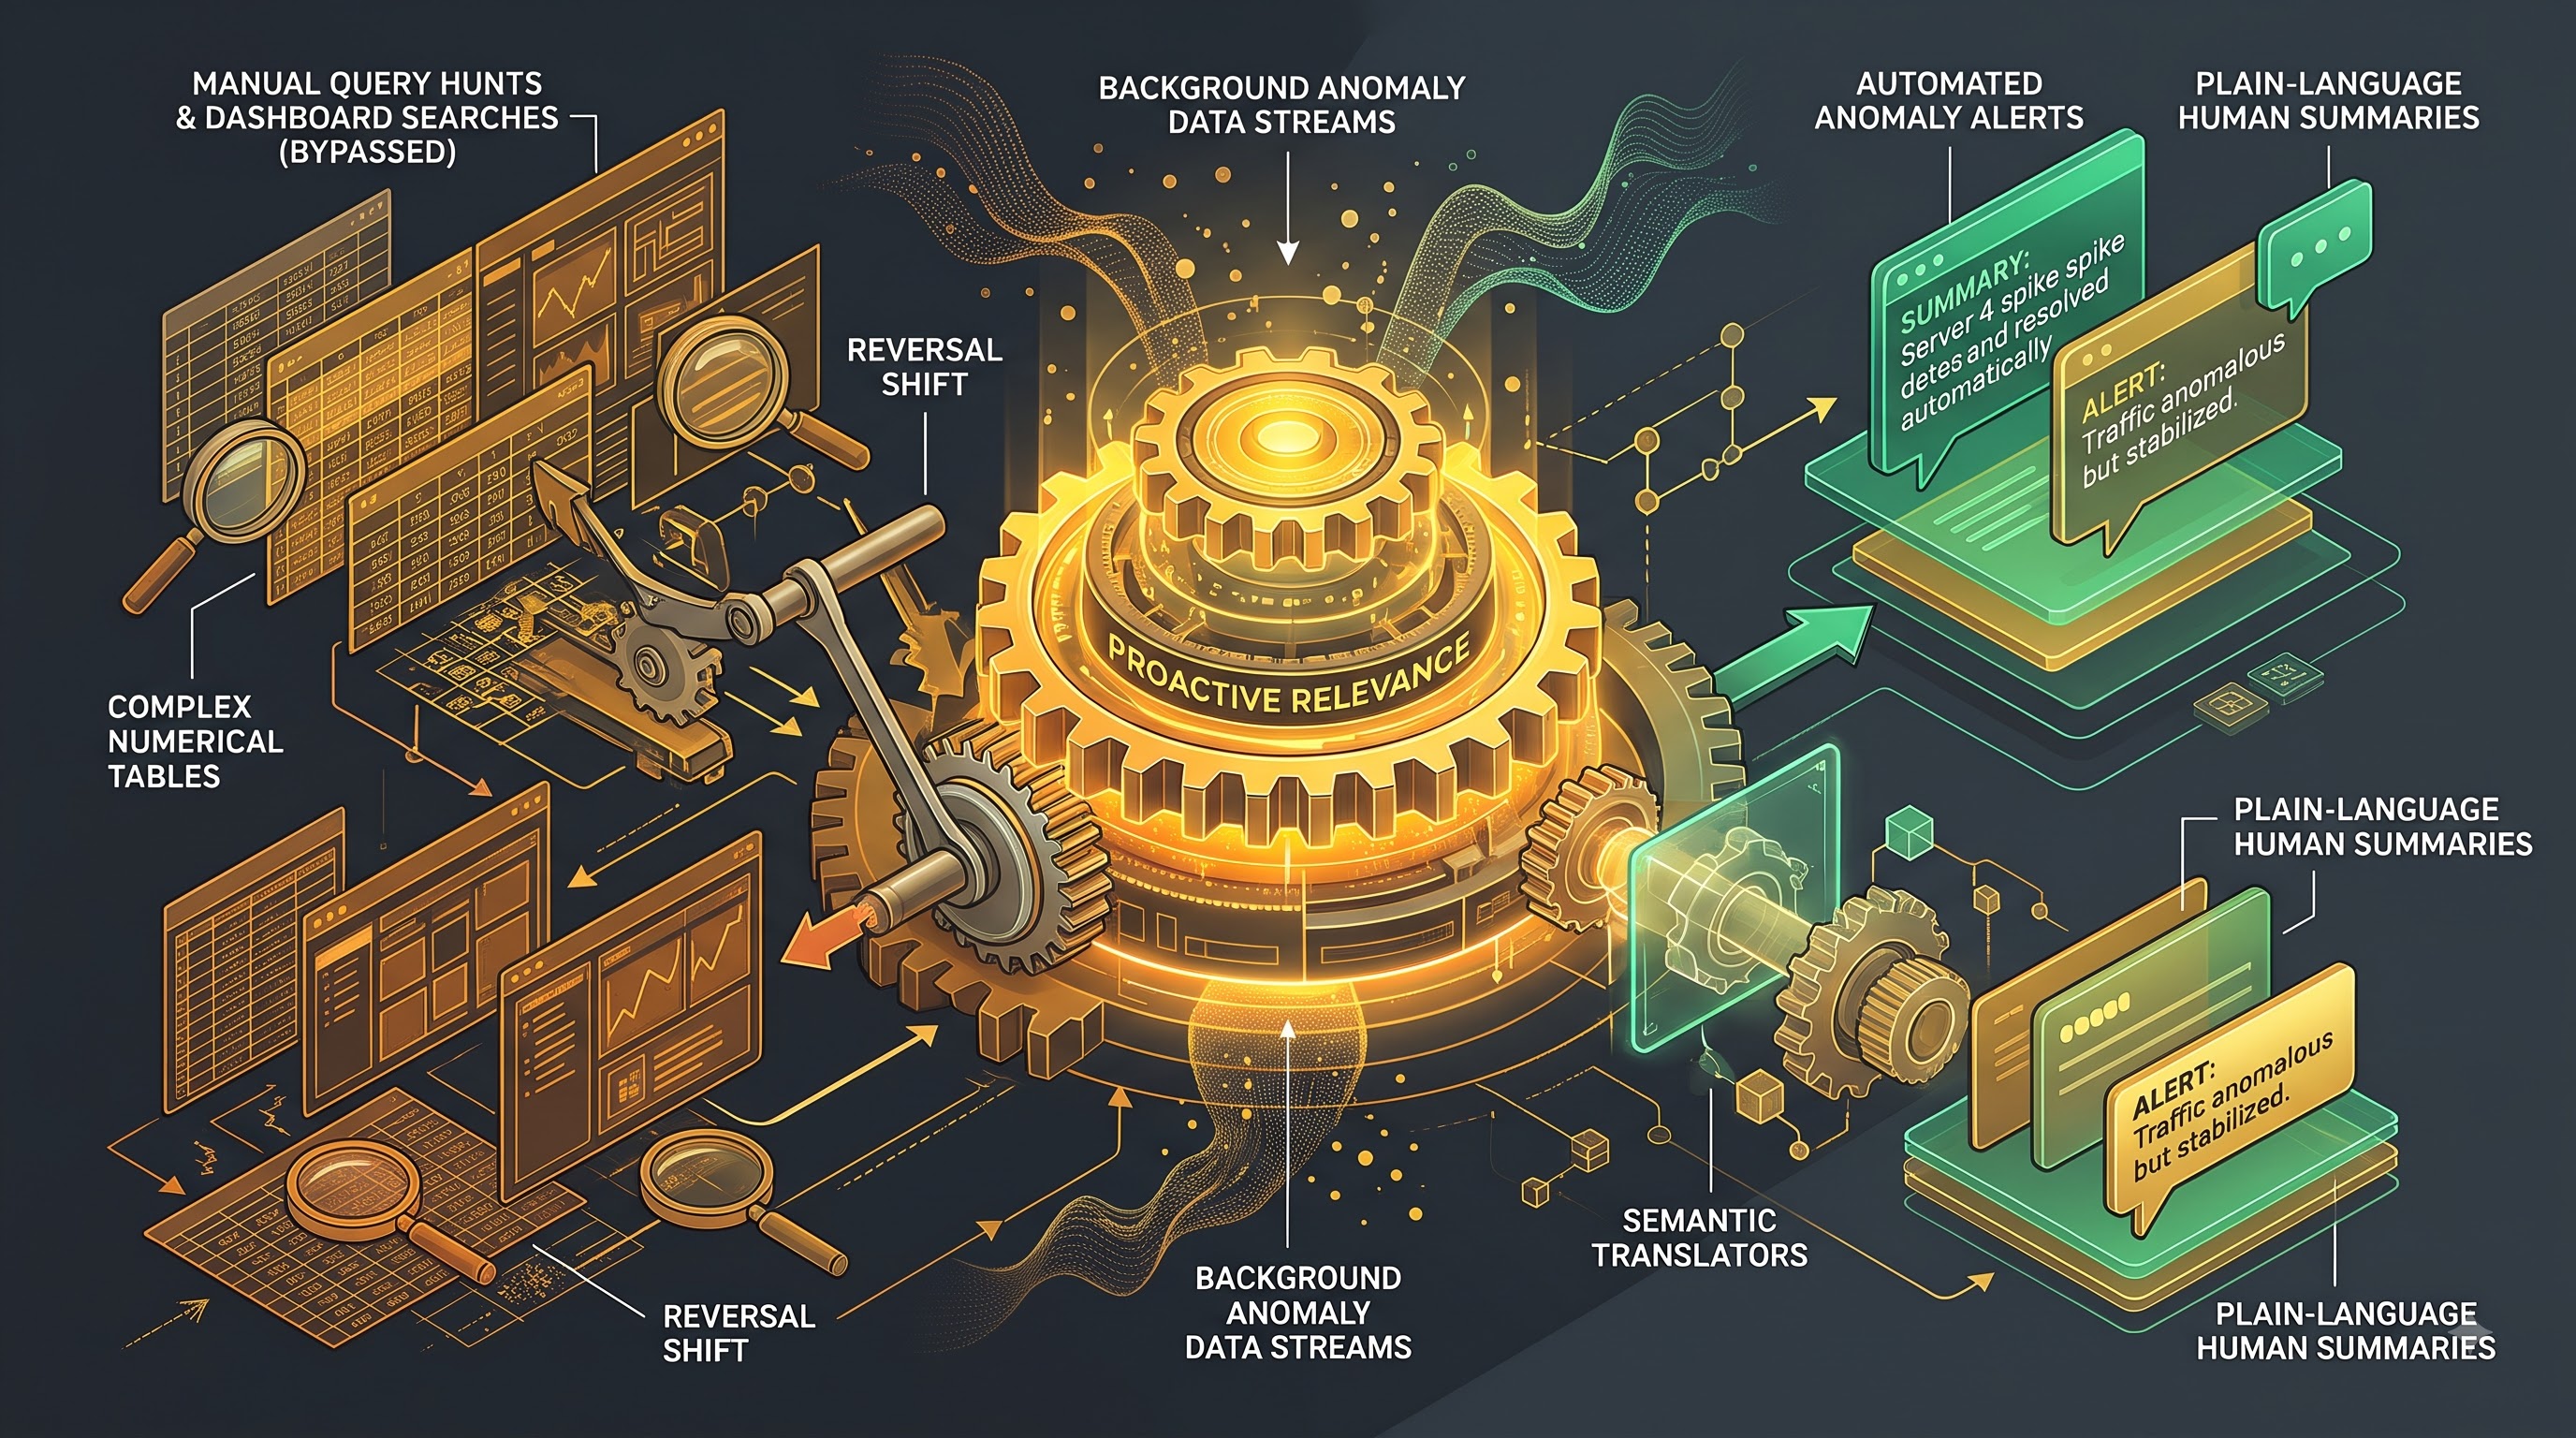
To understand the transformational impact of Tableau Pulse you need to look at the philosophy behind its architecture. Traditional Business Intelligence has always answered the question “What happened ?” by showing historical data in counts, sums and aggregations. Advanced users would sometimes ask “How did this happen?” by cross-filtering across multiple dimensions. But getting to the bottom of the causes, the slippery “Why did it happen?— hours of manual investigation, coordination with data engineering teams and ad-hoc analysis.
Tableau Pulse flips this traditional workflow on its head. The platform is built around the notion of proactive relevance. Pulse monitors pre-selected metrics in the background, rather than waiting for a user to enter a query. “Because the system will automatically detect the big anomalies or positive spikes or negative trends and proactively bring that data to the surface. Switching from pull-based reporting to push-based intelligence means that important changes in business performance will not be missed because a manager forgot to check a certain report.
Tableau Pulse also democratises access to data, removing the need for high levels of visual literacy or analytical training. A typical enterprise might have a CMO or a regional sales director who understands the business implications of a drop in conversion rates, but who might struggle to construct the specific calculated fields that would let him or her isolate the root cause from a complex database. Pulse converts the raw metrics of behaviour into short plain language summaries with intuitive visual explanations. Pulse can connect the technical data analyst with the business decision maker because it uses the language of business instead of the language of the database query. To be proficient with such an analysis tool, it has become common practice to go for tableau classes online.
Today's Business: The Psychology of Decision Making
Another factor to consider when thinking about the value of Tableau Pulse is the cognitive load that modern knowledge workers face. In today’s hyper-connected corporate environment, the moment an employee logs on they are bombarded with notifications, emails, messages and meetings. Expecting these people to monitor complicated analytics dashboards is not only unrealistic, it is counterproductive.
Cognitive psychology tells us humans are bad at finding subtle trends or outliers when presented with a dense array of unstructured numbers. Passive data delivery, as in static grids, means the brain suffers from decision fatigue trying to filter out meaningful signals from normal operational noise. Tableau Pulse is getting around that psychological barrier by being an intelligent cognitive filter. Pulse is the same. We automate the monitoring process and highlight only what matters. For example, a deviation from a seasonal benchmark that is statistically significant. This frees up the user's mental energy to be used for strategic problem solving rather than routine monitoring.
This change impacts the agility of corporations very strongly. When operational teams are alerted to emerging bottlenecks, they can act quickly, while remediation is still cheap and easy. For example, spotting an unexplained dip in server uptime or a spike in customer churn in hours rather than weeks can save a company millions of dollars and protect vital brand equity. Proactive intelligence transforms data from a rear-view mirror scorecard into an active, protective shield for the enterprise.
Architecture & the Trusted Metrics Stack
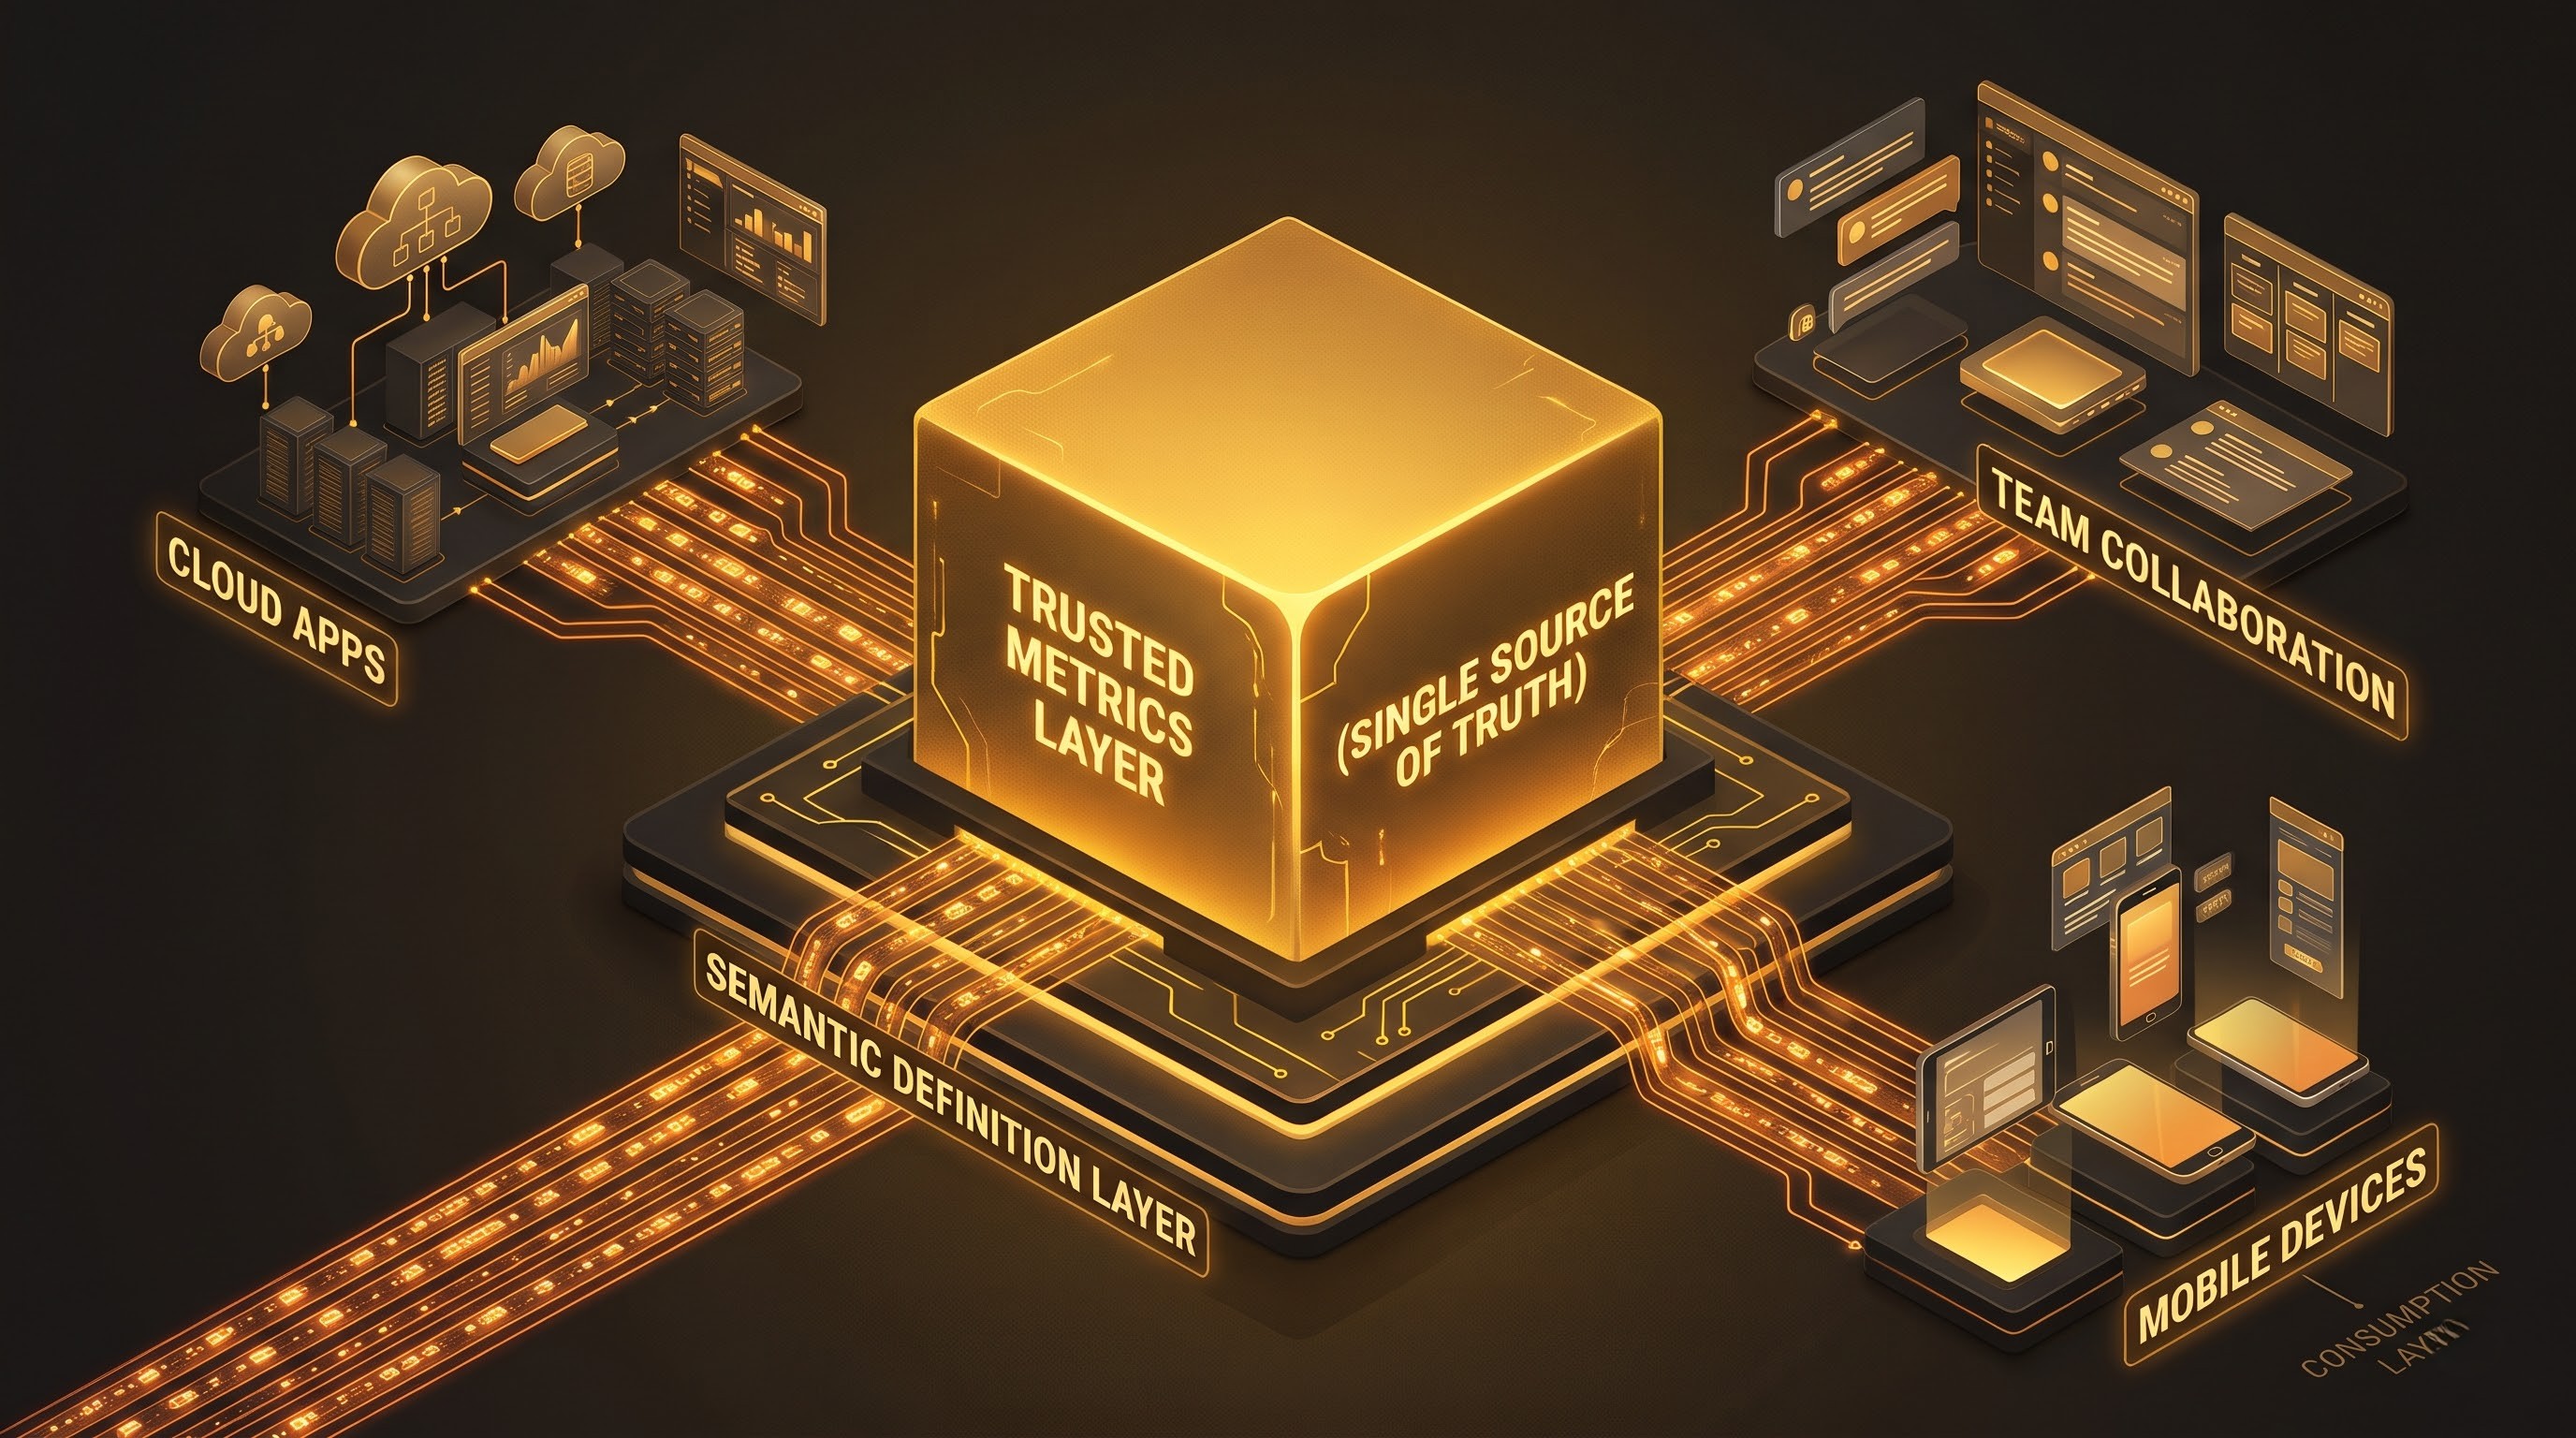
Tableau Pulse is built around a powerful central idea: the metrics layer. For many organisations, data inconsistency has long been a crippling hurdle. If one department calculates “Customer Lifetime Value” or “Monthly Recurring Revenue” slightly differently than another department in executive meetings, you’ll end up with conflicting reports and a lack of trust in your analytics. Tableau Pulse solves this fundamental governance problem by providing a single source of truth.
The metrics layer provides a rich, standardised business context definition of organisational data before any artificial intelligence models get to it. Data engineers and analysts define core metrics (dimensions, time zones, custom calendars, calculation logic) in a governed setting. Once these baseline definitions are established, Tableau Pulse utilises them as the unchangeable baseline for all automated tracking, anomaly detection, and natural language exploration.
This architecture design will provide consistency across the organization. An employee may be looking at a metric inside a dedicated cloud application, getting an automated notification in a team collaboration channel or looking at data on a mobile device – the calculation behind it is exactly the same. Tableau Pulse separates data governance and semantic definition from the end-user consumption layer, ensuring that democratisation doesn’t come at the cost of accuracy or compliance. The most important thing is trust. Leaders can trust that the numbers they are using to make decisions are right.
The Mechanics of Semantic Governance
The modern analytics architecture needs to balance technical flexibility with strong organisational control to deliver a truly reliable single source of truth. In the past governance meant locking down data so tightly that business users were limited to a rigid, pre-approved set of reports, killing exploratory curiosity. The loose governance resulted in a wild-west situation, with each department creating its own competing set of metrics.
Tableau Pulse’s semantic modularity is a new vision for governance. Data architects define the allowable dimensions and breakdown criteria for the core entities such as revenue, orders, active users and cost structures. These definitions include business logic for fiscal calendars, currency conversions, and null value handling. These definitions are reusable building blocks defined once in the metrics layer.
They are the semantic objects that AI models refer to directly when parsing user queries or analysing trends. So the AI summary report on “regional profitability” is using the same underlying calculation as the official corporate financial ledger. Tableau Pulse demonstrates that the enterprise scalability and accessibility for the users to make it simple for them is not mutually exclusive, with governance built into the semantic layer. Strong governance is a prerequisite for safe AI-driven democratisation.
Artificial Intelligence: A Catalyst for Analysis

Artificial intelligence is the engine that enables Tableau Pulse to scale insights across an enterprise. Tableau does not present AI as a standalone novelty but embeds intelligence natively into every stage of the metric consumption lifecycle. The integration is built on three pillars: Automated anomaly detection, natural language summarisation and conversational exploration.
Anomaly Detection and Automated Monitoring
Traditional reporting tools need a human eye to detect anomalies. That anomaly is buried until a regional sales pipeline suddenly drops off on a Tuesday afternoon, at which point someone manually checks the weekly or monthly performance sheets. Through algorithms, Tableau Pulse automates this vigilance with 24/7 monitoring. The platform compares incoming data to historical patterns, seasonality and thresholds set and detects significant changes as they happen. The system immediately alerts to an unexpected deviation -- good or bad -- so operational teams can pivot and address bottlenecks or take advantage of new opportunities without delay.
Plain language summary
Data is only useful when it can easily be understood and acted upon. When a metric changes, Tableau Pulse doesn’t just show you a percentage change, it turns the numbers into a cohesive, natural language story. Using generative AI, Pulse takes complex statistical shifts and translates them into simple, easy-to-read sentences that point out the key drivers of change. Pulse eliminates the need for the user to manually cross-reference multiple dimensions to determine that a decline in total revenue was due to a slowdown in a single product category in the Western region, and instead immediately surfaces the insight in plain text.
Guided Conversation Exploration and Q&A
Static insights are the start of an analytical journey. When given an automated summary of a fluctuating metric, natural follow-up questions are inevitable. Tableau Pulse’s advanced conversational interfaces allow this exploratory impulse. Users can ask questions in normal language, such as comparing performance over time periods, filtering by a specific customer segment, or seeing related metrics side-by-side without having to restart their analysis or manually build new filters. This computer is capable of comprehending the above questions, adjusting its responses, and even generating relevant diagrams using references. Occasionally, establishing a connection between working with raw data and harnessing the power of AI may require some training, which is why most people enroll for a whole tableau course online.
The Technical Integration of Machine Learning and Natural Language
The technology integration of artificial intelligence in Tableau Pulse is done through different technical aspects like statistical time series prediction, anomaly detection using machine learning and large language models (LLM) for natural language generation. All these aspects have a special role to play in converting raw data into a readable form from the database transactions.
The monitoring engine is based on time-series algorithms. The models are constantly looking at the incoming data feeds to determine what is a real signal and what is normal noise. They consider sophisticated cyclical patterns like weekday vs weekend, buying at month-end and holiday seasonality year over year. Whenever one of the incoming data points falls outside the statistical confidence intervals that have been set, the system generates an alert.
If anomaly or interesting trend is found then natural language generation models take over. Instead of filling in templated “mad-lib” style sentences, generative AI generates fluid, context-aware summaries that not only state that a metric changed, but why it changed based on underlying dimensional contributions. With this level of technical sophistication, business users can interact with enterprise data as naturally as they would in a conversation with a knowledgeable human colleague, while abstracting the complex database queries that are happening under the hood.
Embedding Insights into Workflow
One of the biggest obstacles to the adoption of traditional business intelligence has been context switching. “Previously, if an employee wanted to see performance data in the middle of a busy day, they had to stop working, open up a new browser tab, log in to a specialised analytics portal, locate the right dashboard and then apply filters manually. That friction often discouraged casual data consumption, leaving decisions that should be critical to intuition rather than evidence.
Tableau Pulse addresses this challenge by bringing intelligence to the digital places where today’s professionals work and communicate. Pulse integrates directly with familiar enterprise apps like Slack, Microsoft Teams and email, offering users key metrics and proactive digests.
Stakeholders no longer need to hunt for the data, they get customised updates of the specific KPIs they’re tracking. A sales director receives a Slack summary of regional performance overnight in the morning; a marketing manager reviews email campaign metrics before walking into a strategy meeting. If a negative trend is found, team members can discuss the results together in the same communication thread, exchange ideas and take remedial measures in real time.
And mobile integration means this data-driven agility is not confined to the office desk. Now, executives on client calls or frontline managers on retail floors can fully interactively explore metrics, apply data dimension filters and manage metric followers on the go. Tableau Pulse takes data from a static destination to a constant operational companion by meeting users where they live.
Smooth Integration to Beat Digital Fatigue
The modern enterprise is awash in fragmented software. Employees complain of “app fatigue” – constantly switching between customer relationship management systems, enterprise resource planning platforms, communication channels and productivity suites. Adding another independent analytics dashboard to this already crowded ecosystem often leads to resistance which in turn leads to low adoption and wasted technology investment.
Tableau Pulse’s commitment to meet users where they work today is a sophisticated understanding of the ergonomics of enterprise software. Pulse embeds proactive digests and conversational summaries into collaboration tools, integrating with user habits. Data is delivered to the exact place where decisions are discussed and made.
Consider a development team collaborating within a chat room while working on a feature release. Incorporation of Tableau Pulse within their environment enables users to view their usage metrics without leaving the current context. It makes it easy to create an environment that encourages sharing of information spontaneously, instead of information coming as an afterthought.
Security, ethics and trust in AI analytics
As organisations delegate more and more analytical synthesis to artificial intelligence, concerns around data security, privacy and ethical reliability become paramount. Generative AI use in enterprise should not be at the expense of corporate governance and confidentiality of data.
Tableau Pulse addresses these critical challenges by rooting all of its artificial intelligence efforts in enterprise-grade trust frameworks, such as the Agentforce Trust Layer. This architectural protection is so that the data privacy and data security protocols are enforced at all times.
And that’s what natural language models are doing when they summarise metrics or answer conversational queries, but within strict operational boundaries – only on governed semantic definitions and authorised data sources, not unvetted public models.
Plus, Tableau Pulse is upfront with explicit source references and citations for each AI insight. Users don’t have to trust a black-box conclusion, but can trace any summary or conversational response back to underlying metric definitions and source data. A commitment to grounded, verifiable intelligence means no hallucinations, no risk of misinterpretation and that automated analytics are a reliable foundation for high-stakes business decisions.
The Need for Enterprise Grade Reliability
The key to business intelligence is accuracy. Generative AI and its capacity to write creatively and talk naturally have captured the world's imagination. But if you apply it to financial and operational data in a haphazard way, there is a danger that it will hallucinate – inventing falsehoods that sound plausible. Enterprise leaders can’t make multi-million dollar strategic pivots based on statistical anomalies they’ve cooked up.
Tableau Pulse’s architecture includes strict grounding mechanisms to address this risk. Generative models do not compute numbers, they describe computations of the trusted metrics layer. Every Pulse insight is powered by verifiable database queries and unbreakable governance rules.
Role-based control mechanisms also help in exposing the user only to data that he/she is explicitly allowed to see. Confidential HR metrics, or a summary of North American compensation structures, will not be accidentally sent to a regional sales manager in Europe. With Tableau Pulse, we’ve paired strong security permissions with mathematically based generation to deliver the creative power of artificial intelligence with the absolute integrity required by modern enterprise governance.
Organisational Culture Change & Business Impact Implementation
The real test of any technological innovation is in its ability to bring about cultural change in an organization. Organisations have been dreaming about becoming truly “data-driven” for years, but real data culture has often been the preserve of specialised data science teams and analytical power-users. But at best, most of the workforce was still only consumers of static reports, and at worst, not involved with data-driven decision making at all.
Tableau Pulse is revolutionising data-driven by delivering personalised data to every employee, in every department, at scale. Pulse takes away the friction of manual reporting and the technical barriers to entry, bringing contextual metrics directly into the flow of everyday communications, so frontline workers, managers and executives can interact with data in a natural way.
Many organisations that do implement Tableau Pulse find their operational responsiveness is altered drastically. Rather than meetings devolving into “he said, she said” battles over numbers in spreadsheets, they become strategic discussions about how to respond to anomalies and emerging opportunities. Decision cycles go from weeks of manual investigation to minutes of guided conversational exploration. Tableau Pulse changes the way insights are discovered, shared and acted on, unlocking the full capabilities of enterprise data to be the great equaliser for sustainable business growth and competitive advantage.
Building sustainable data literacy in the workforce
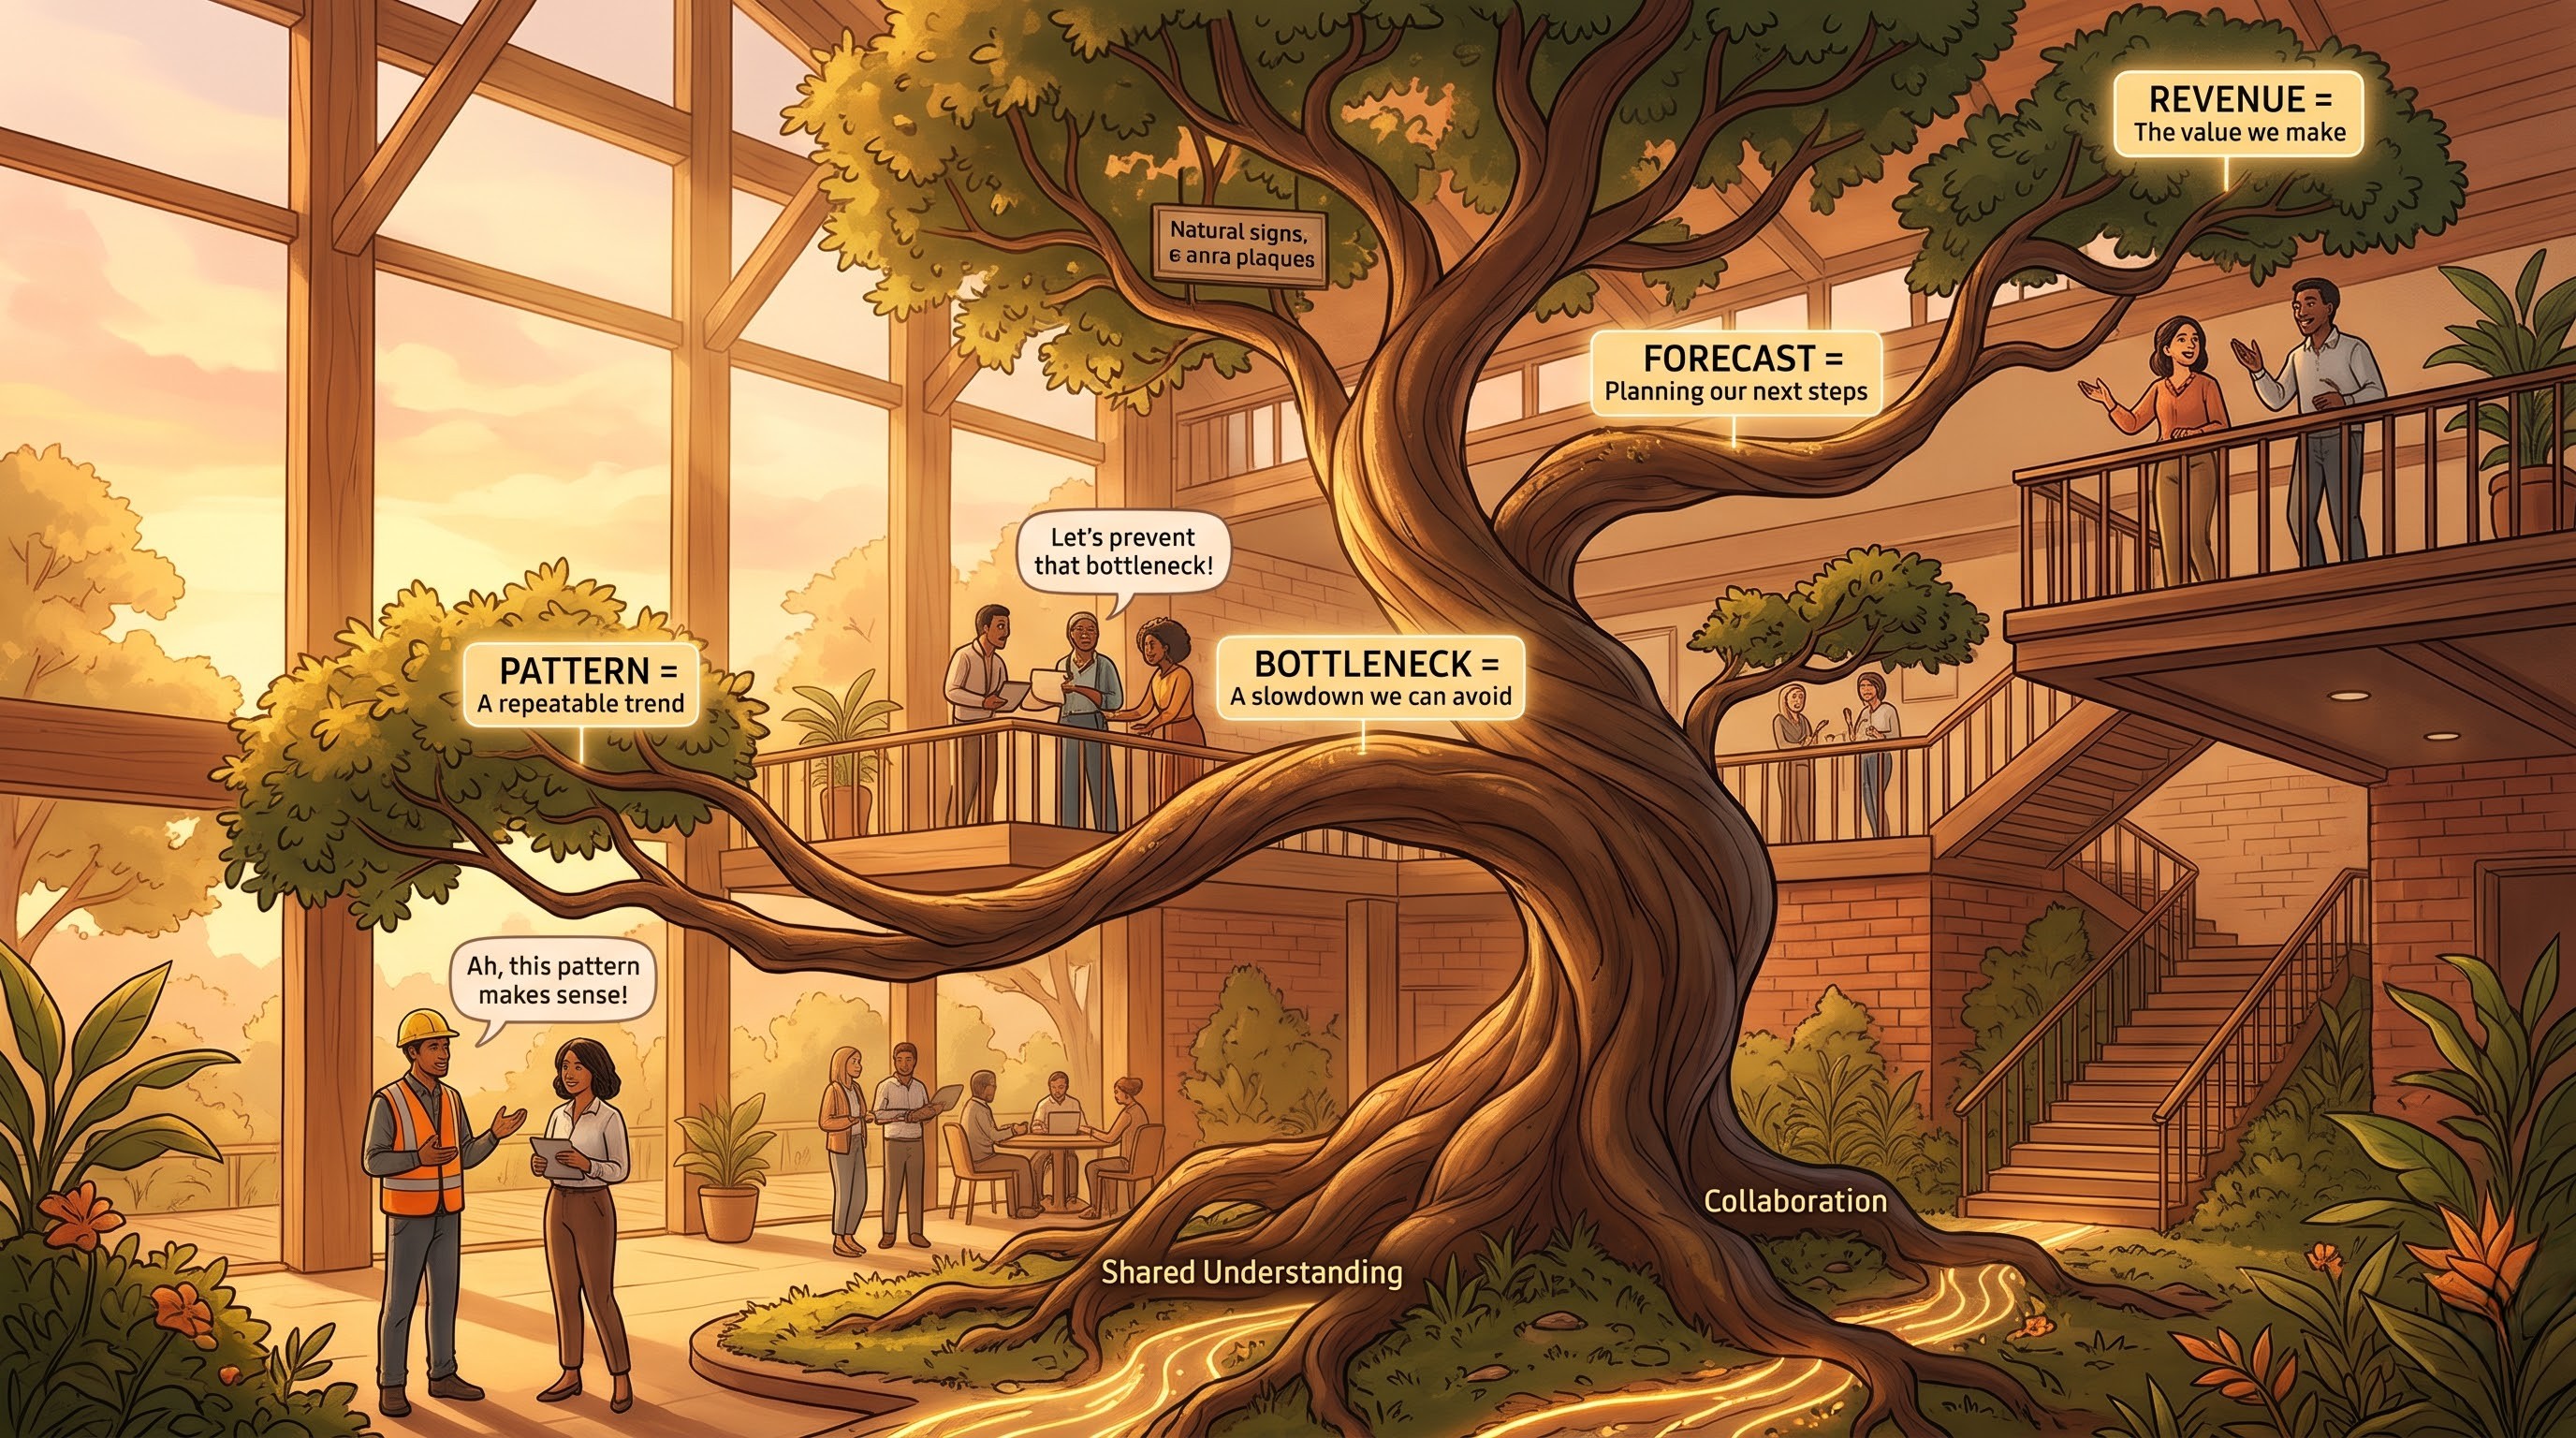
To get to a mature data-driven culture, you need to change the way employees think and work with information, you need more than sophisticated software. When we talked about making employees data-literate before, it was about teaching them how to create complex calculated fields, work with multidimensional databases and format visual charts. This high barrier to entry meant real data fluency was the preserve of a specialist minority.
“Tableau Pulse is democratising data literacy by making analytics a conversational and intuitive experience. Employees who can read plain-language explanations of why a key performance indicator changed will naturally learn analytical concepts in context. Over time, proactive insights are explained well daily, building organisational intuition. Staff learn how to spot patterns, anticipate operational bottlenecks and ask better strategic questions.
As AI matures in enterprise software, products like Tableau Pulse are leading the way to a world in which data is not a specialised technical field requiring its own translation. Data becomes a common language, and the language is spoken fluently at every level of the organization. Everyone is capable of making a difference in the success of the strategy for the company. If you are an expert who aspires to be the person responsible for initiating the data transformation process in your company, then the skills and knowledge you acquire from taking tableau developer training would assist you greatly.