
The Complete Blueprint to QlikView Development and Enterprise Data Strategy
Last updated on Aug 13, 2026
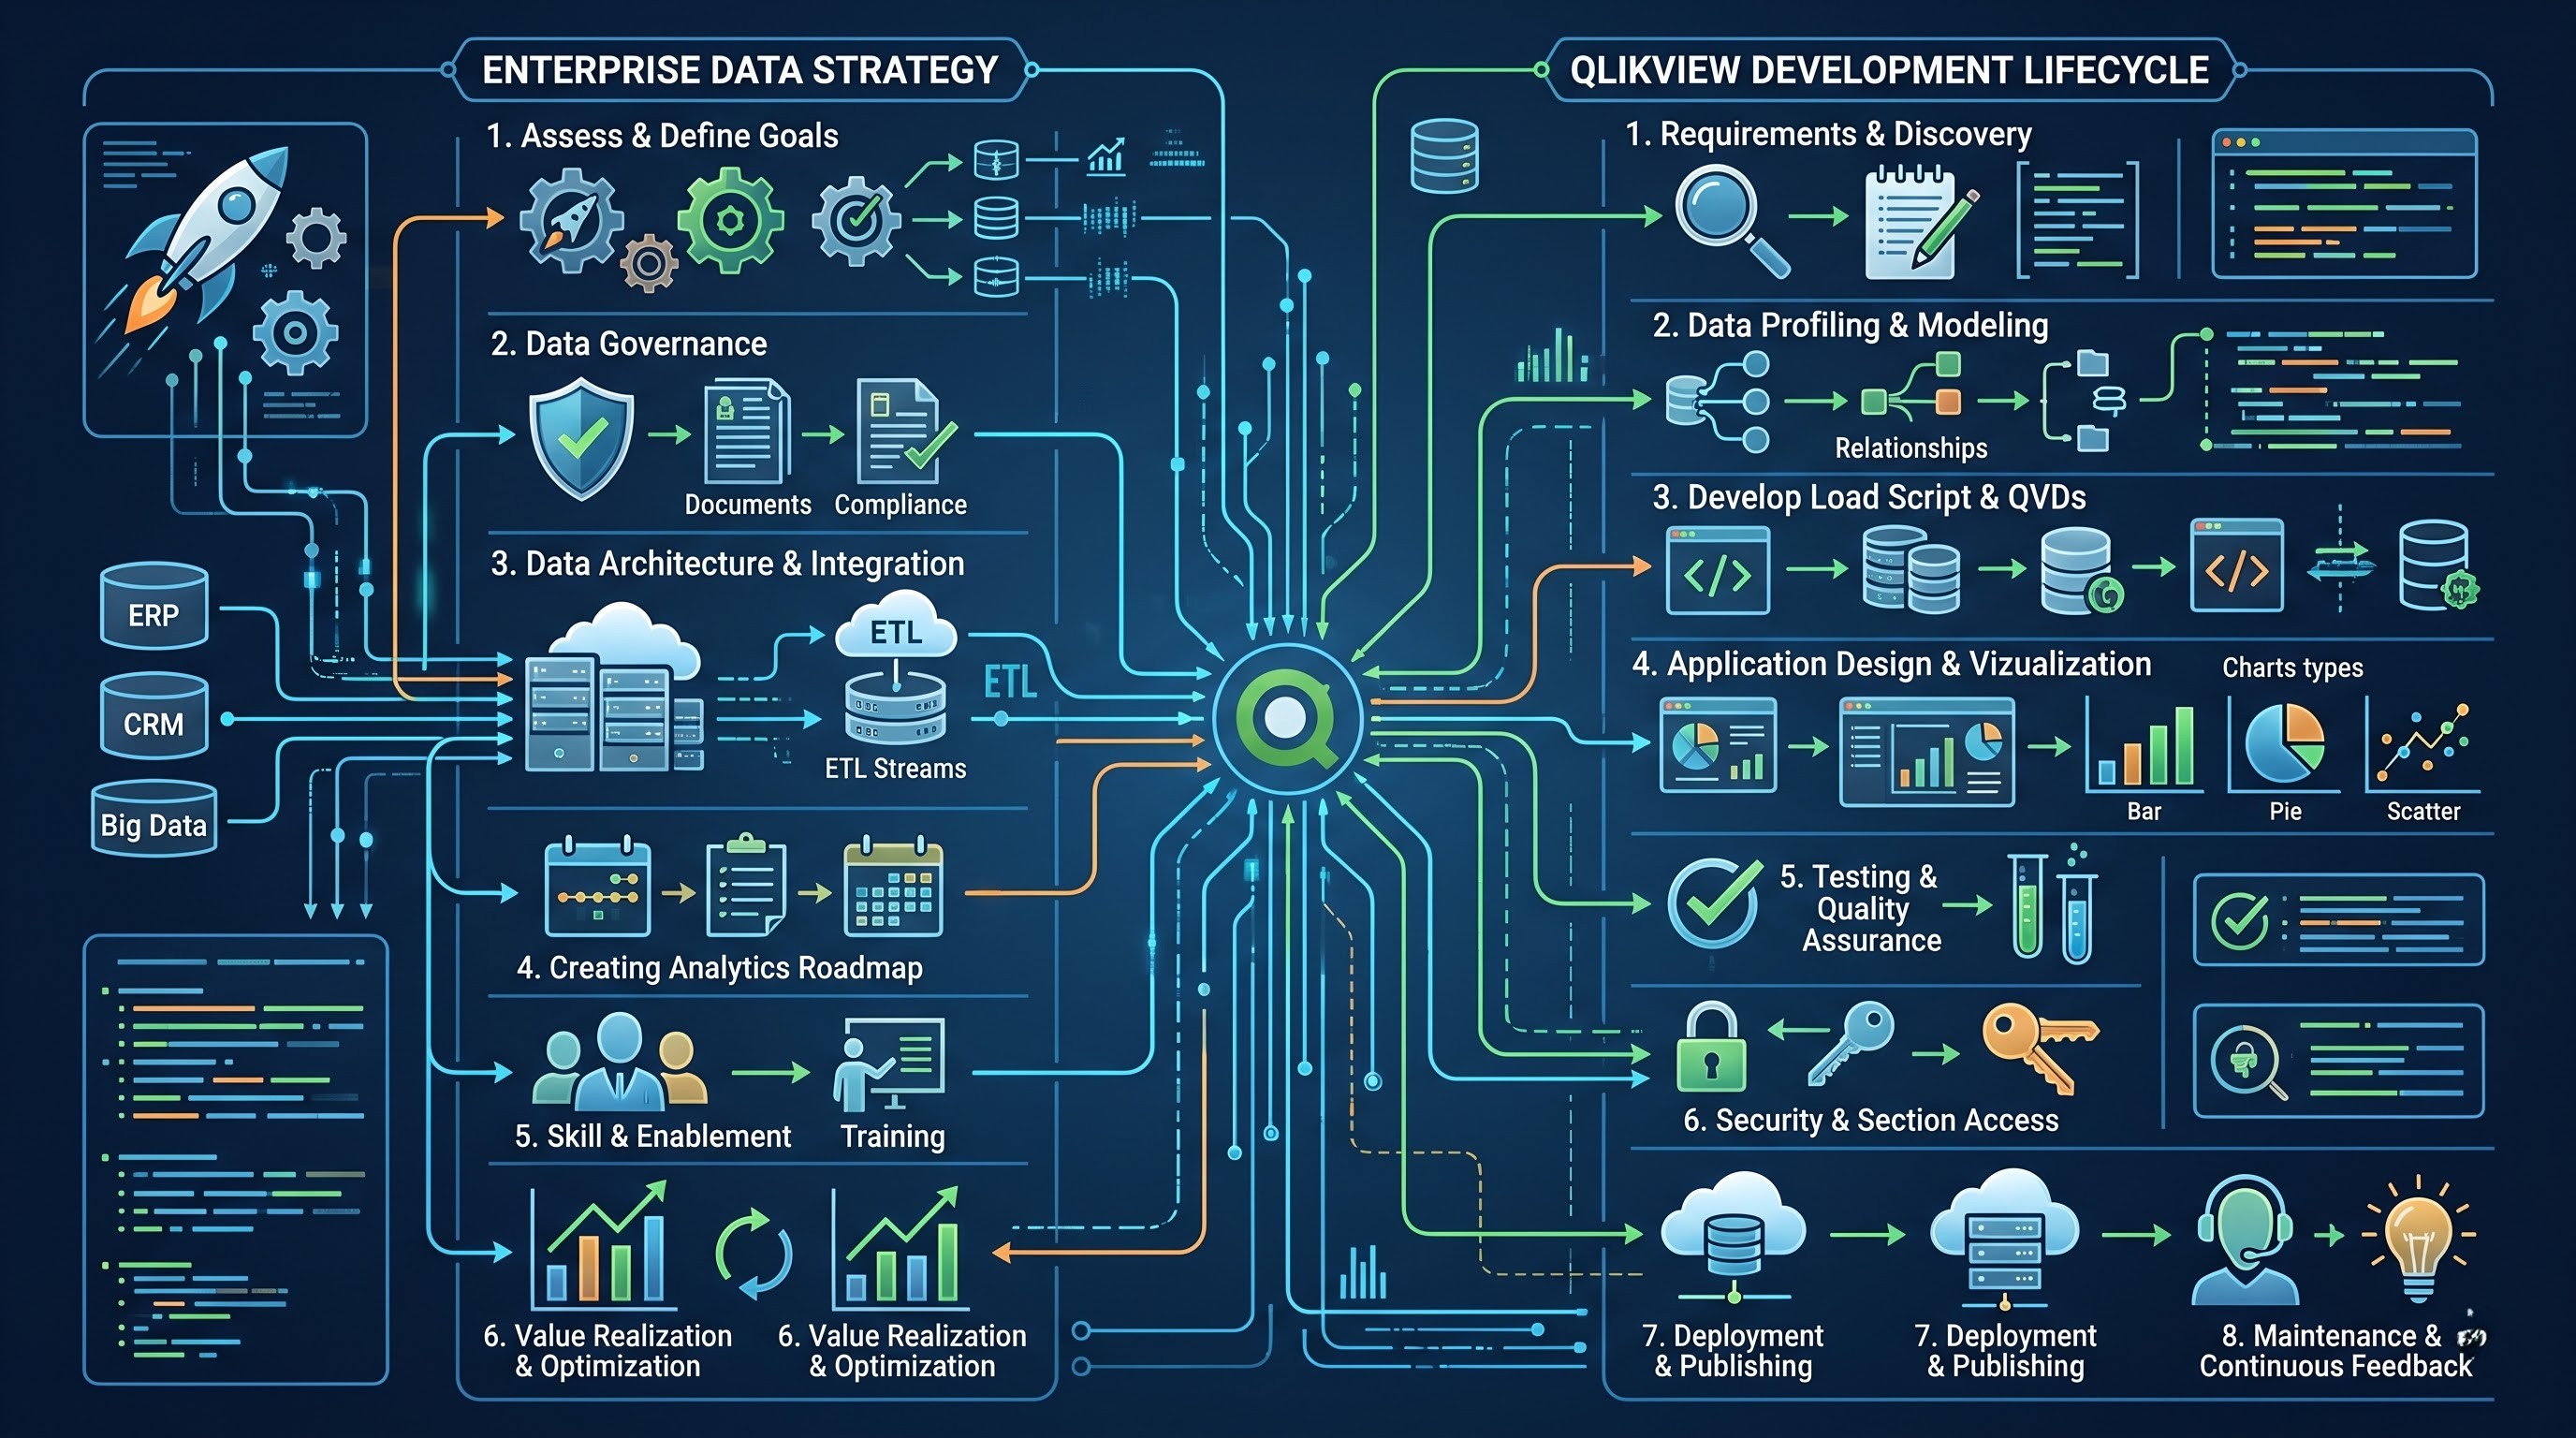
Data drives modern decisions, but raw data is noisy, fragmented, and difficult to parse without the right systems in place. Business Intelligence (BI) platforms exist to solve this exact problem by transforming complex data tables into clear, interactive visual dashboards. Within this landscape, QlikView established itself early on as a pioneer of guided analytics, allowing companies to build controlled, developer-led analytical applications.
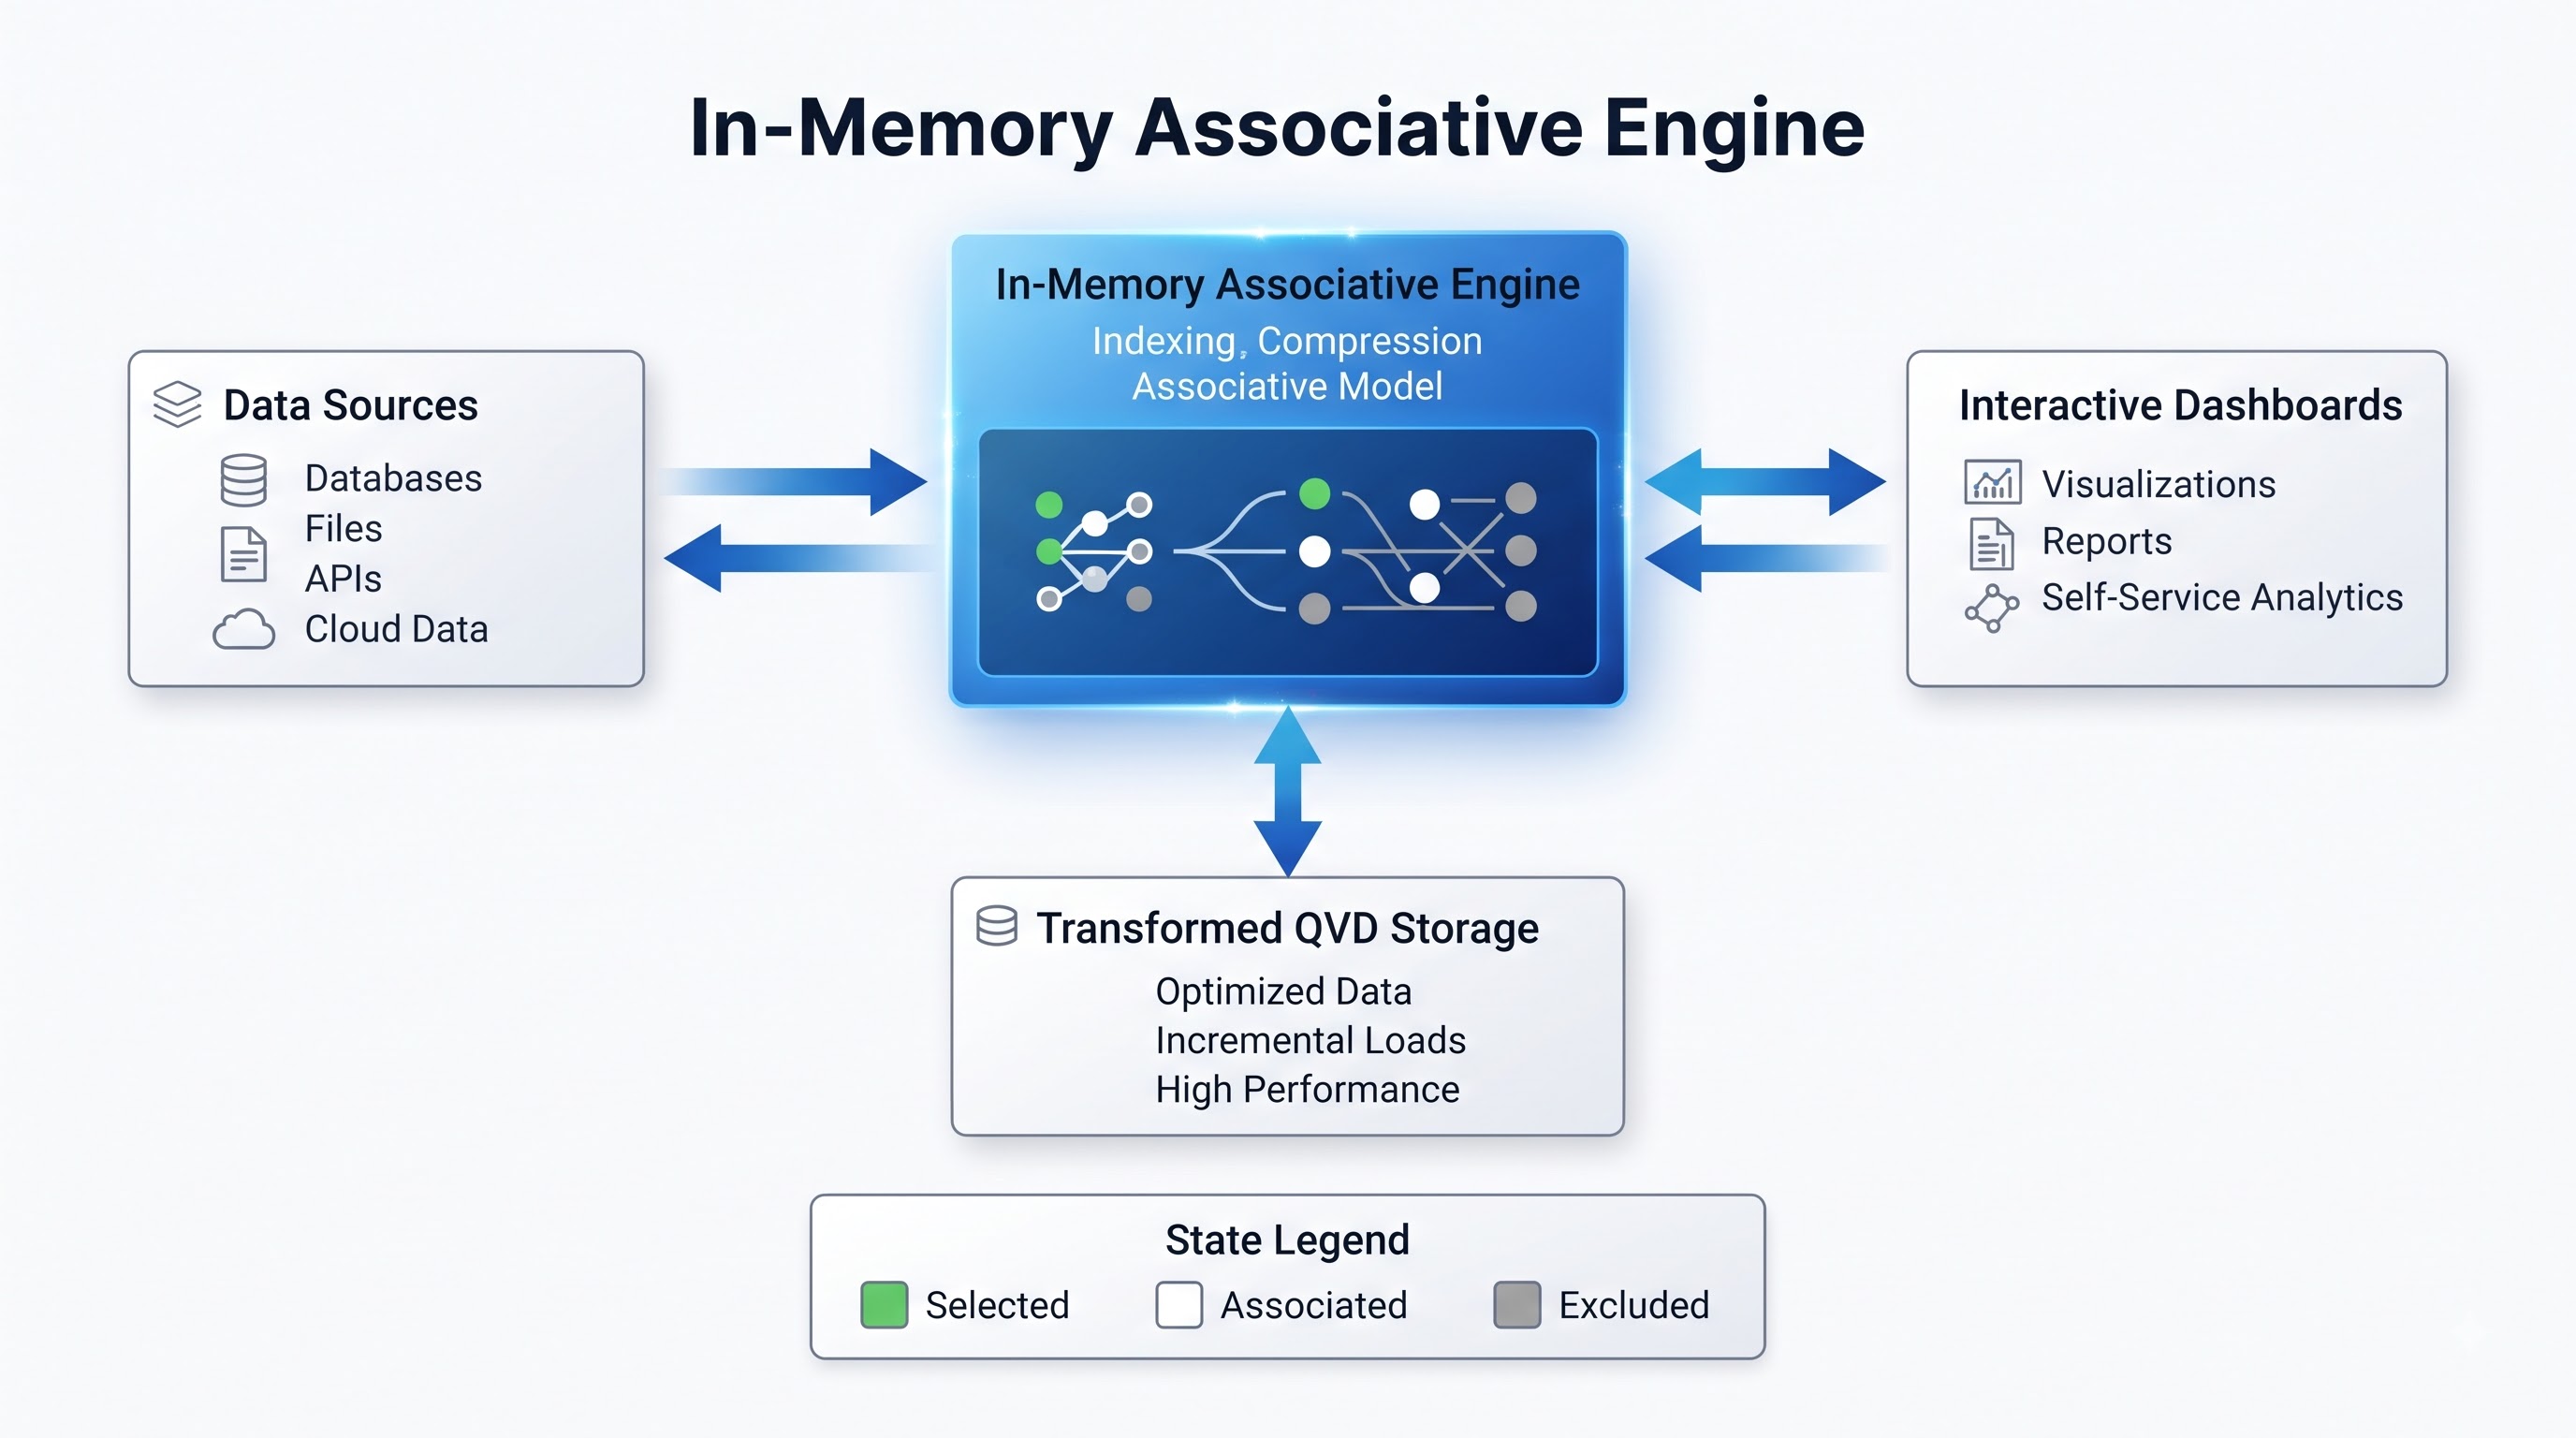
At the heart of the tool is a proprietary in-memory associative engine. Unlike standard relational tools that rely strictly on linear SQL queries, this platform maps relationships across all data sources automatically. Clicking a data point highlights associated data in green, related data in white, and completely unrelated data in dark grey. This visual feedback loop enables analysts to uncover hidden operational patterns instantly.
While newer platforms emphasize fast self-service dashboard creation, QlikView remains deeply embedded across major enterprise sectors including banking, supply chain management, healthcare, and retail. Understanding how this platform works—and where it fits in today's analytics stack—is essential for anyone working with enterprise data architectures.
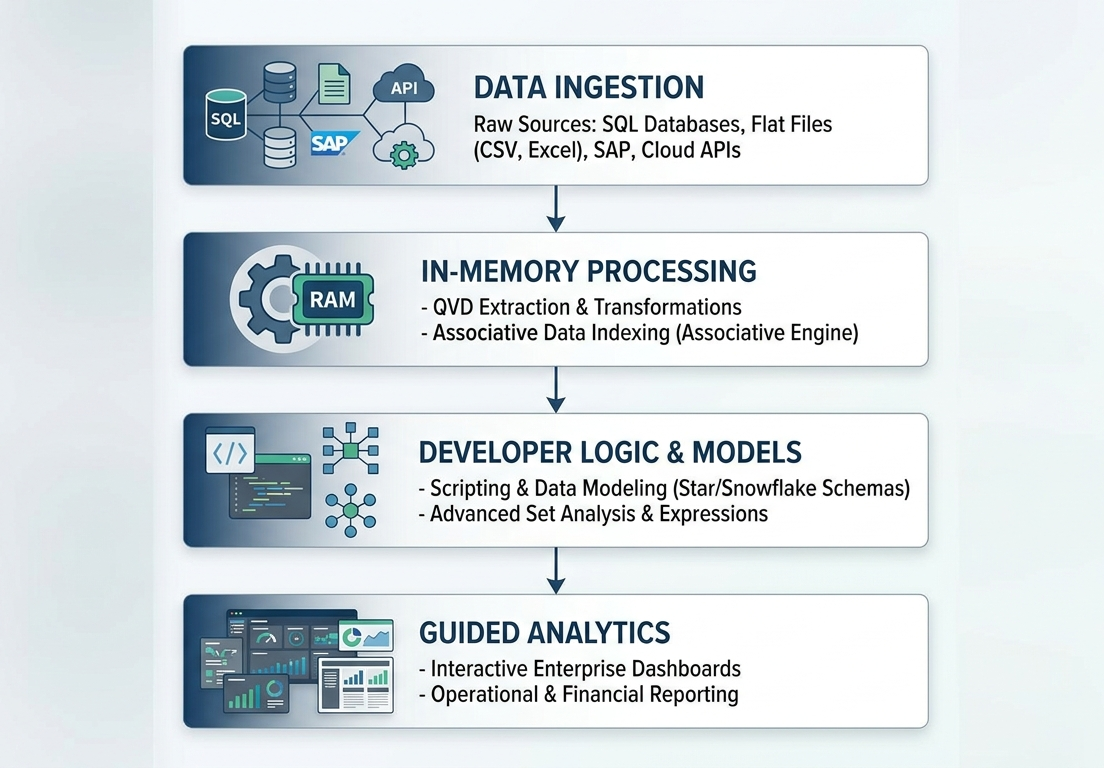
Core Architecture and the Associative Engine
To understand why this technology earned a lasting place in enterprise software stacks, you have to look under the hood at its memory management and query execution models.
Standard query engines require predefined joins and rigid paths. If an analyst wants to ask a question that wasn't built into the original database view, a developer must write new SQL scripts or rebuild the data warehouse pipeline. QlikView flips this approach by loading the underlying data tables directly into RAM and indexing every field value against every other field value.
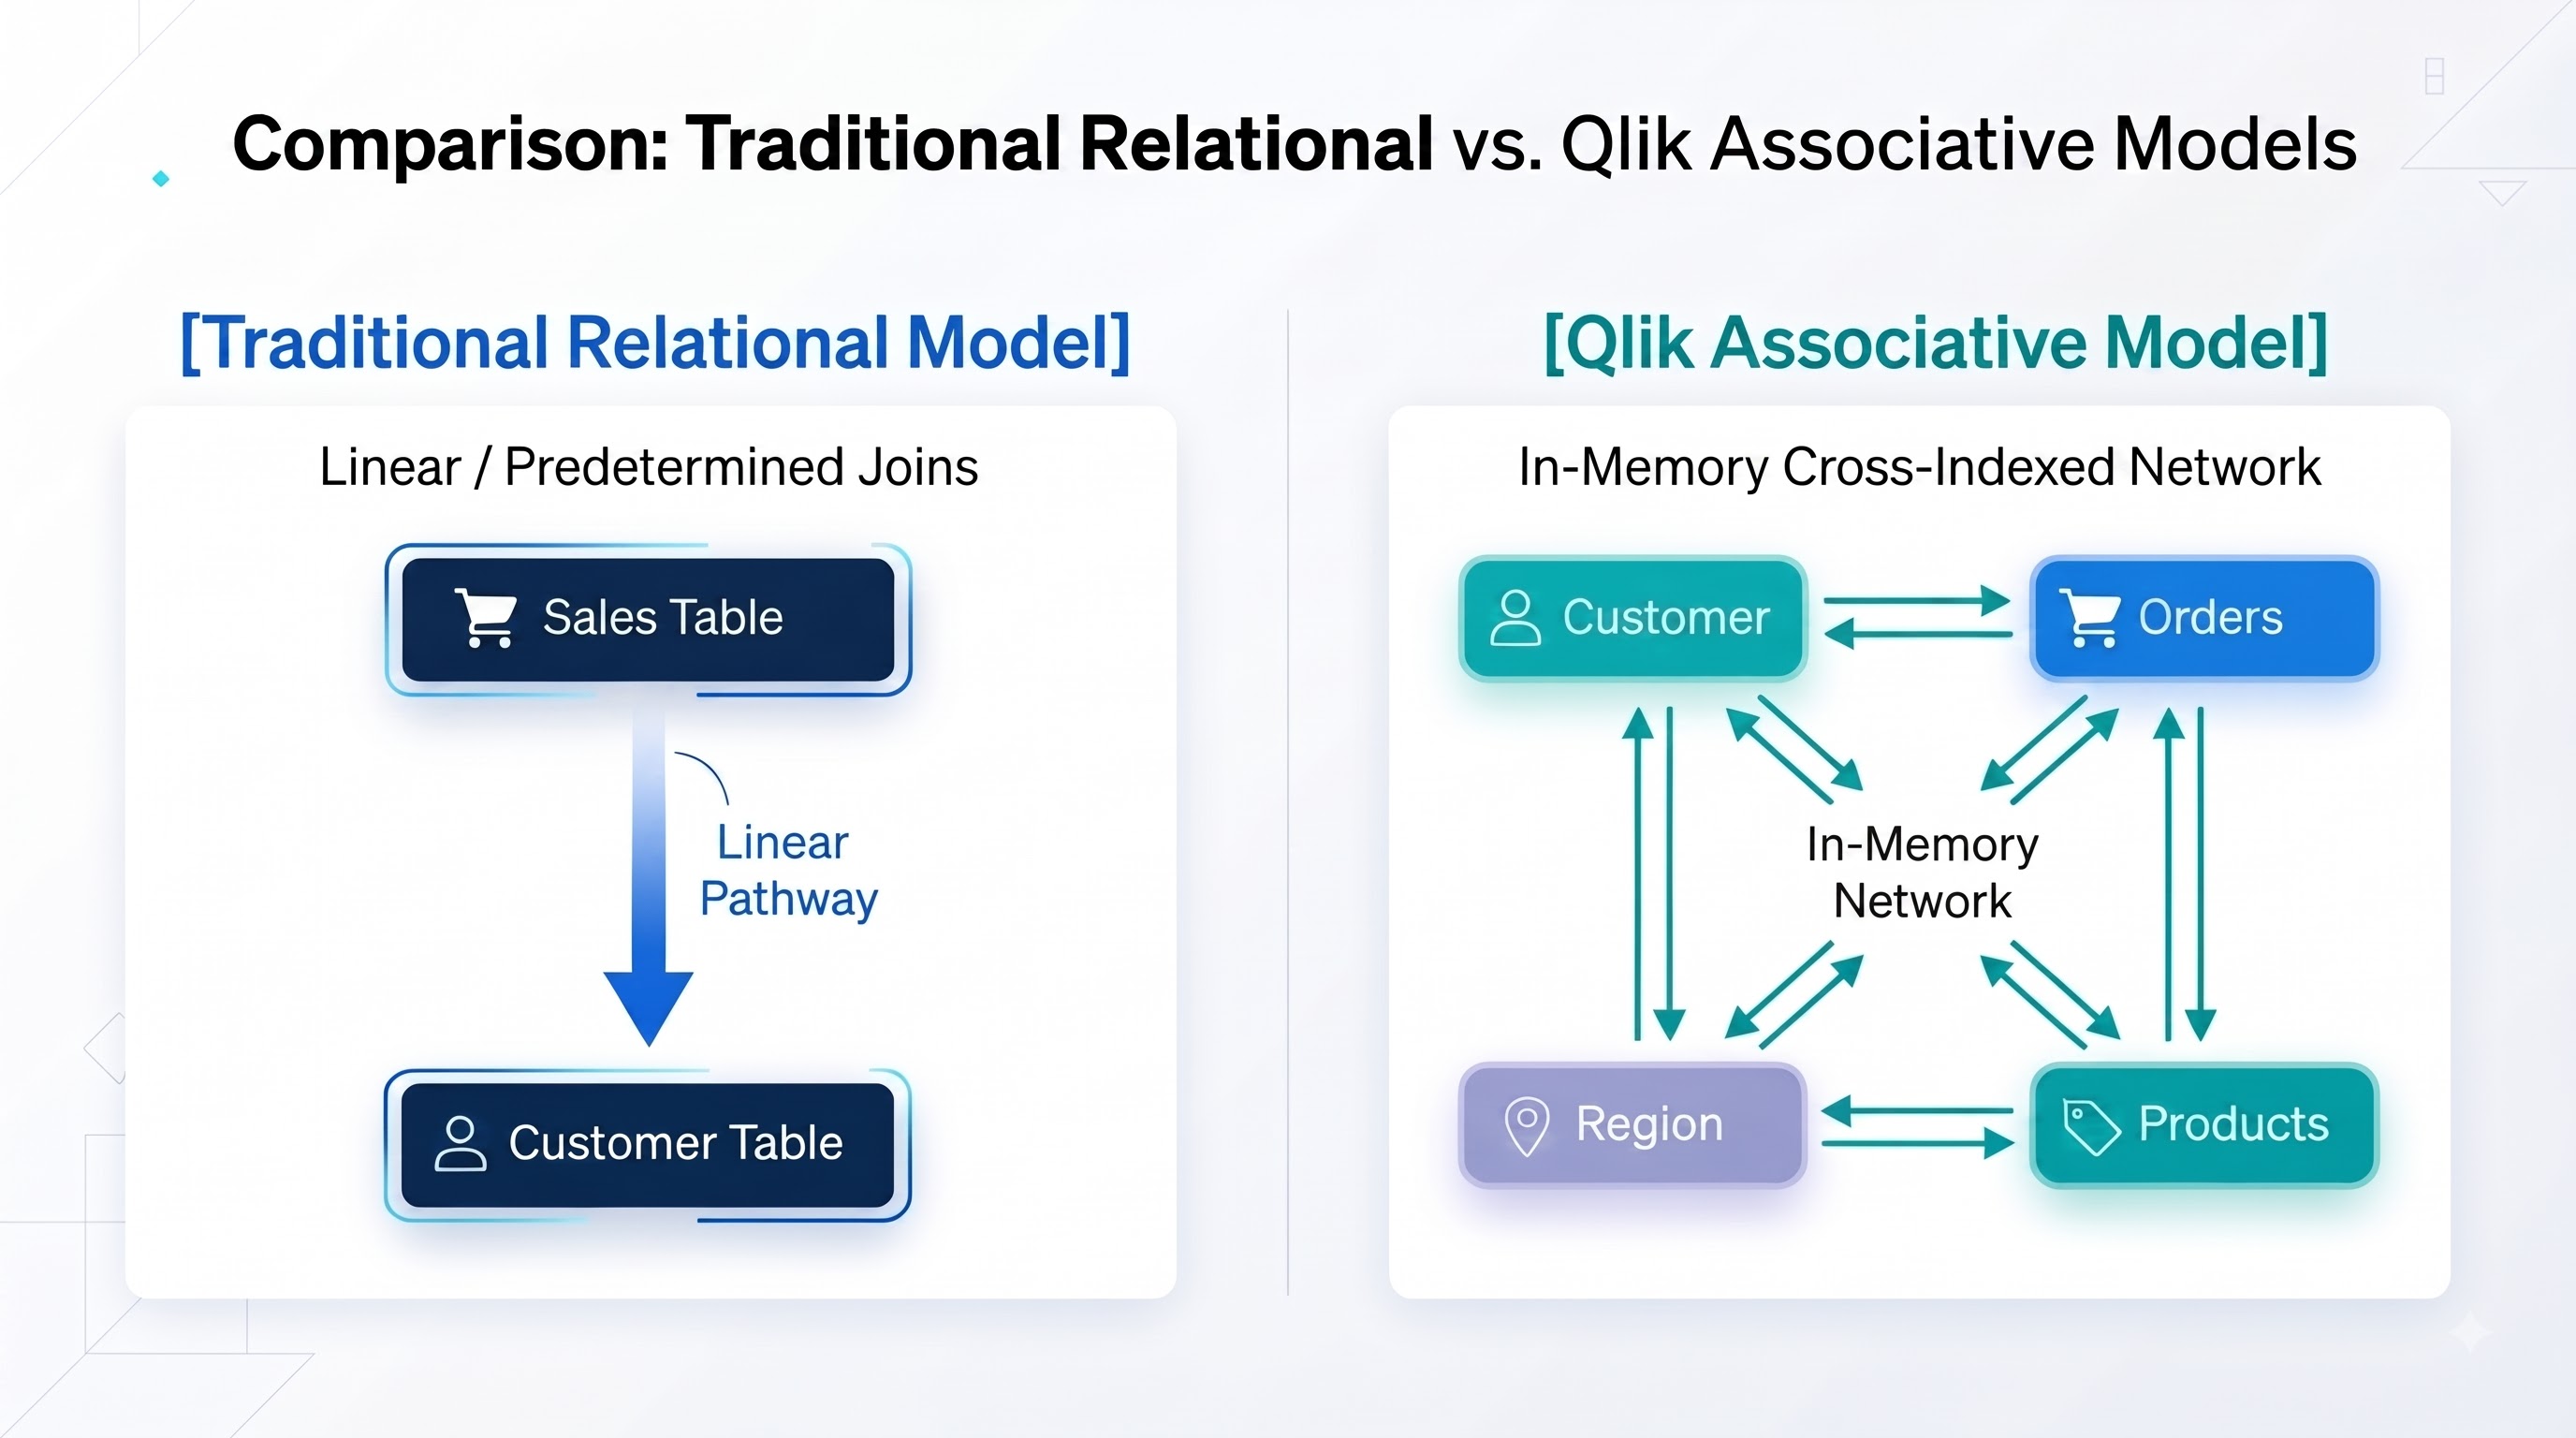
This structural difference produces several practical operational outcomes:
In-Memory Speed: Data compression techniques shrink large enterprise data files down to a fraction of their original size, keeping full datasets ready for immediate memory processing.
Unconstrained Discovery: Users do not have to follow hierarchical drill-down paths (such as Year -> Month -> Day). They can click on a product category, an isolated region, or an individual salesperson in any sequence to instantly refresh all charts across the dashboard.
Visibility into Excluded Data: By highlighting what doesn't match a selection (the grey data points), analysts can spot lost sales, inventory gaps, or inactive customer segments that standard query filters normally hide.
Building an Effective Skill Foundation
Entering the analytics field requires balancing theoretical data concepts with concrete, hands-on tool execution. Structured qlikview learning provides a direct pathway for beginners to grasp essential analytics foundations, such as data modeling, normalization, table linking, and variable handling.
A standard progression begins with learning how to extract data from multiple external sources (including SQL databases, Excel spreadsheets, and REST APIs) and consolidate them into a clean, unified data layer. From there, learners discover how to avoid common database modeling errors—such as synthetic keys or circular references—which can degrade dashboard memory performance if left uncorrected.
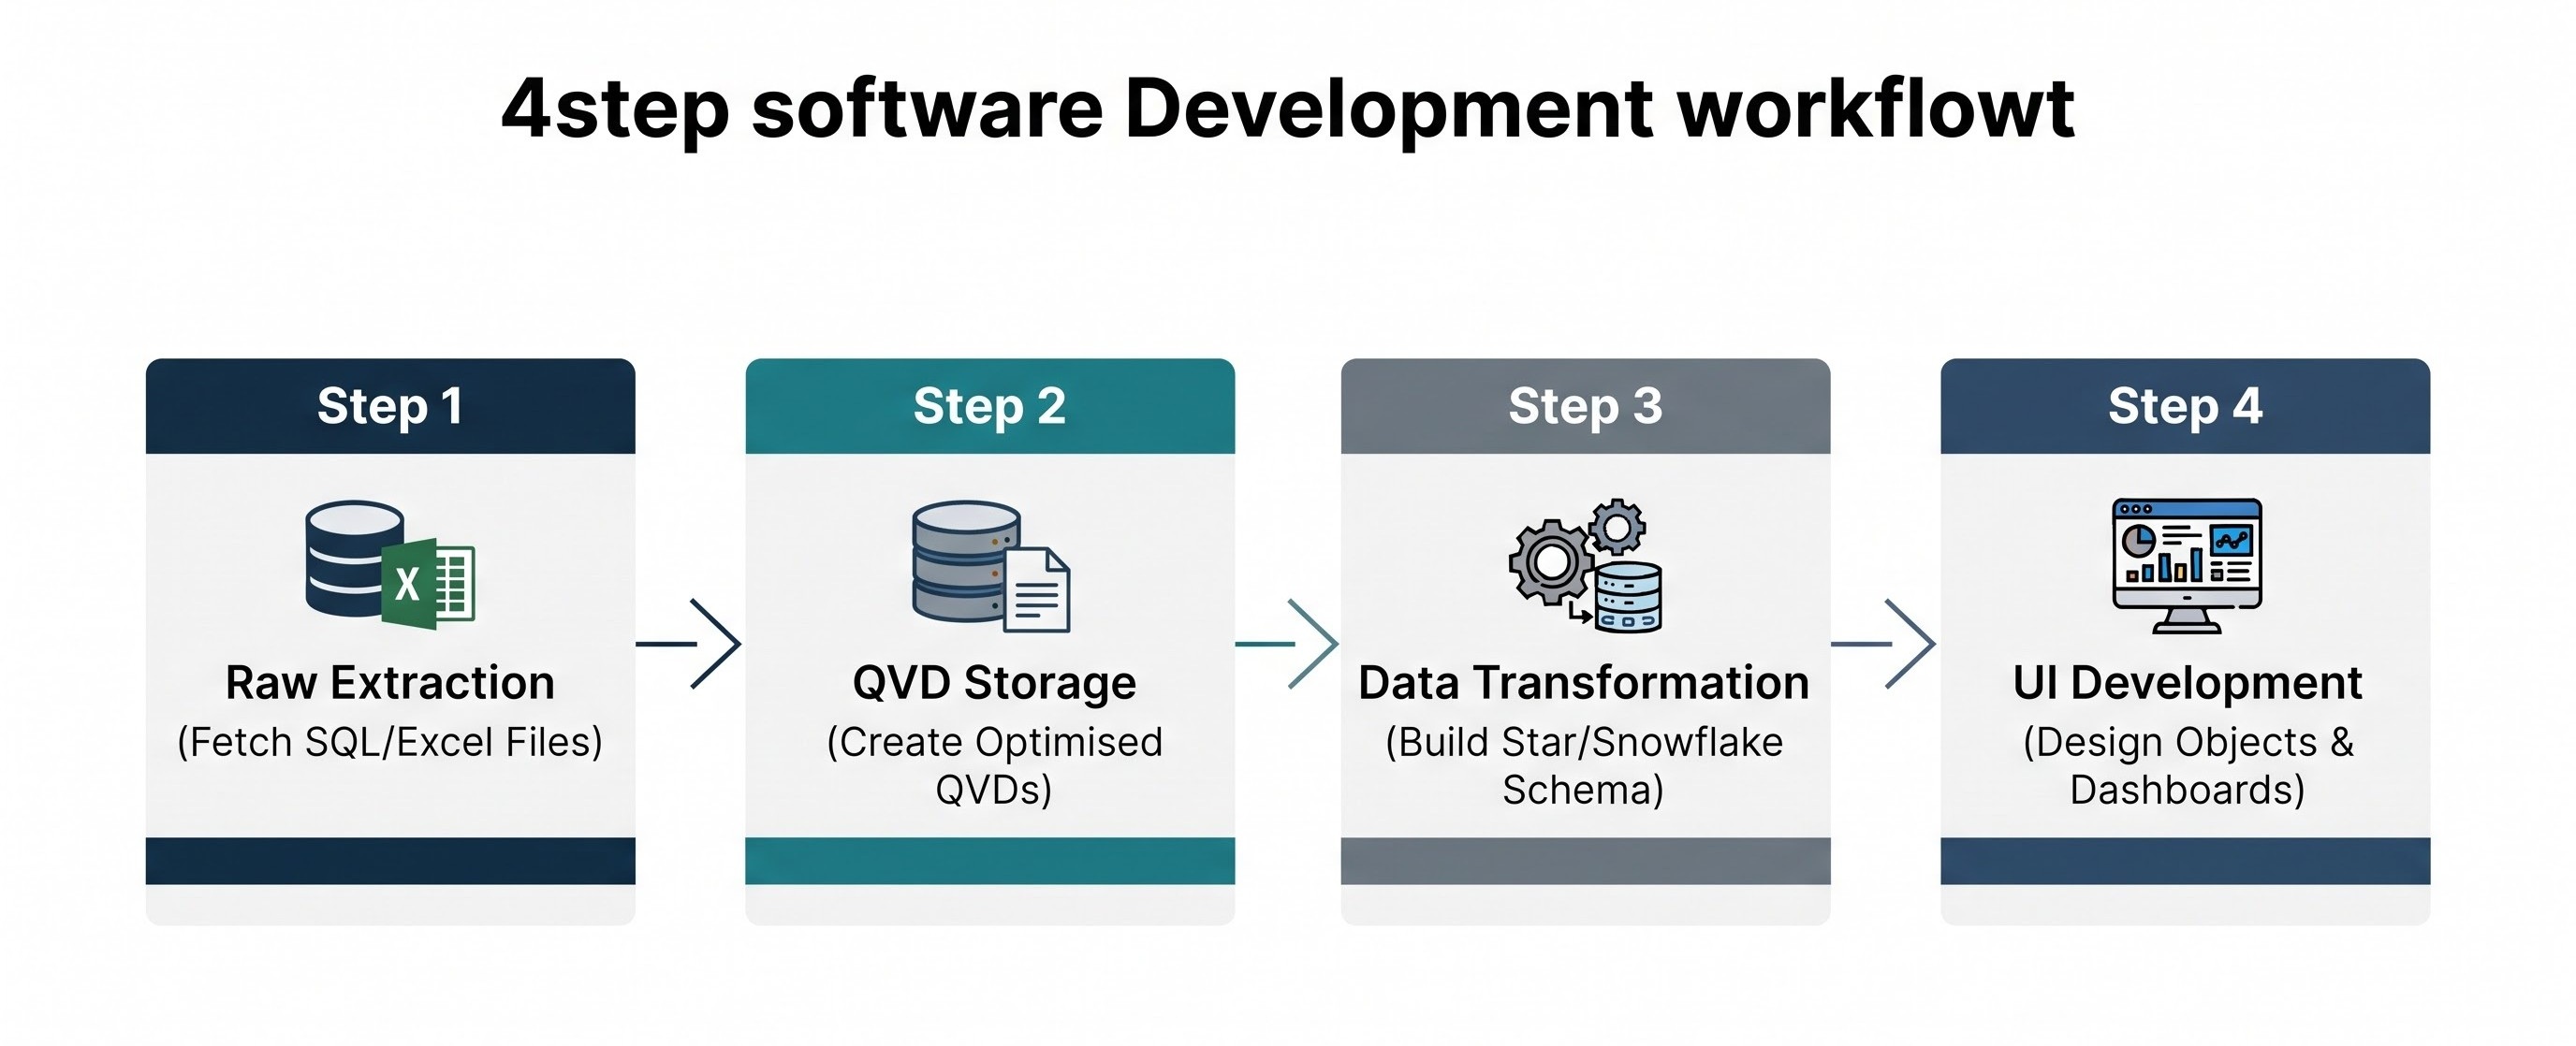
Mastering these foundational steps ensures that the dashboards you build run smoothly, scale reliably, and deliver accurate numbers to business decision-makers every time.
Core Technical Skills Every Developer Needs
Building robust analytics applications requires more than drag-and-drop chart layout skills. It demands technical proficiency in script writing, data structuring, and backend performance management.
1. Data Loading and Transformation Scripting
Developers work inside a built-in script editor, using a SQL-like scripting language to perform extract, transform, and load (ETL) routines. Key tasks include renaming fields, converting data types, creating conditional statements, and executing incremental loads to update large tables efficiently without reloading entire databases.
2. Optimizing Data Models
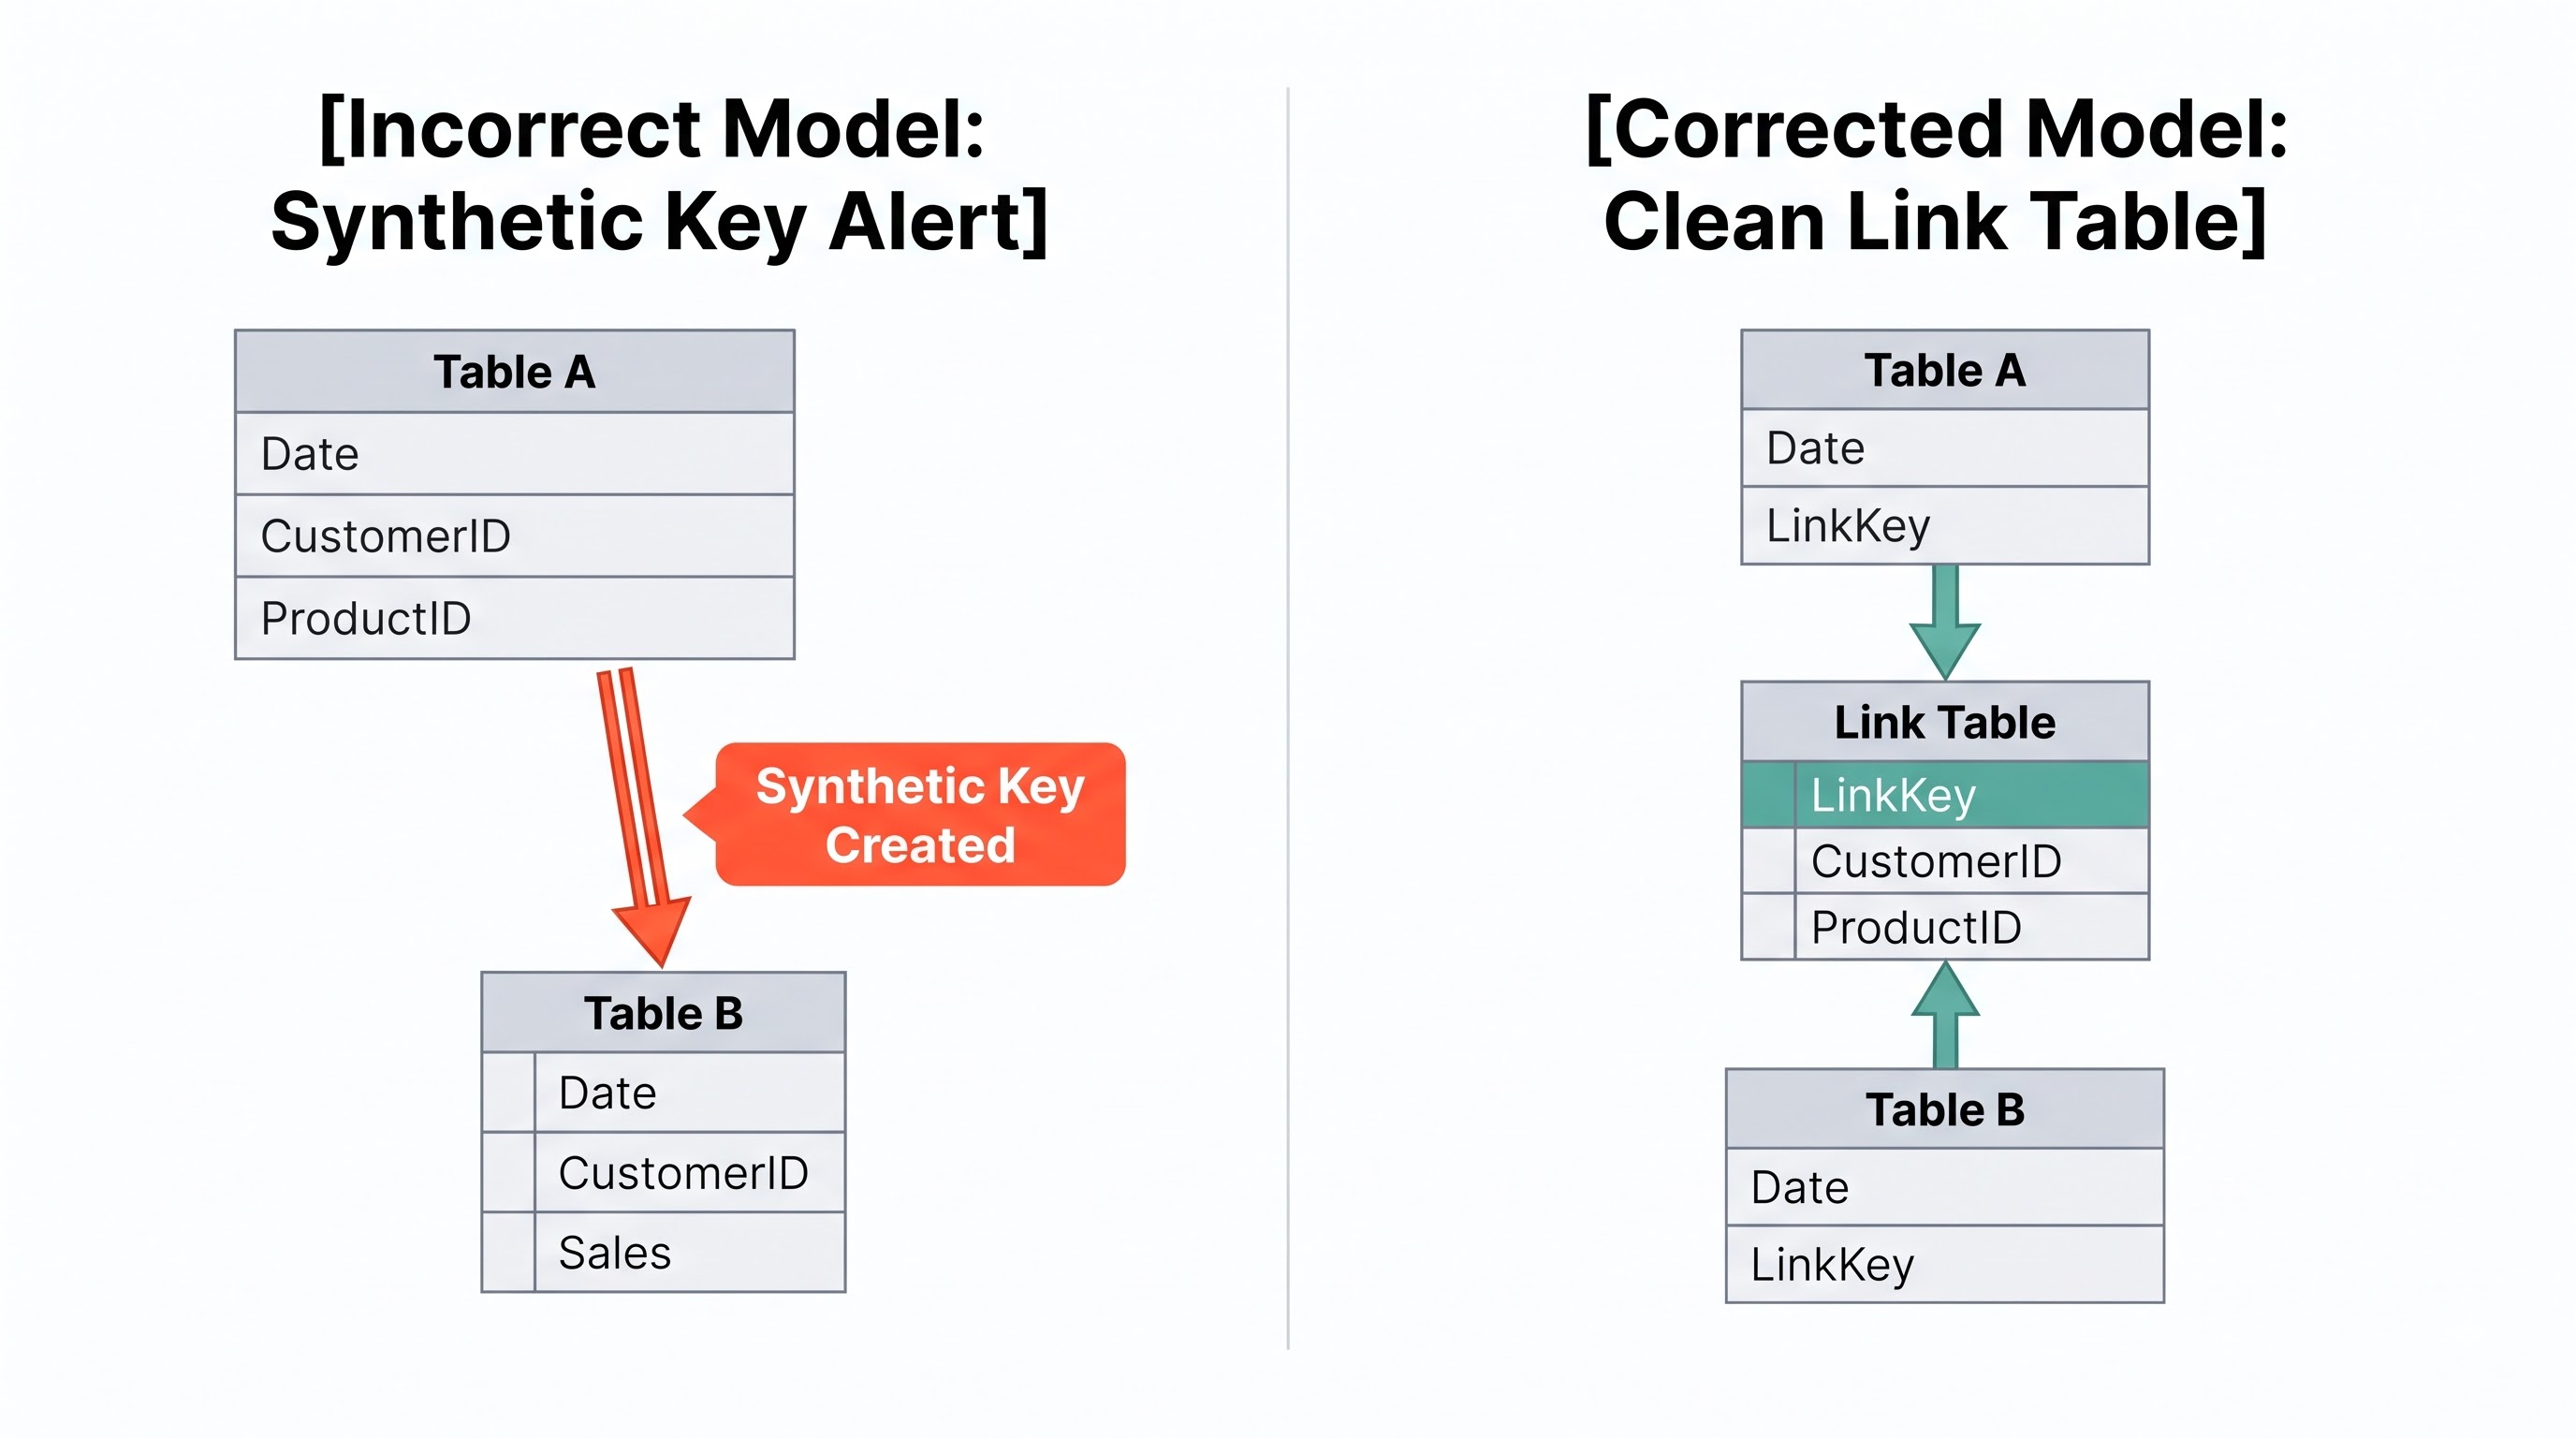
Creating a clean schema is critical for speed. Developers aim to design Star or Snowflake schemas inside the memory engine. This process involves resolving synthetic keys (which occur when two tables share more than one common field name) and eliminating circular loops (which confuse the engine's calculation paths) using explicit joins, concatenated tables, or link tables.
3. Advanced Expression Writing and Set Analysis
Set Analysis is one of the most powerful features in the Qlik ecosystem. It allows developers to define dynamic aggregation scopes that sit outside the user's active dashboard selections.
For example, if an analyst clicks on the year "2026", a standard chart updates to show only 2026 data. However, a Set Analysis formula can force a single KPI card to display the previous year's total for direct comparison—regardless of what the user clicks.
Choosing the Right Educational Path
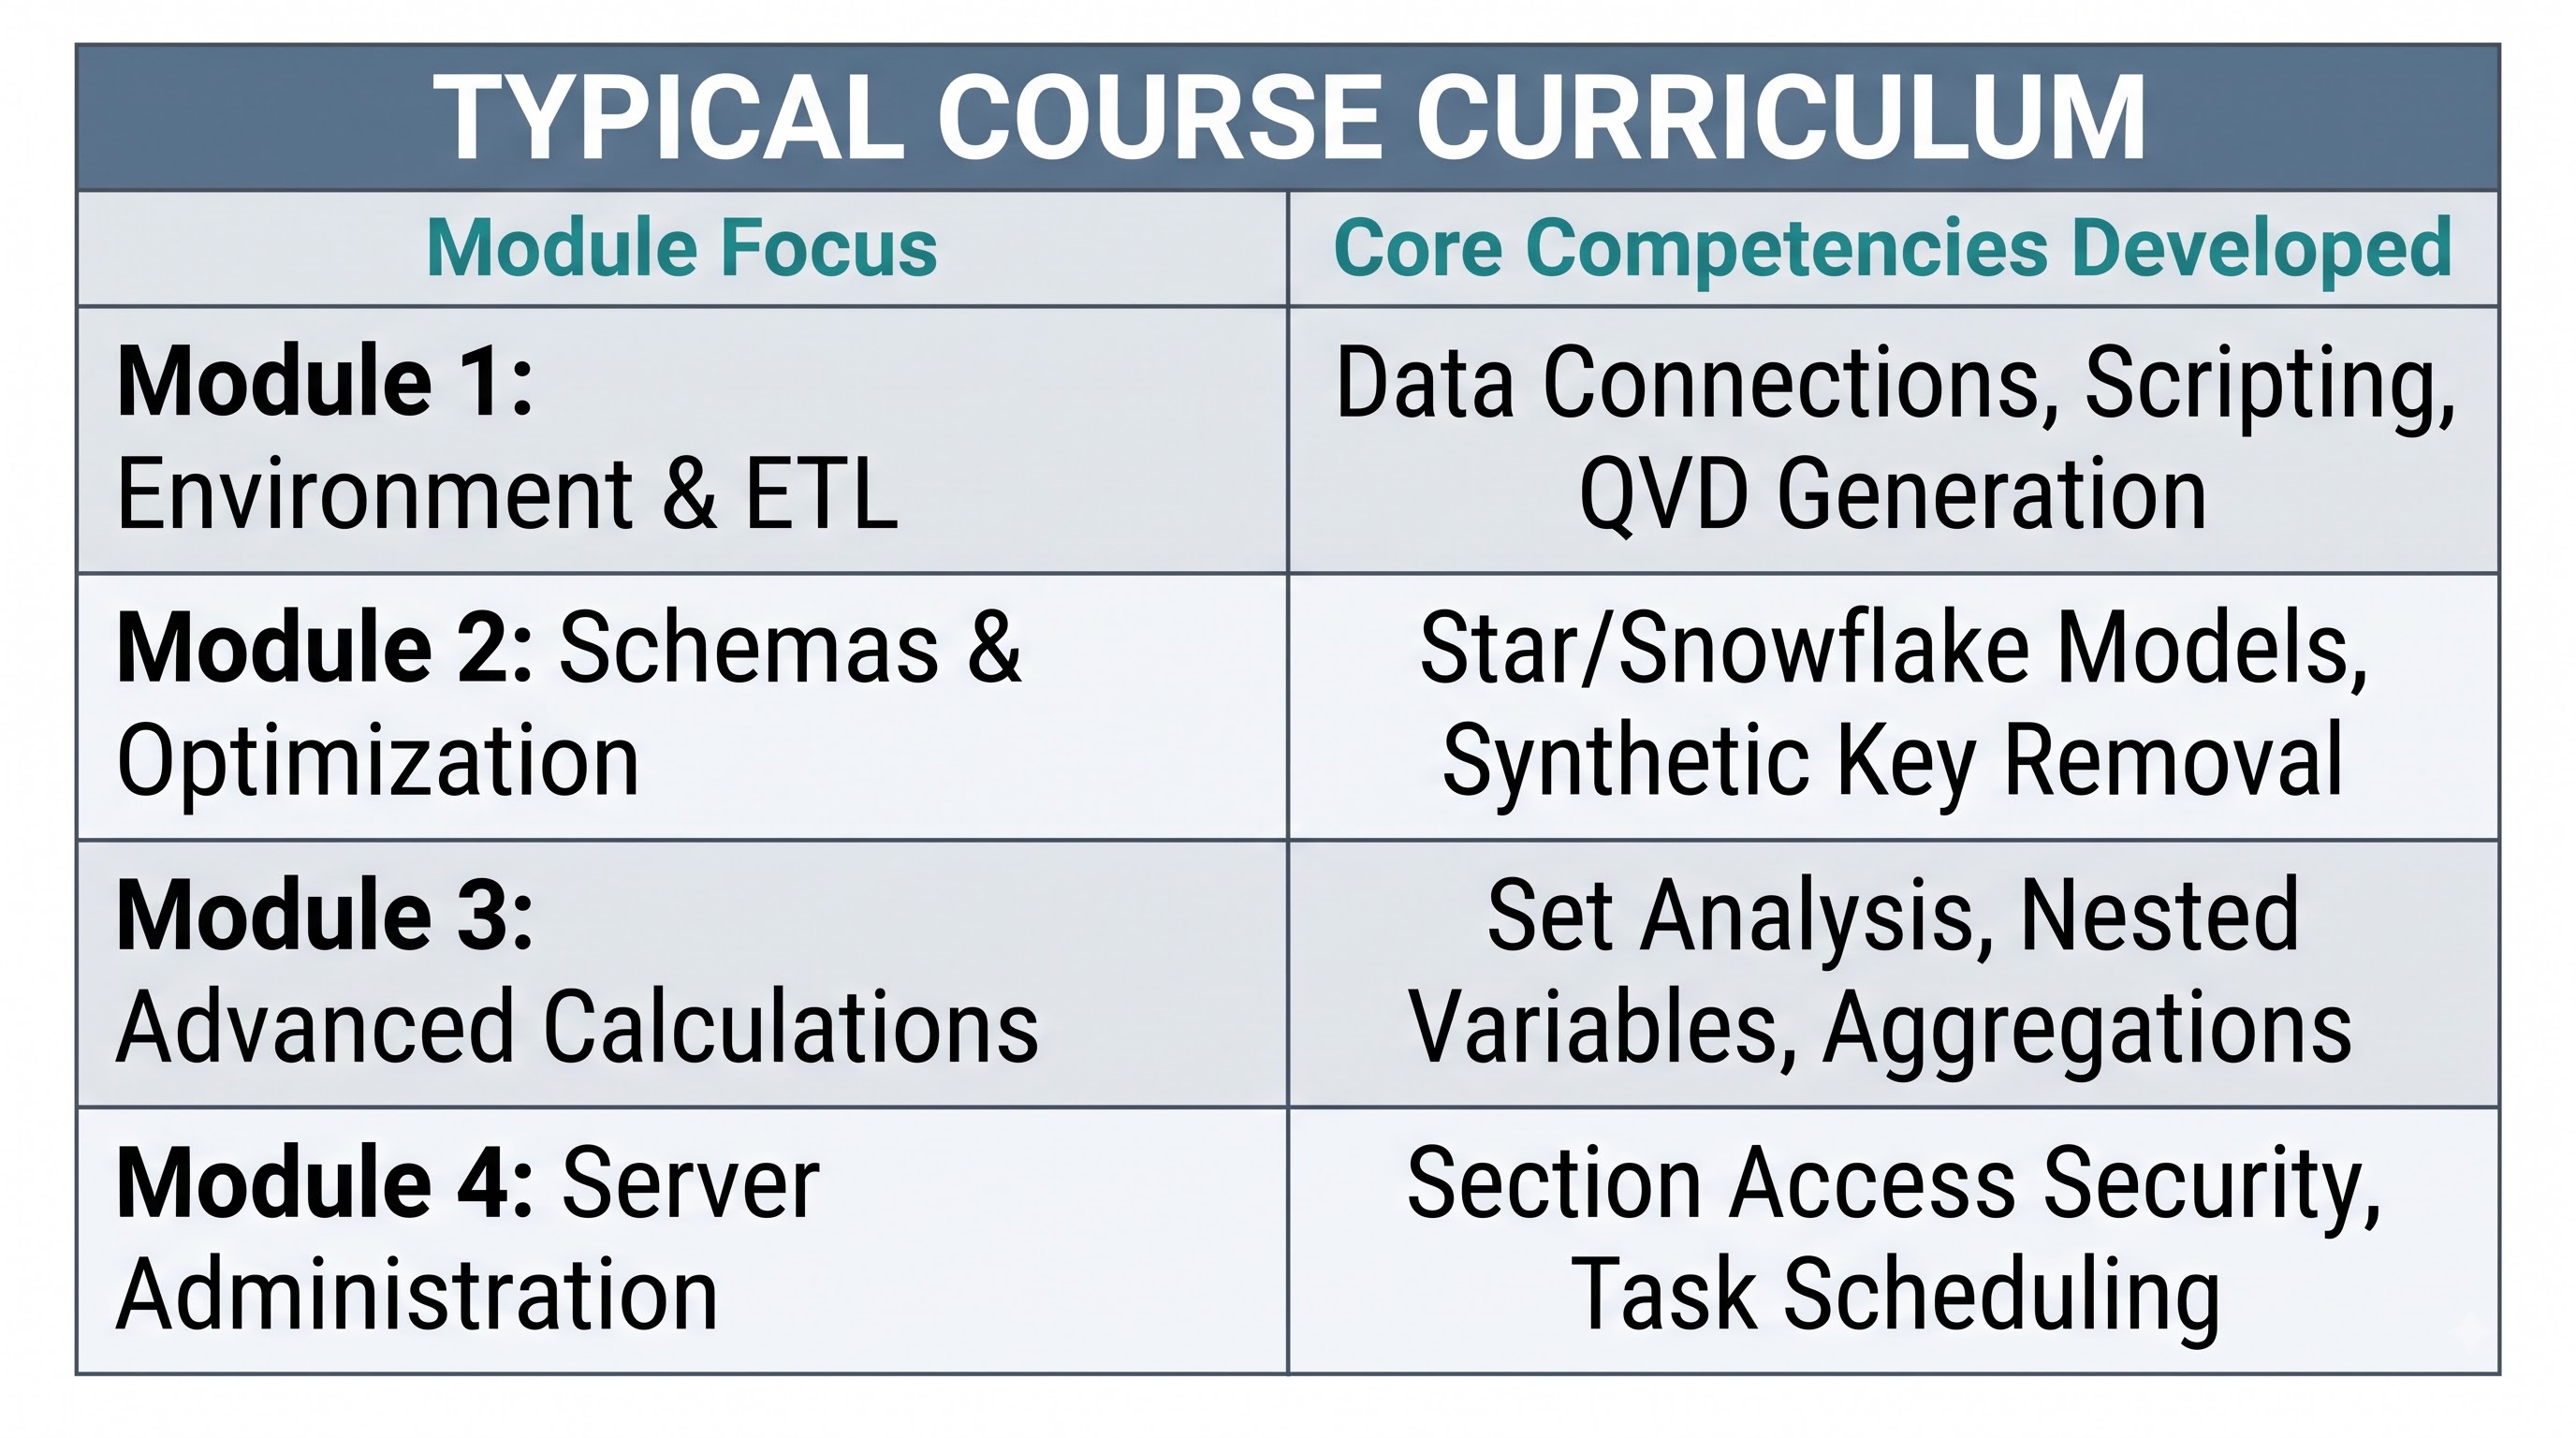
Because enterprise reporting environments carry unique infrastructure requirements, enrolling in a dedicated qlikview course helps developers master critical administrative and back-end skill sets. These courses cover essential infrastructure topics, including QlikView Server (QVS) management, publisher task scheduling, document distribution, and row-level Section Access security.
Learning how to secure data at the user level is critical for enterprise deployments. Section Access ensures that when a regional sales manager opens a company-wide report, the server automatically filters the data so they only see numbers for their assigned territory.
Practical Applications Across Enterprise Sectors
To see the real-world impact of guided analytics, consider how different industries use custom dashboard applications to manage operations and monitor performance:
Banking and Financial Services: Financial institutions track market risk exposures, credit portfolios, and transactional fraud by consolidating feeds from core banking databases into centralized operational command centers Risk officers rely on cross-filtering features to test hypothetical market stress scenarios on the fly.
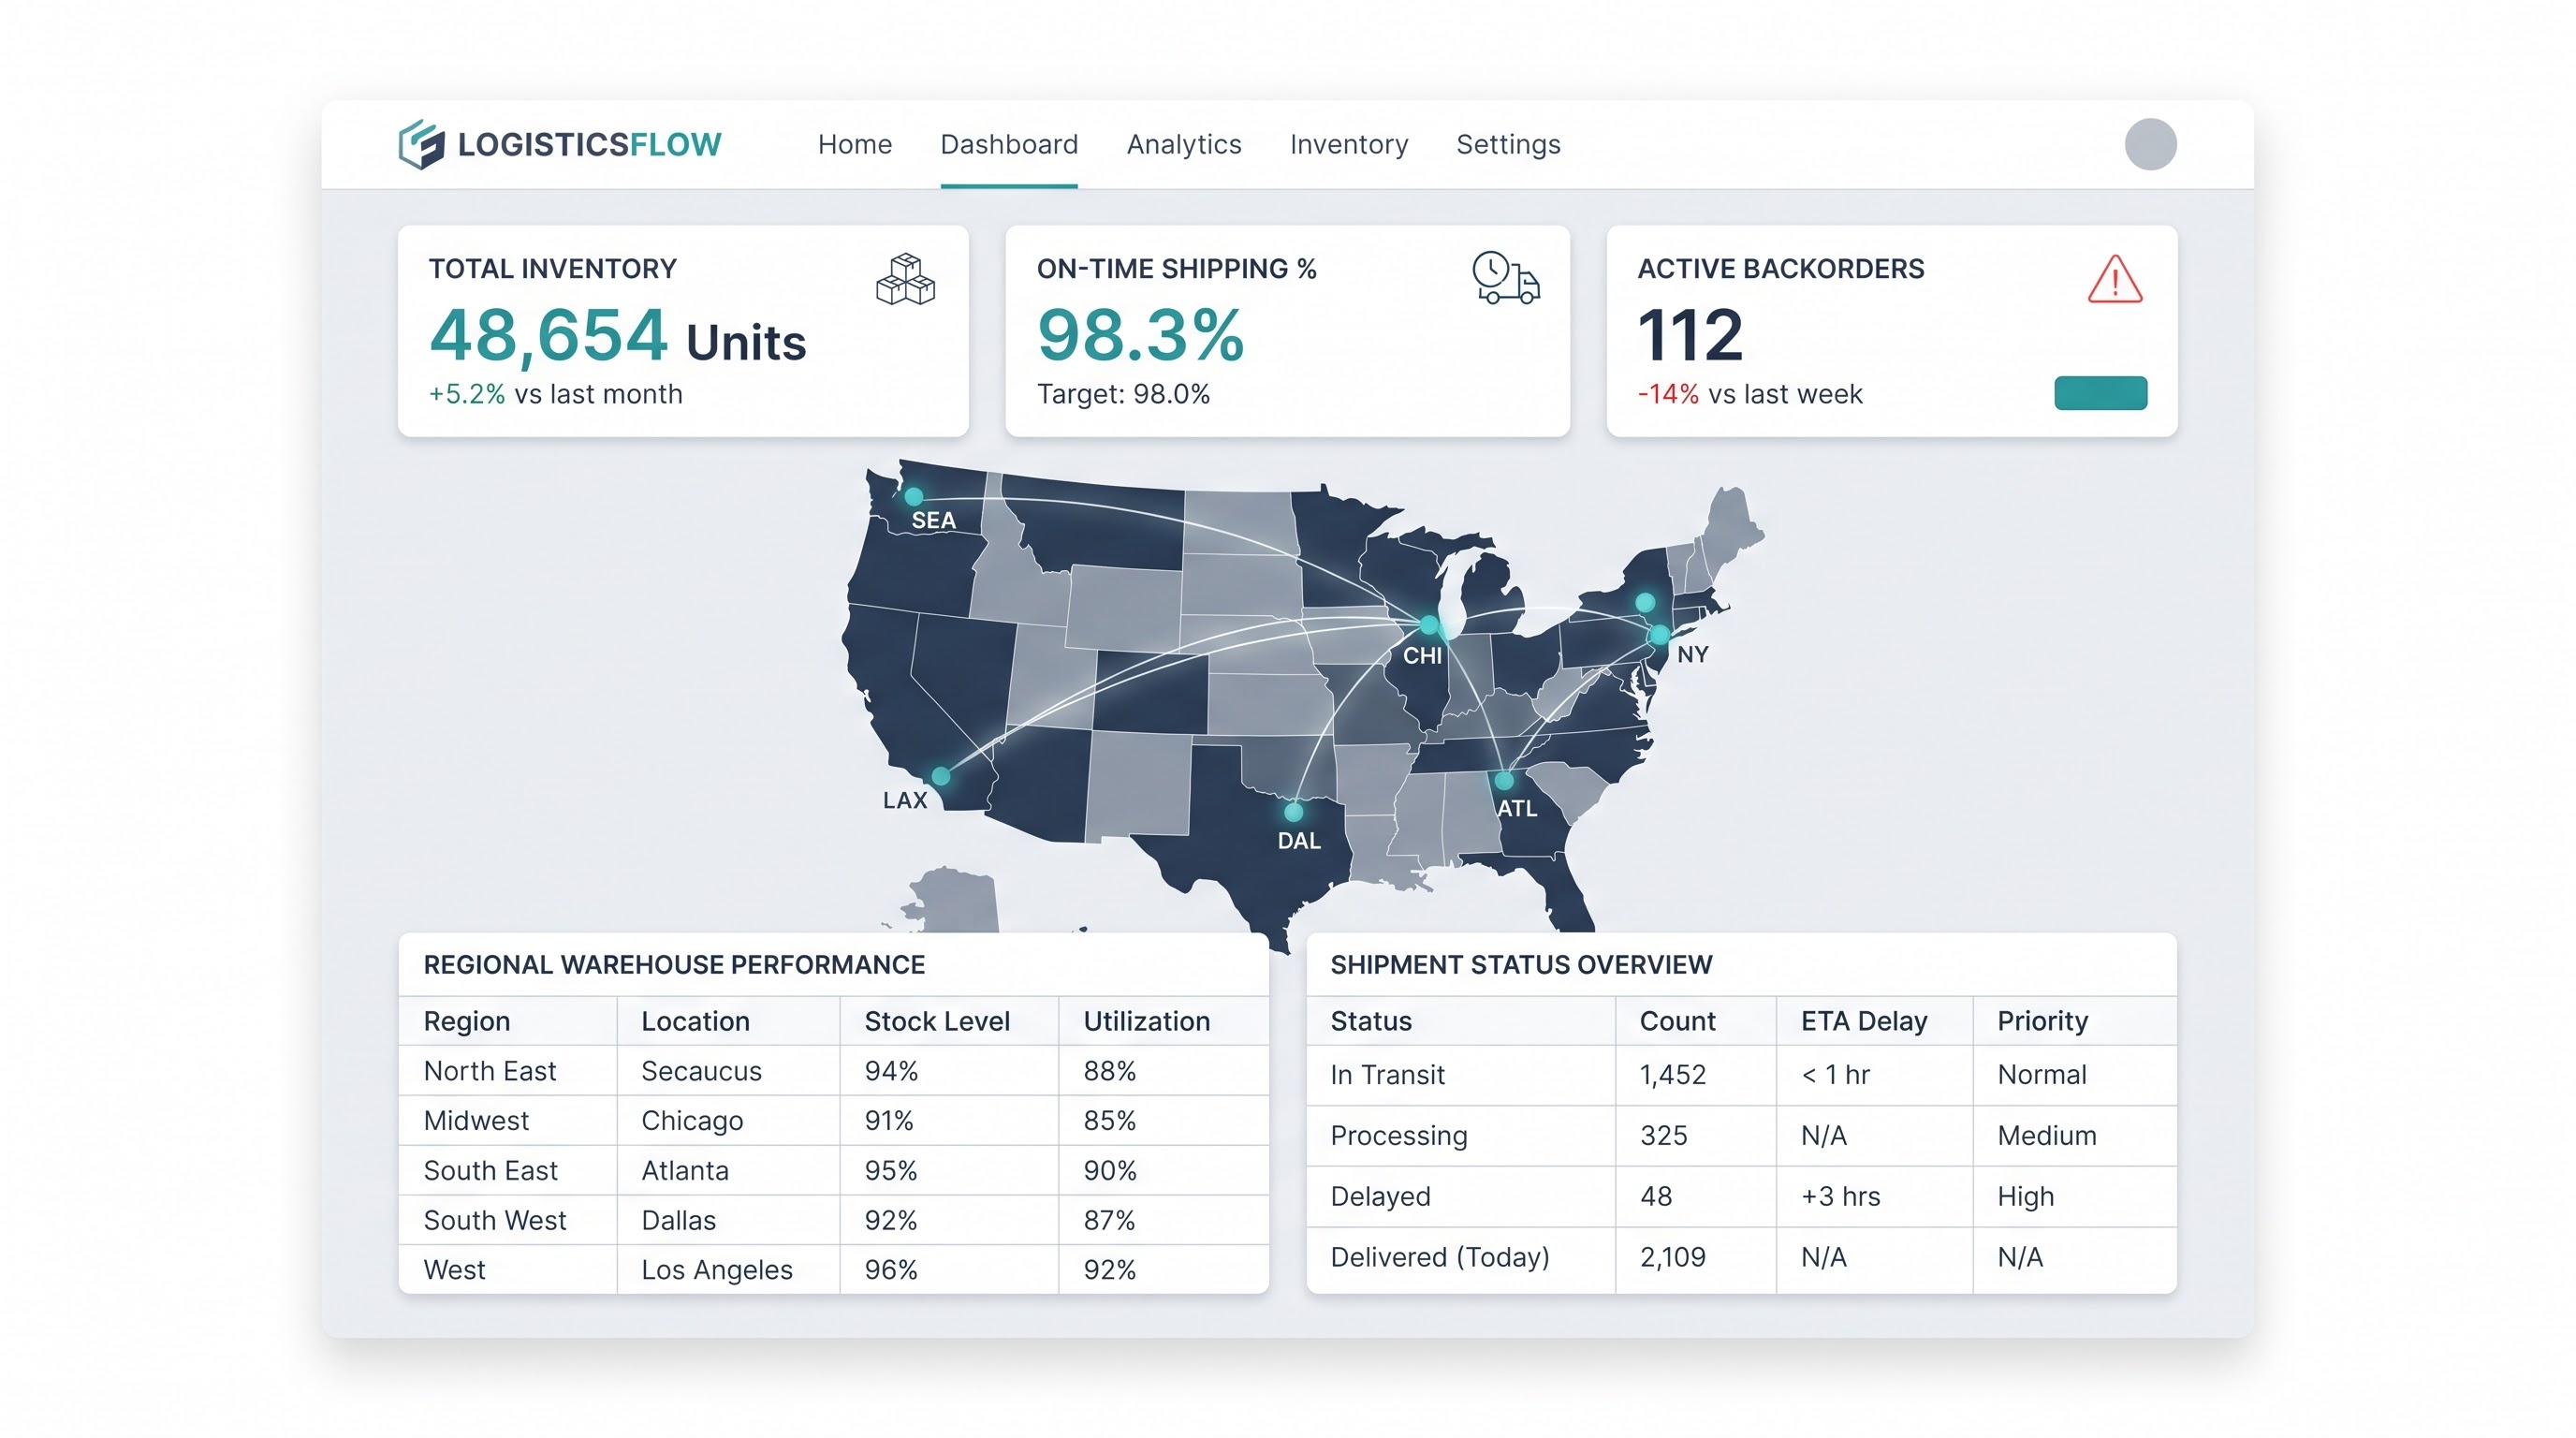
Supply Chain and Logistics: Global distributors use real-time dashboards to track inventory movements across multiple fulfillment hubs. Analysts quickly cross-reference supplier delivery timelines against local warehouse stock levels to address inventory shortages before they impact customer order fulfillment.
Retail Operations: Retail managers use daily reporting dashboards to analyze sales figures down to individual store locations and product SKUs. By combining sales data with promotional calendars, regional directors can instantly identify which marketing campaigns are driving store traffic and which ones are underperforming.
Modern Market Realities: QlikView vs. Qlik Sense
The business intelligence industry has evolved significantly over the past decade. Understanding where QlikView sits relative to modern alternatives—like Qlik Sense—is essential for making informed technical decisions.
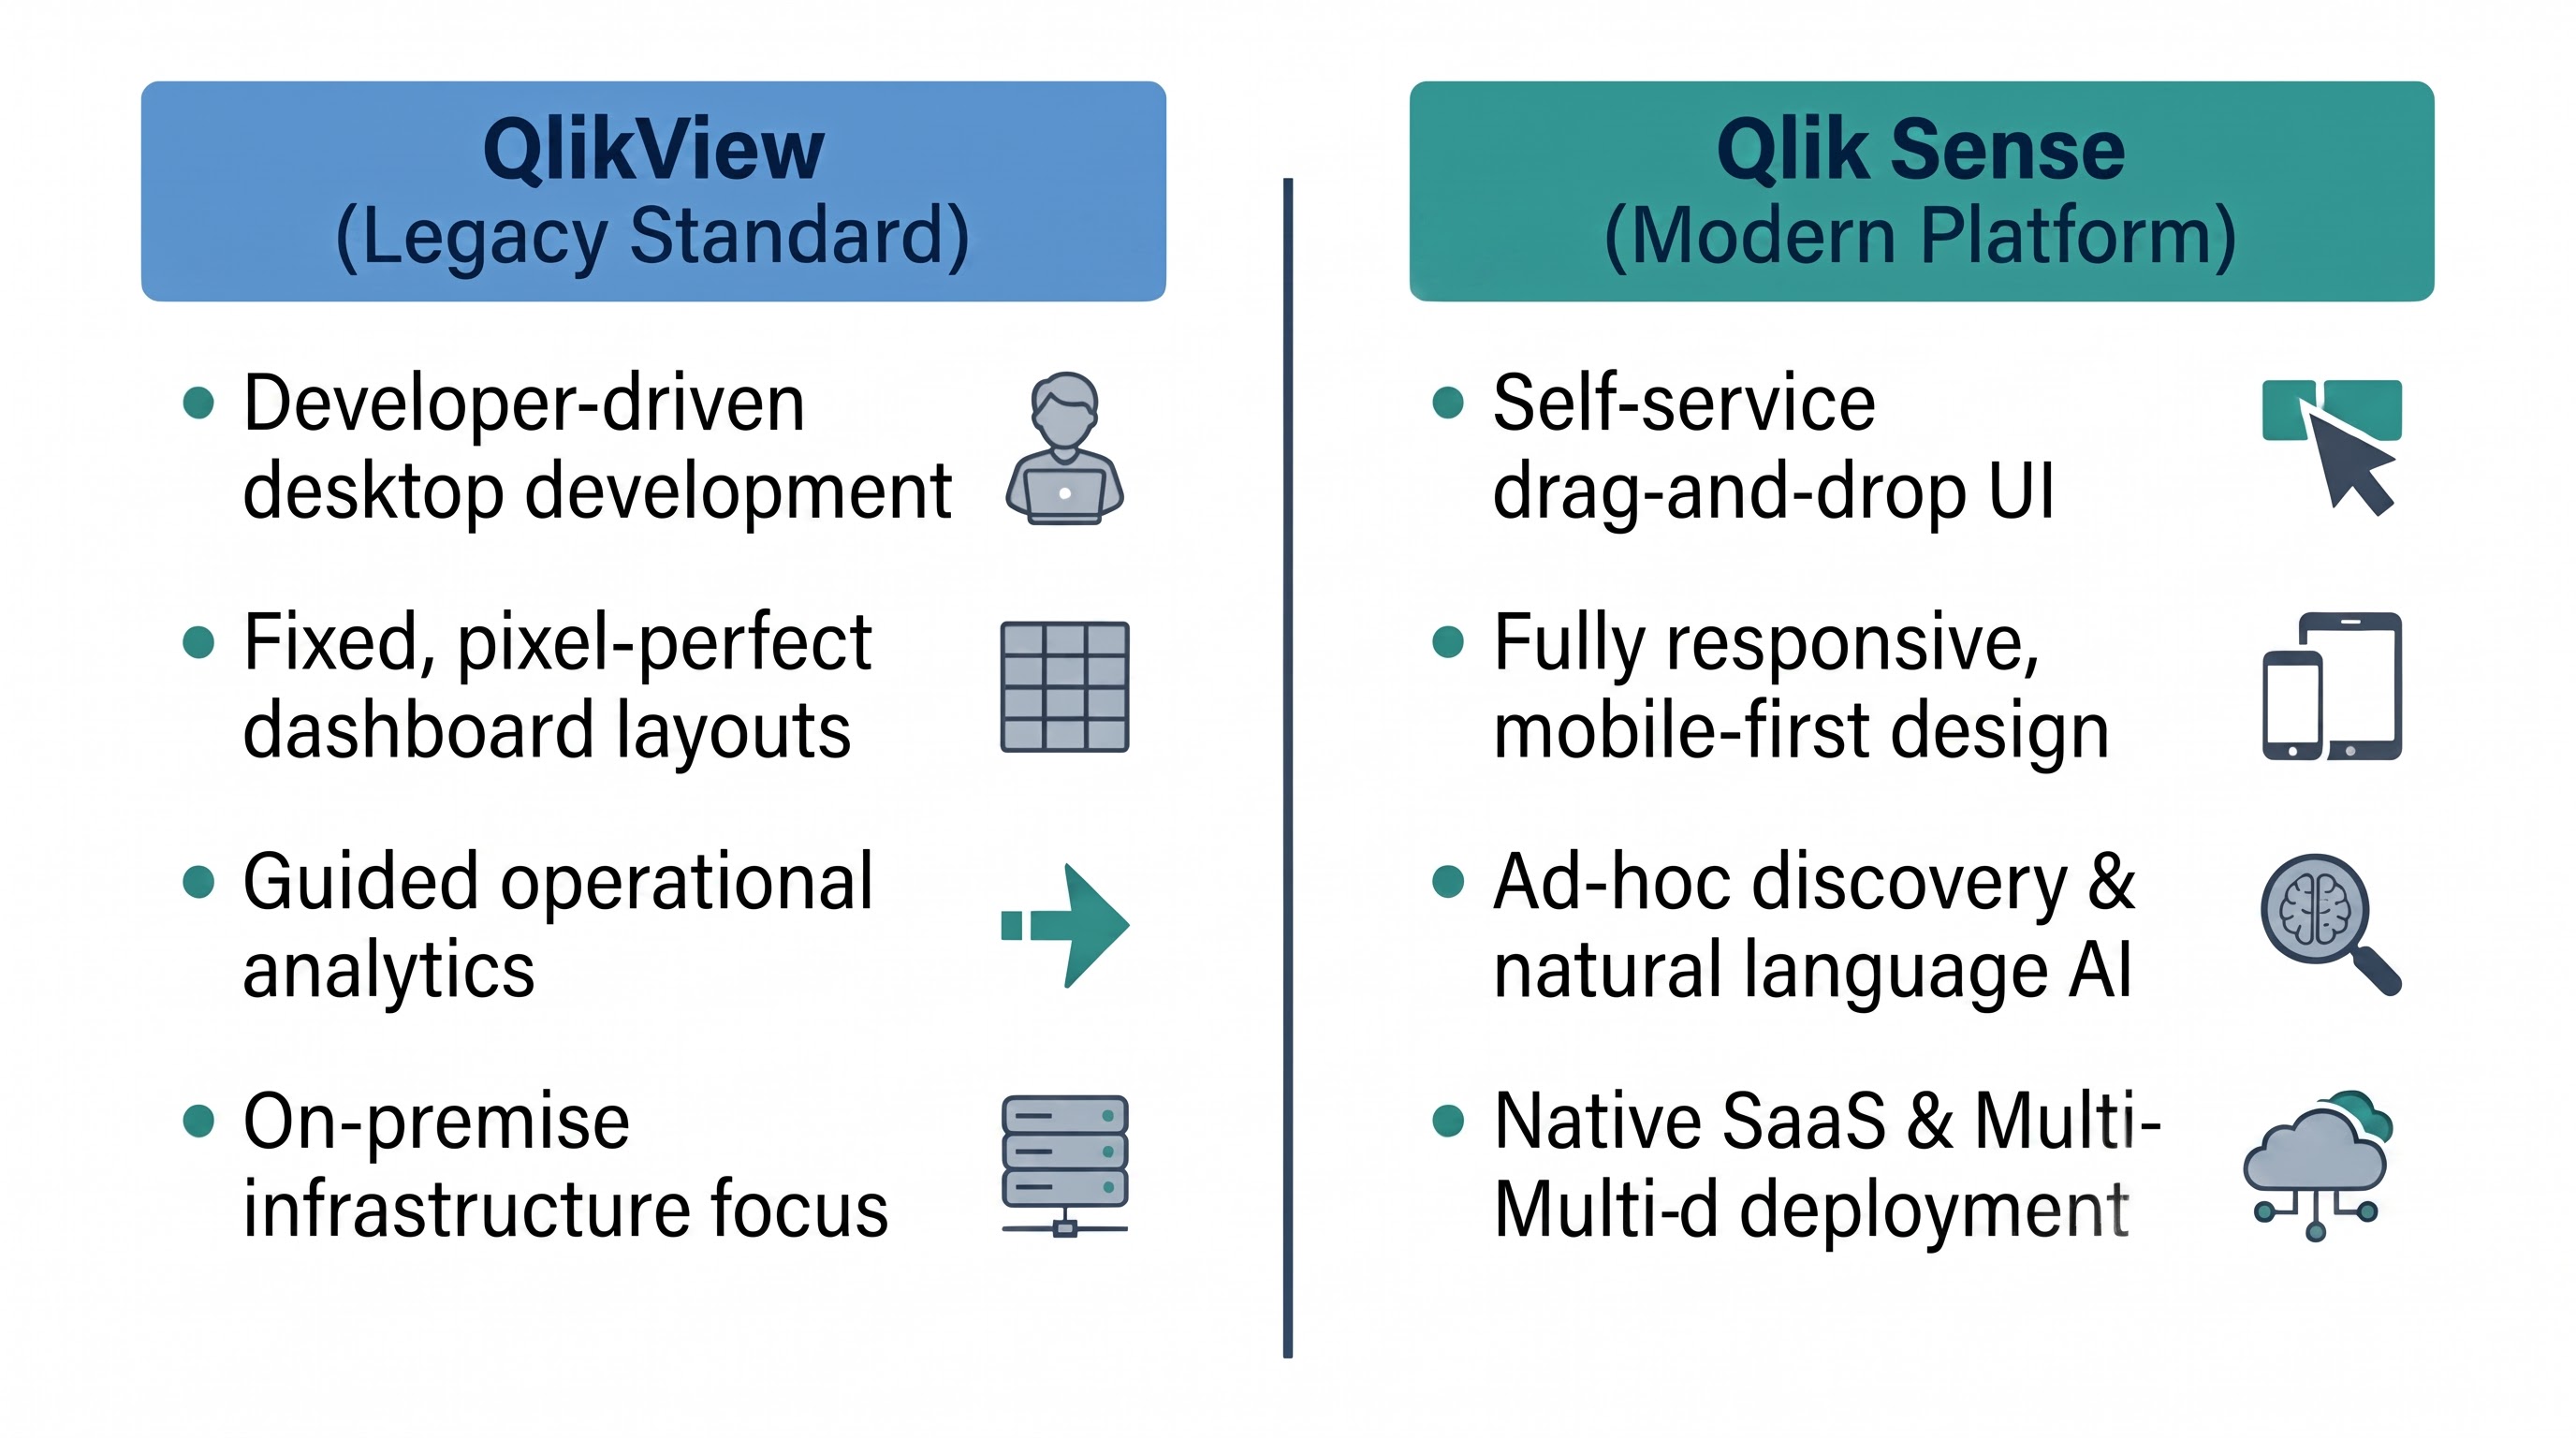
While both tools run on the same underlying associative engine, they serve distinct organizational purposes:Organizations rarely throw away working QlikView infrastructure overnight. Instead, most adopt a dual-run strategy using modern co-existence licenses. This approach keeps core operational applications running on established on-premise servers while migrating newer, self-service dashboard workflows over to cloud environments.
Advancing Your Technical Career Path
Finding the right structured qlikview training can accelerate your progress, whether you're building fresh data models or updating existing business reporting systems.
A comprehensive training program should focus heavily on practical project scenarios, including:
File System Automation: Building scripts that read, store, and organize temporary QVD (Qlik Data) files automatically.
Performance Tuning: Benchmarking memory usage, stripping out unneeded fields, and trimming high-cardinality timestamps to speed up dashboard load times.
Interface Design: Mastering custom color styling, conditional display rules, and dynamic layout containers to build clean, professional user interfaces.
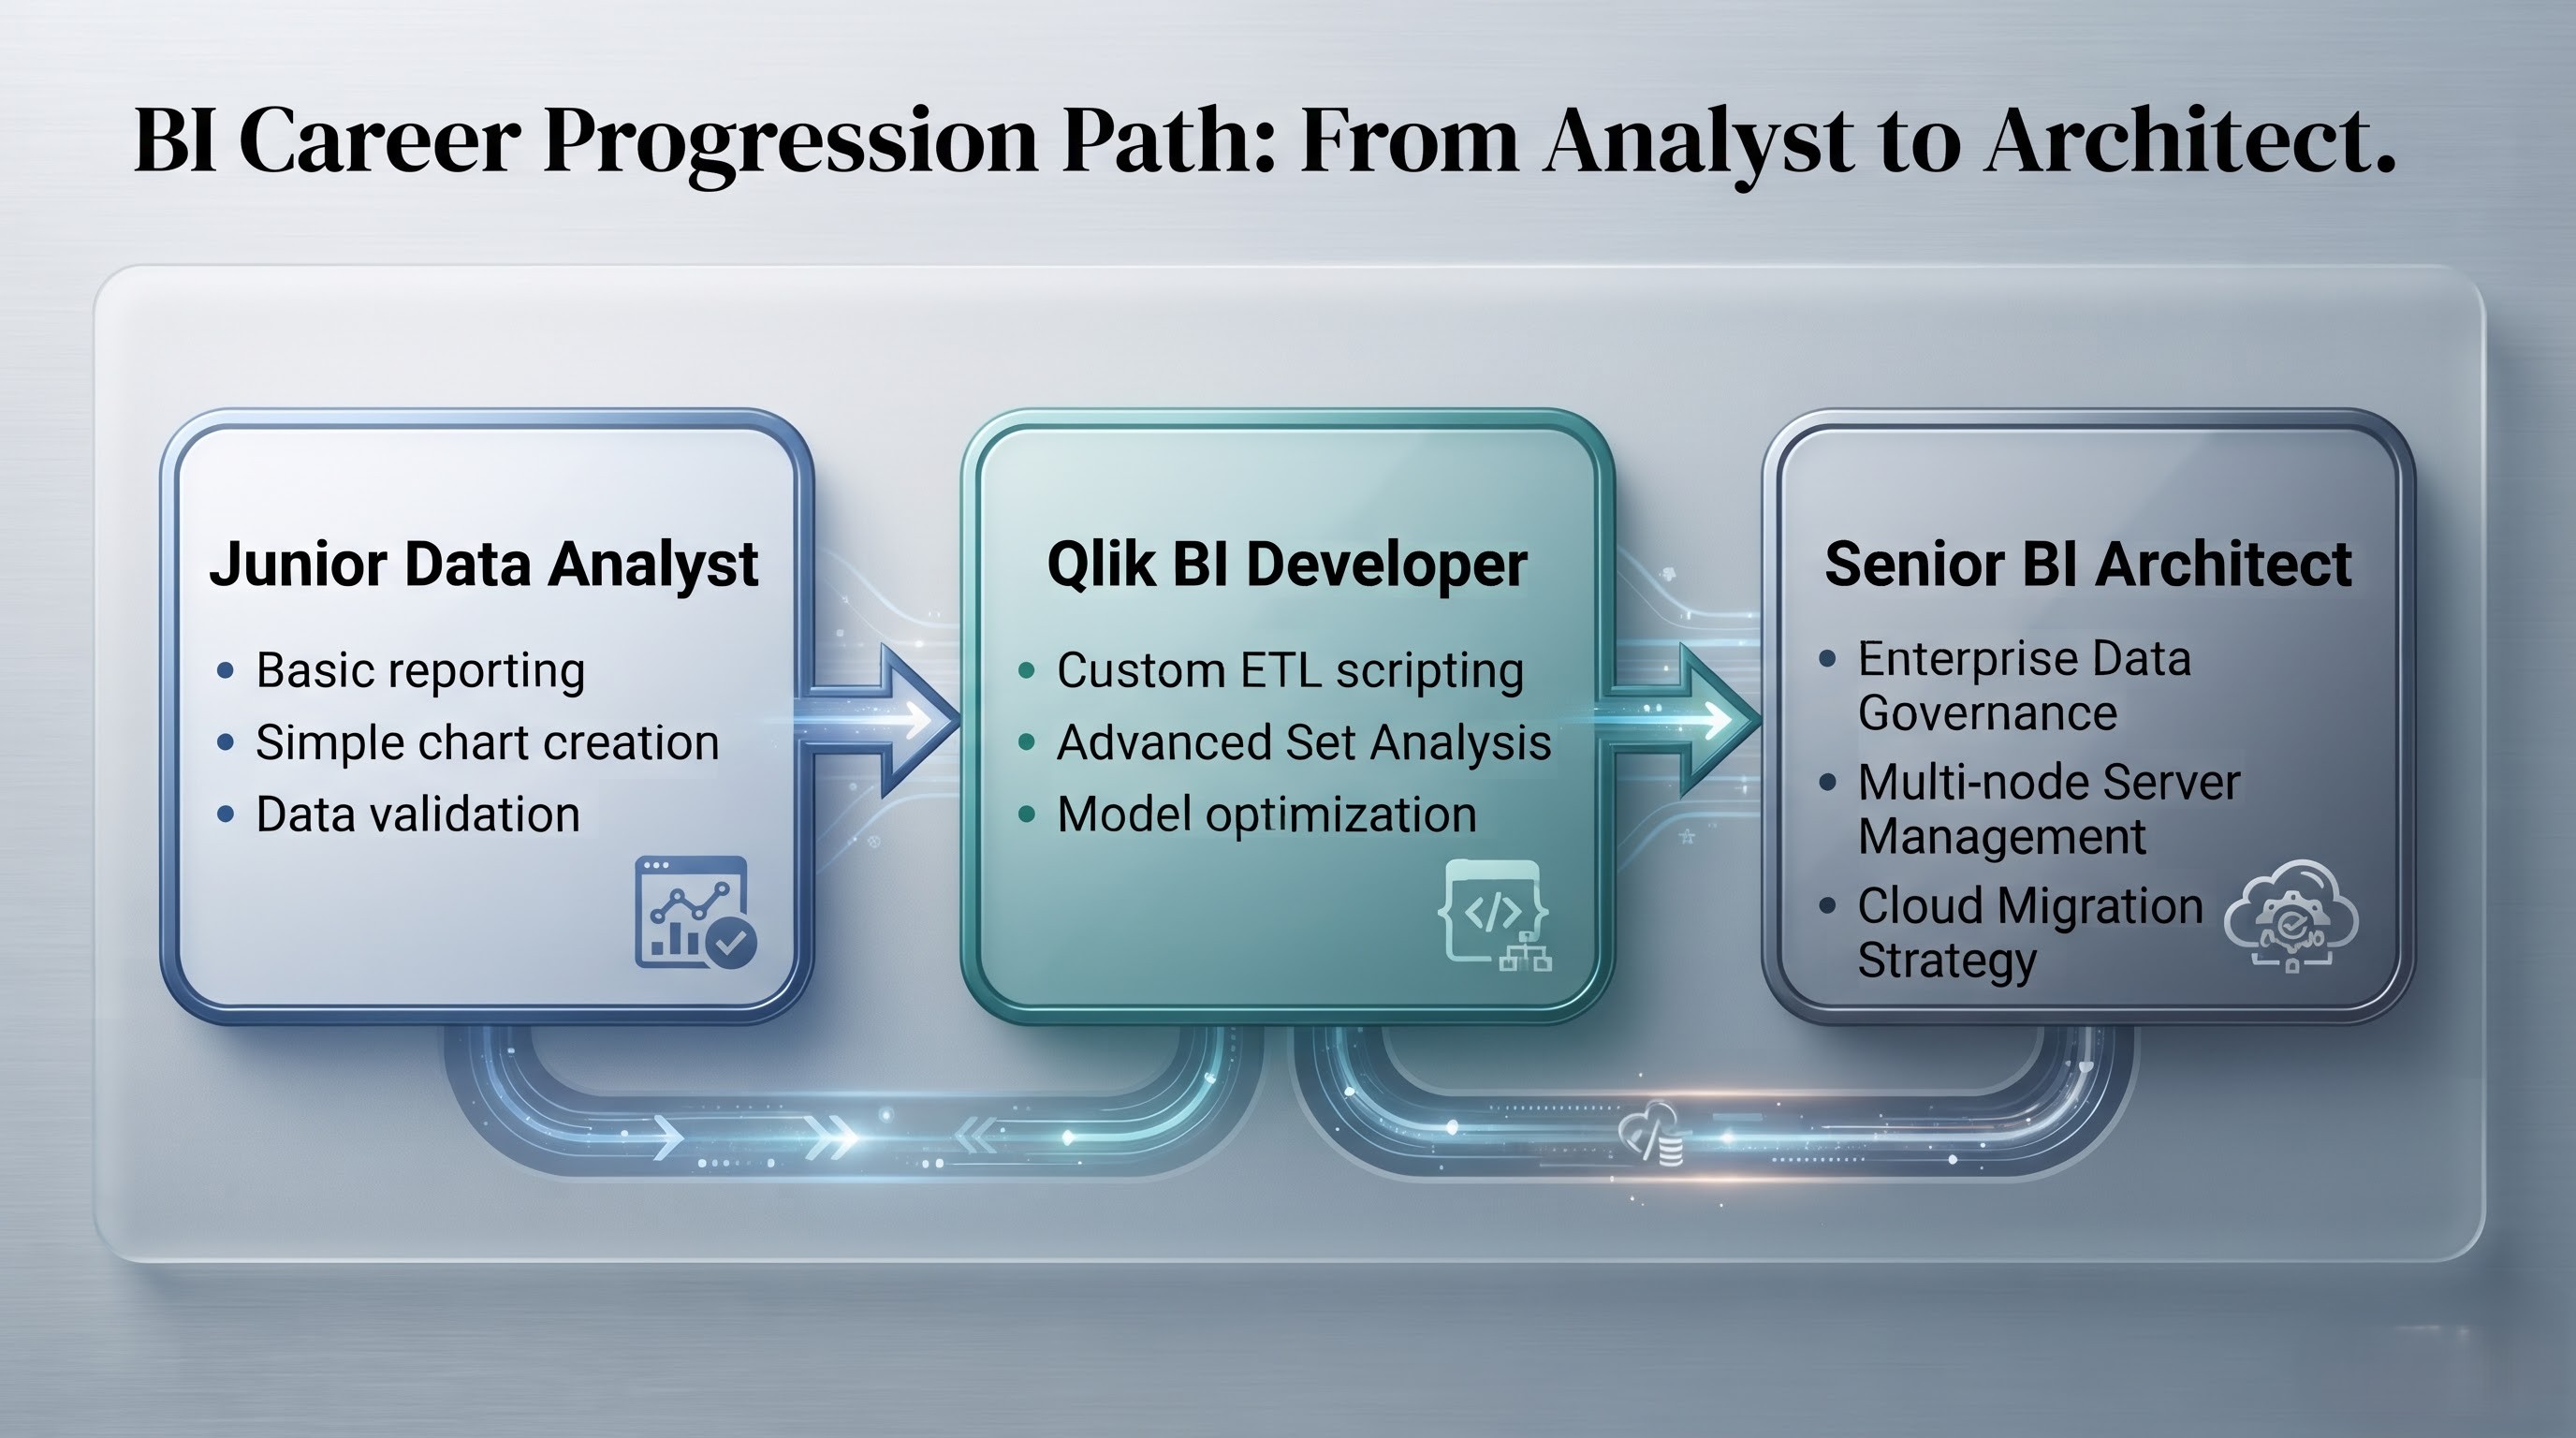
Hands-on training gives developers direct experience troubleshooting real-world code bugs—preparing them to handle complex business requirements across enterprise projects.
Enterprise System Modernization and Migration Strategies
As enterprise IT architectures transition toward modern cloud ecosystems, companies must carefully manage their legacy dashboard portfolios. The goal is simple: retain legacy operational data logic while taking full advantage of modern cloud capabilities.
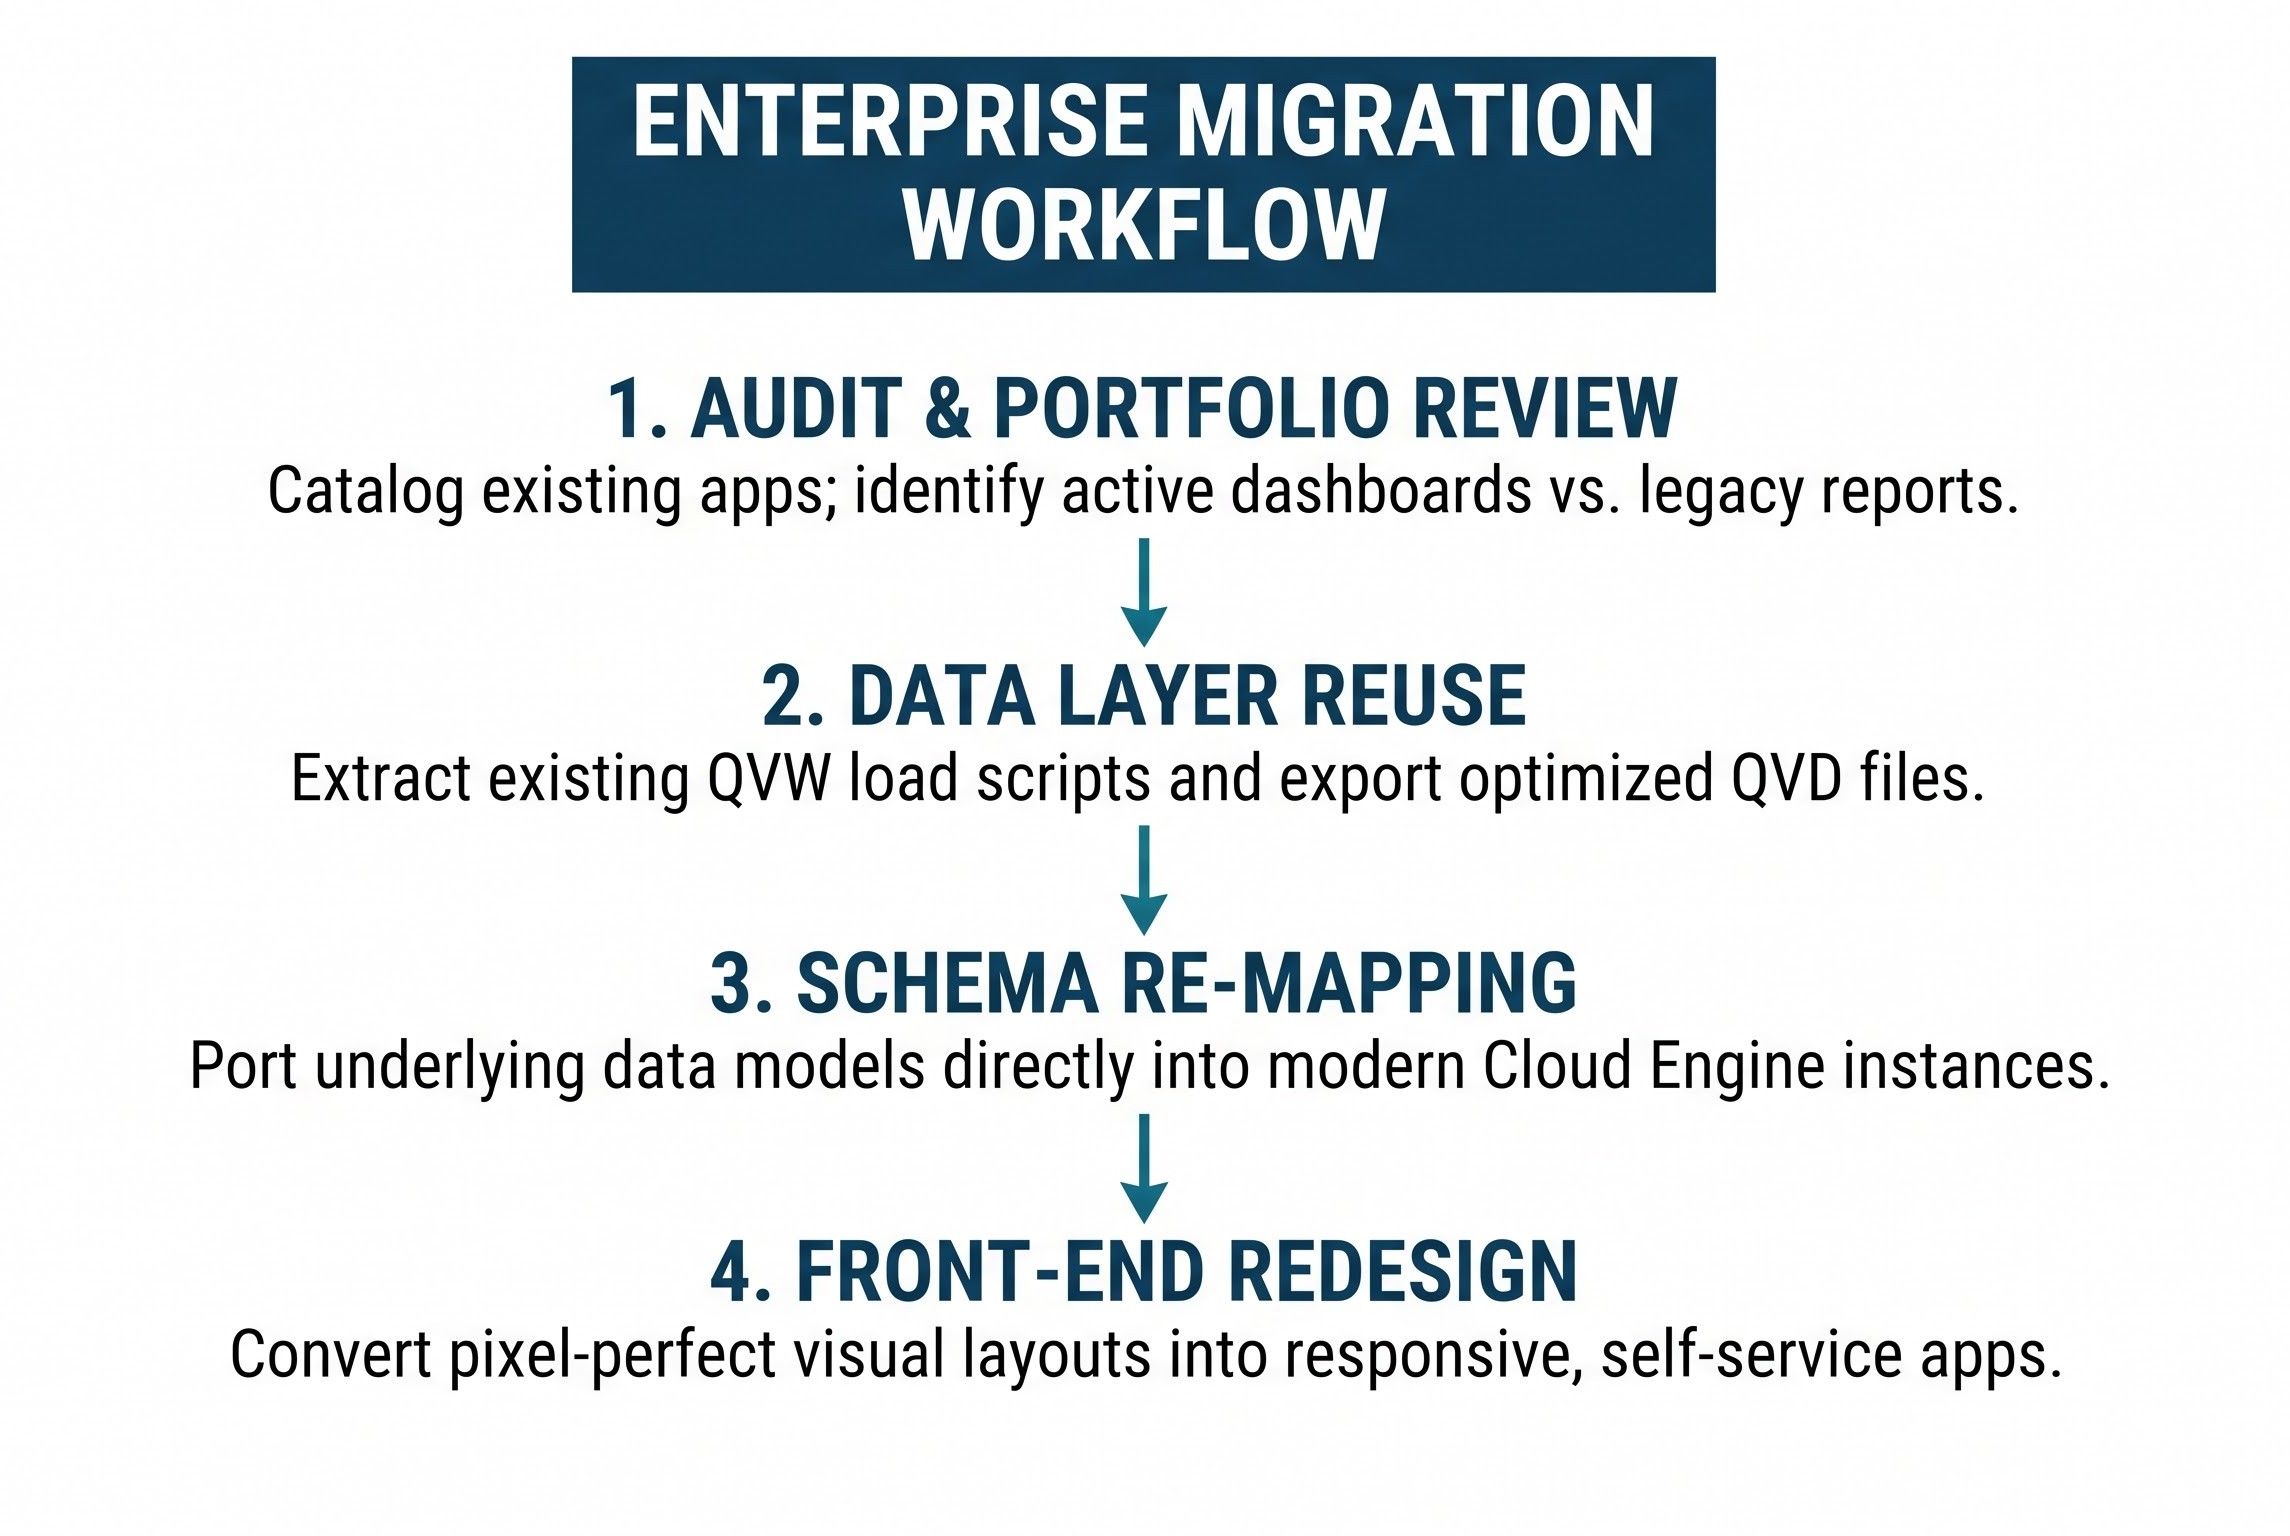
Migrating an enterprise application involves a clear, four-stage process:
Portfolio Audit: Review existing dashboard usage to flag essential operational reports, combine redundant applications, and retire unused legacy assets.
Data Layer Extraction: Re-use established data transformation logic. Because QlikView and Qlik Sense share core engine roots, underlying extraction scripts and QVD data layers can often be moved directly into modern cloud environments with minimal editing.
Data Model Validation: Load existing schemas into new cloud environments, verifying that key fields, complex Set Analysis expressions, and table relationships match baseline metrics exactly.
Front-End Redesign: Rebuild fixed dashboard layouts into flexible, responsive user interfaces designed for mobile access and self-service exploration.
This structured approach helps organizations modernize their reporting environments smoothly, avoiding data loss and minimizing operational downtime.
Practical Developer Training and Portfolio Building
For analytics professionals seeking long-term career growth, completing hands-on qlik developer training builds the deep technical expertise needed to manage complex data projects end-to-end.
When building an enterprise-ready development portfolio, focus on these core competencies:
Architecting Multi-Tier Data Pipelines: Structure data setups into distinct extract, transform, and presentation layers using clean QVD storage files.
Implementing Advanced Security Models: Configure robust Section Access tables to enforce row-level security and dynamic data hiding based on active user credentials.
Building Dynamic Dashboard Interactivity: Apply conditional visual displays, custom layout containers, and variable-driven parameters to deliver responsive, user-friendly applications.
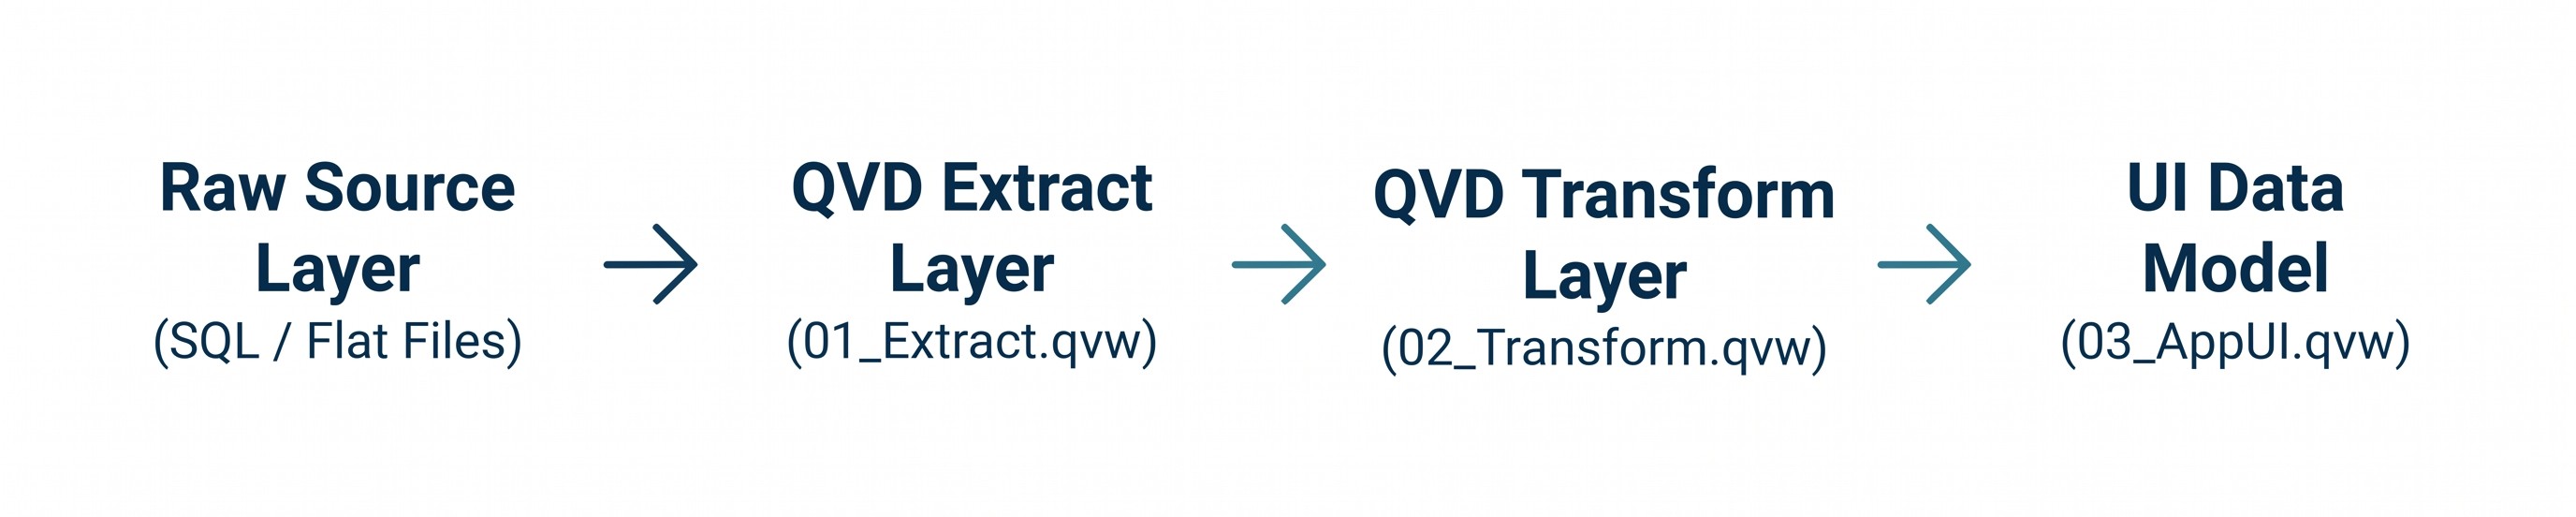
Developing real-world applications across these core areas ensures you build the practical experience required to manage enterprise analytics ecosystems at scale.
Conclusion and Strategic Industry Outlook
QlikView revolutionized business analytics by introducing fast, in-memory data exploration to corporate reporting environments. While modern analytics has largely shifted toward cloud-hosted, self-service platforms, the core engineering principles established by QlikView—associative data indexing, memory-optimized schemas, and Set Analysis calculations—remain vital to enterprise business intelligence.
Whether you are supporting long-standing legacy applications, maintaining mission-critical reporting scripts, or guiding a full-scale cloud migration, mastering this technology gives you a deep, practical understanding of modern analytics infrastructure. By grounding your technical skills in solid data modeling, clean script development, and smart layout design, you can continue delivering immediate, actionable business value across any data environment.