
The Death of the Dashboard: How AI and Microsoft Fabric Are Changing Business Intelligence
Last updated on Aug 10, 2026
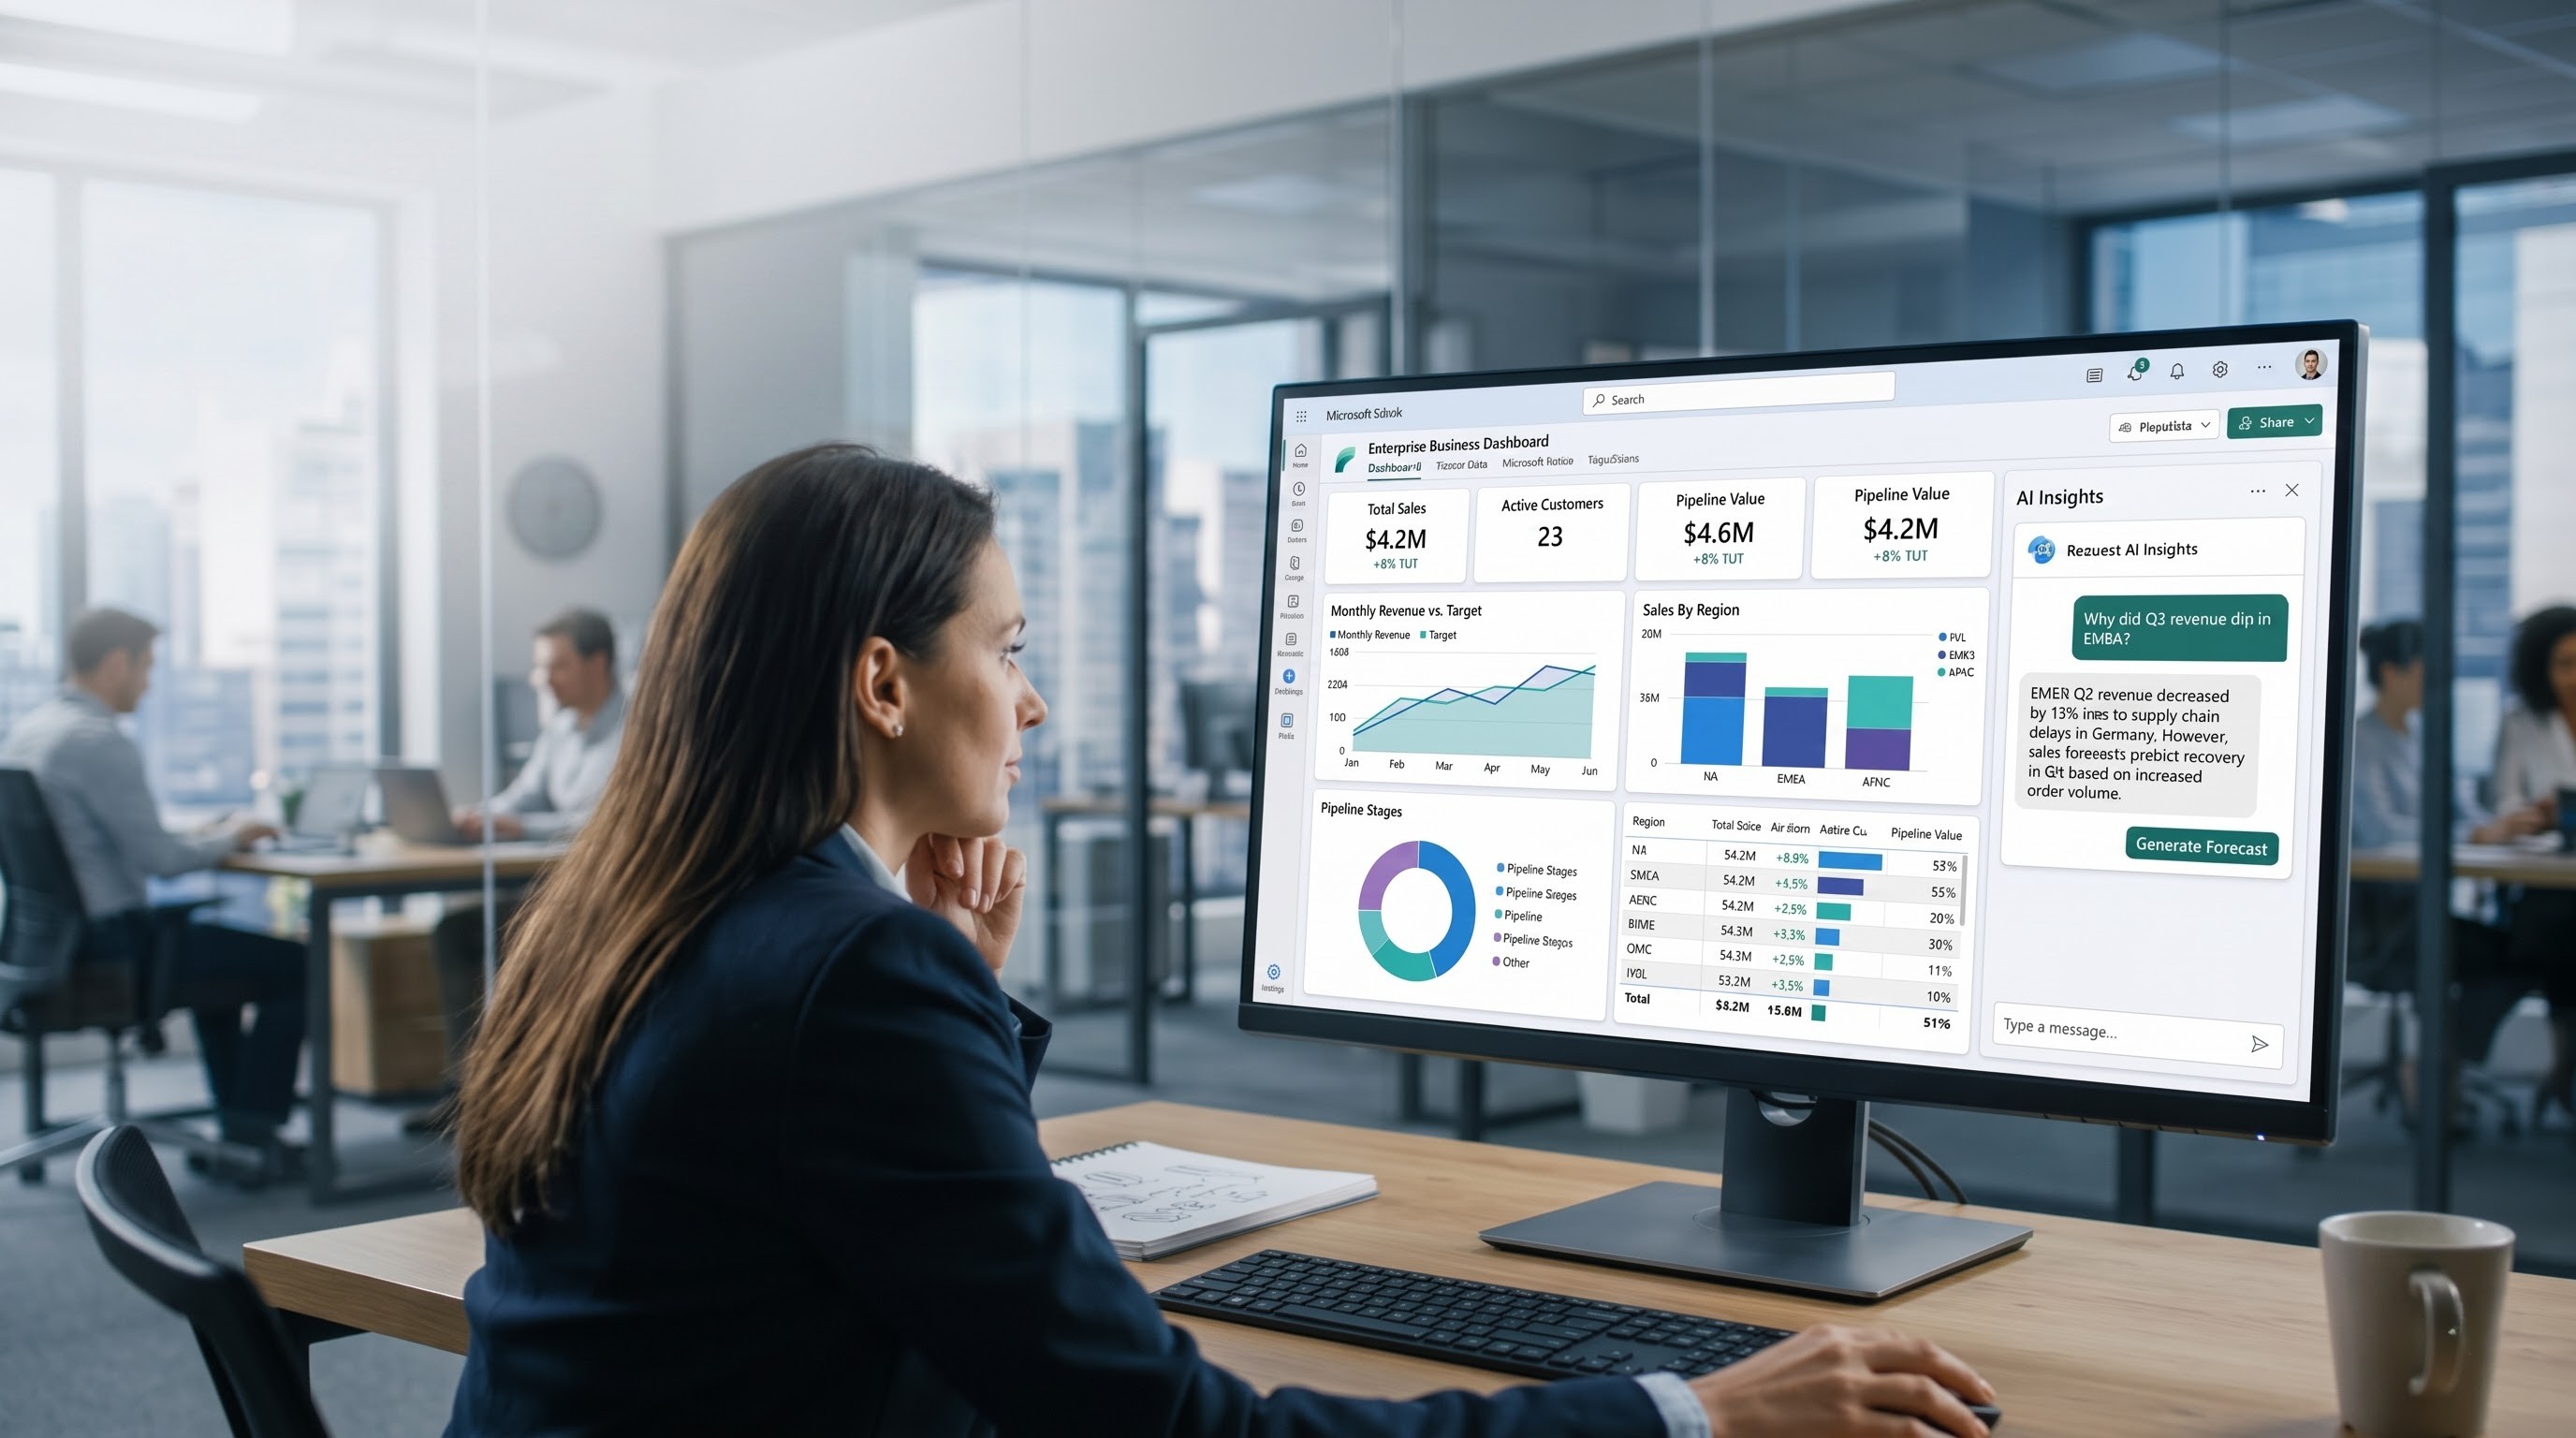
For years, the dashboard was the face of Business Intelligence. A manager opened Power BI, looked at revenue, checked a few charts, compared this month with the previous one, and moved on. Dashboards made business data visible and gave organizations a common place to monitor performance.
But there was always one limitation..
Someone still had to interpret the numbers.
A dashboard could show that sales had dropped 14%. It could show which region performed poorly. It could even highlight a change in customer behavior. But the user still had to investigate the reason.
Today, that relationship with data is beginning to change. People increasingly expect to ask questions
in plain language and receive useful answers instead of navigating through several report pages.
Microsoft is bringing these capabilities into Power BI and Microsoft Fabric through Copilot,
semantic models, data agents, and AI-assisted analytics.
So, is the dashboard dying?
Not really.
What is changing is its role.
The dashboard is moving from being the final destination of Business Intelligence to becoming one part
of a much larger data experience, and that shift has important consequences for businesses,
BI professionals, and anyone building a career around Microsoft's data ecosystem.
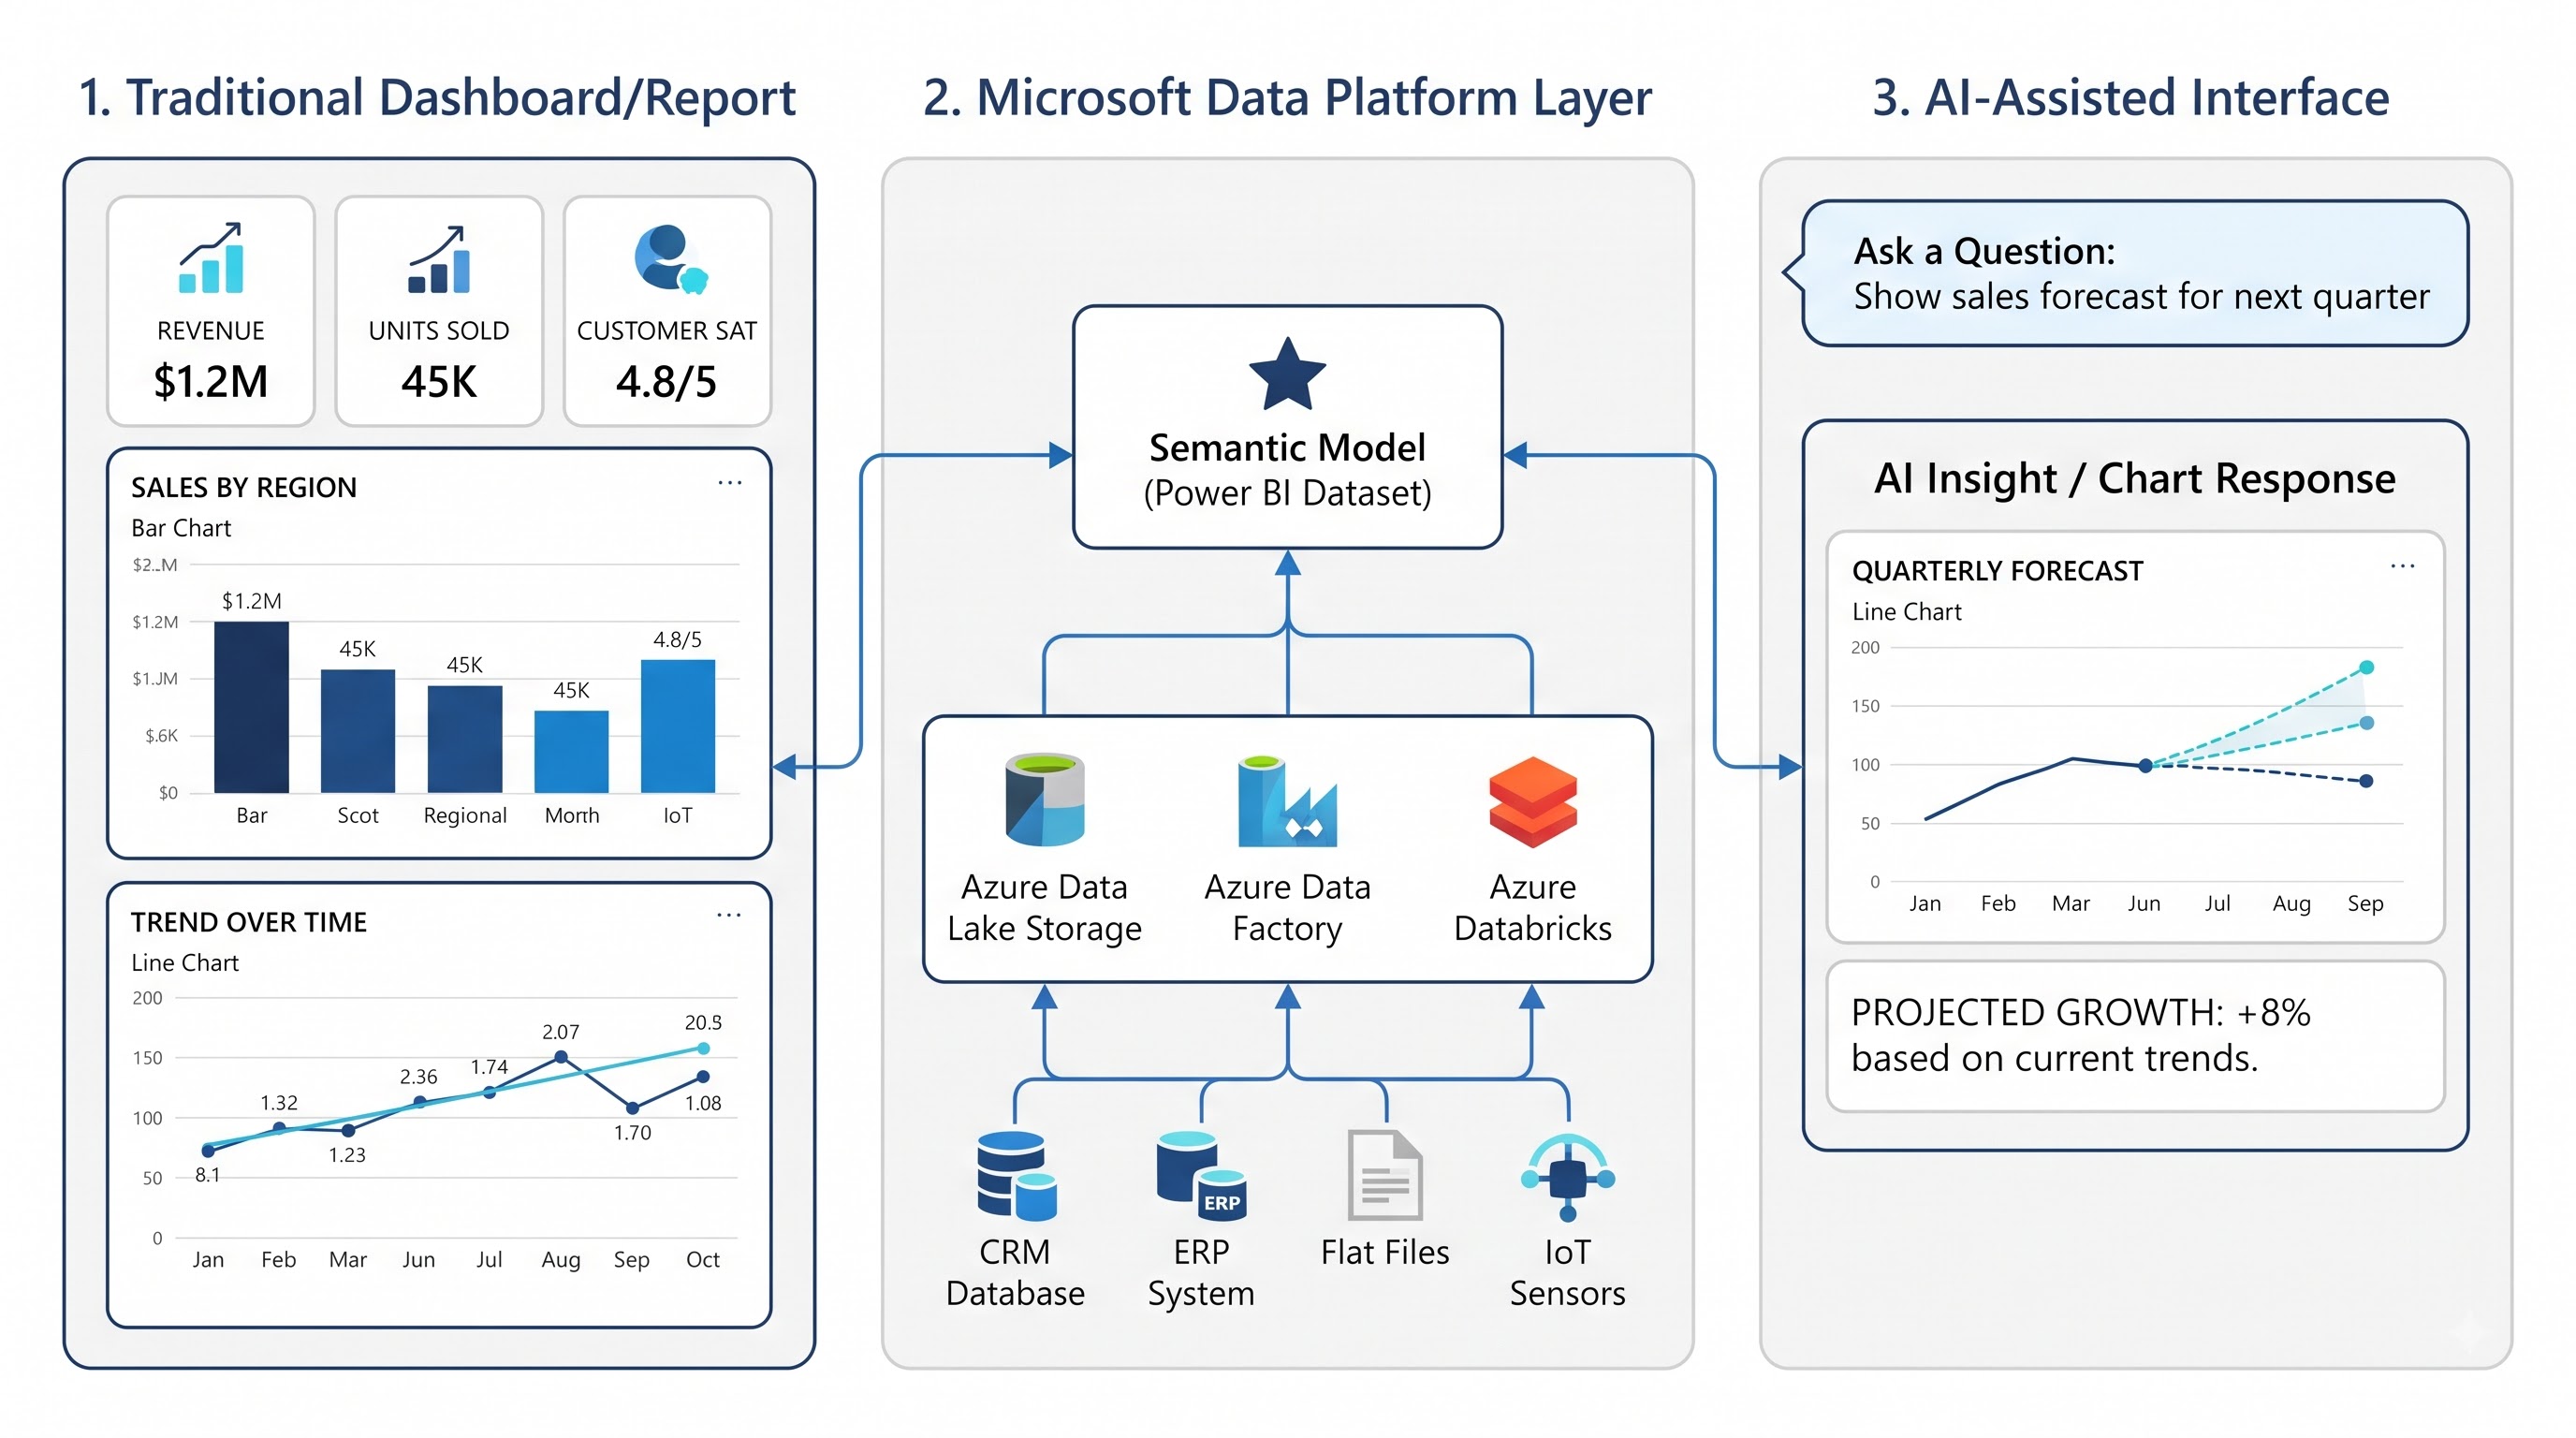
The Dashboard Was Never the Real Goal
Companies never built dashboards simply because they wanted attractive charts.
They built them because they had a visibility problem.
Sales data lived in one system. Customer information sat somewhere else. Finance had spreadsheets.
Operations had its own applications. Analysts spent hours combining information
before management could even begin asking questions.
The dashboard simplified that process.
Instead of asking an analyst:
“How much did we sell last quarter?”
A manager could open a report and see the number. That was a huge improvement.
But dashboards have always been better at answering “what?” than “why?”
Revenue is down. Customer churn is up.
A particular product is underperforming. Those are useful observations, but they are
not necessarily explanations. The next question is usually more important:
Why is this happening?
That is where AI starts changing the traditional BI workflow.
From Looking at Data to Talking to Data
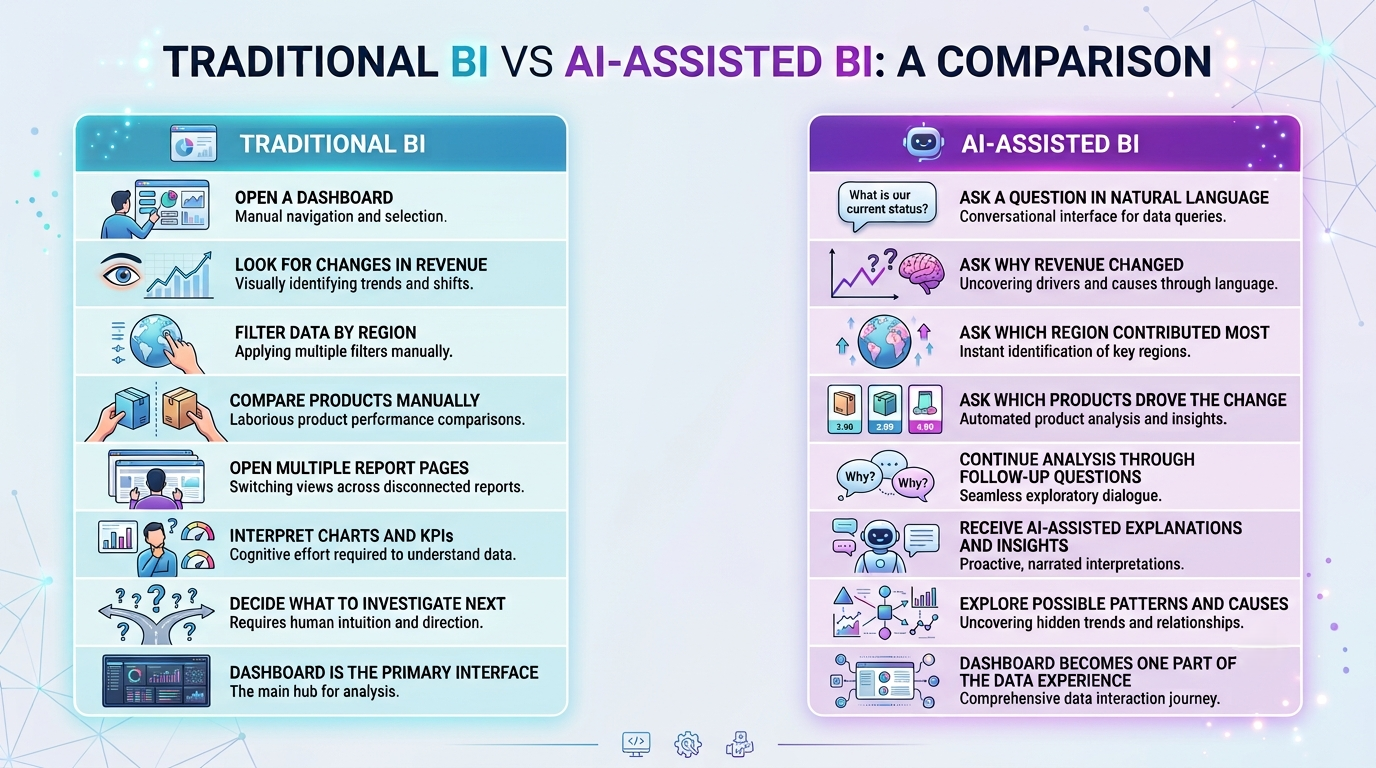
Imagine a sales manager opens a report and notices that revenue has fallen.
The traditional approach might involve filtering the report by region, checking product
categories, comparing periods, and opening another page to investigate customer behavior.
Now imagine asking:
“Why did revenue fall last month?”
Then:
“Which region contributed most to the decline?”
And finally:
“Was the change caused by lower volume, pricing, or customer churn?”
The experience becomes less about navigating the report and more about
having a conversation with the data. Microsoft's current Power BI
Copilot capabilities support natural-language interaction with reports and data,
including generating summaries, answering questions, and helping users explore information.
That does not mean AI can automatically understand every business environment perfectly.
It still depends on the quality of the underlying data, semantic models, business definitions,
permissions, and governance.
But the interface is changing. The user does not always need to know
where the answer is stored. They need to know what they want to understand.
Why Microsoft Fabric Changes the Conversation
This is where Microsoft Fabric becomes important.
It would be easy to describe Fabric as simply another analytics product.
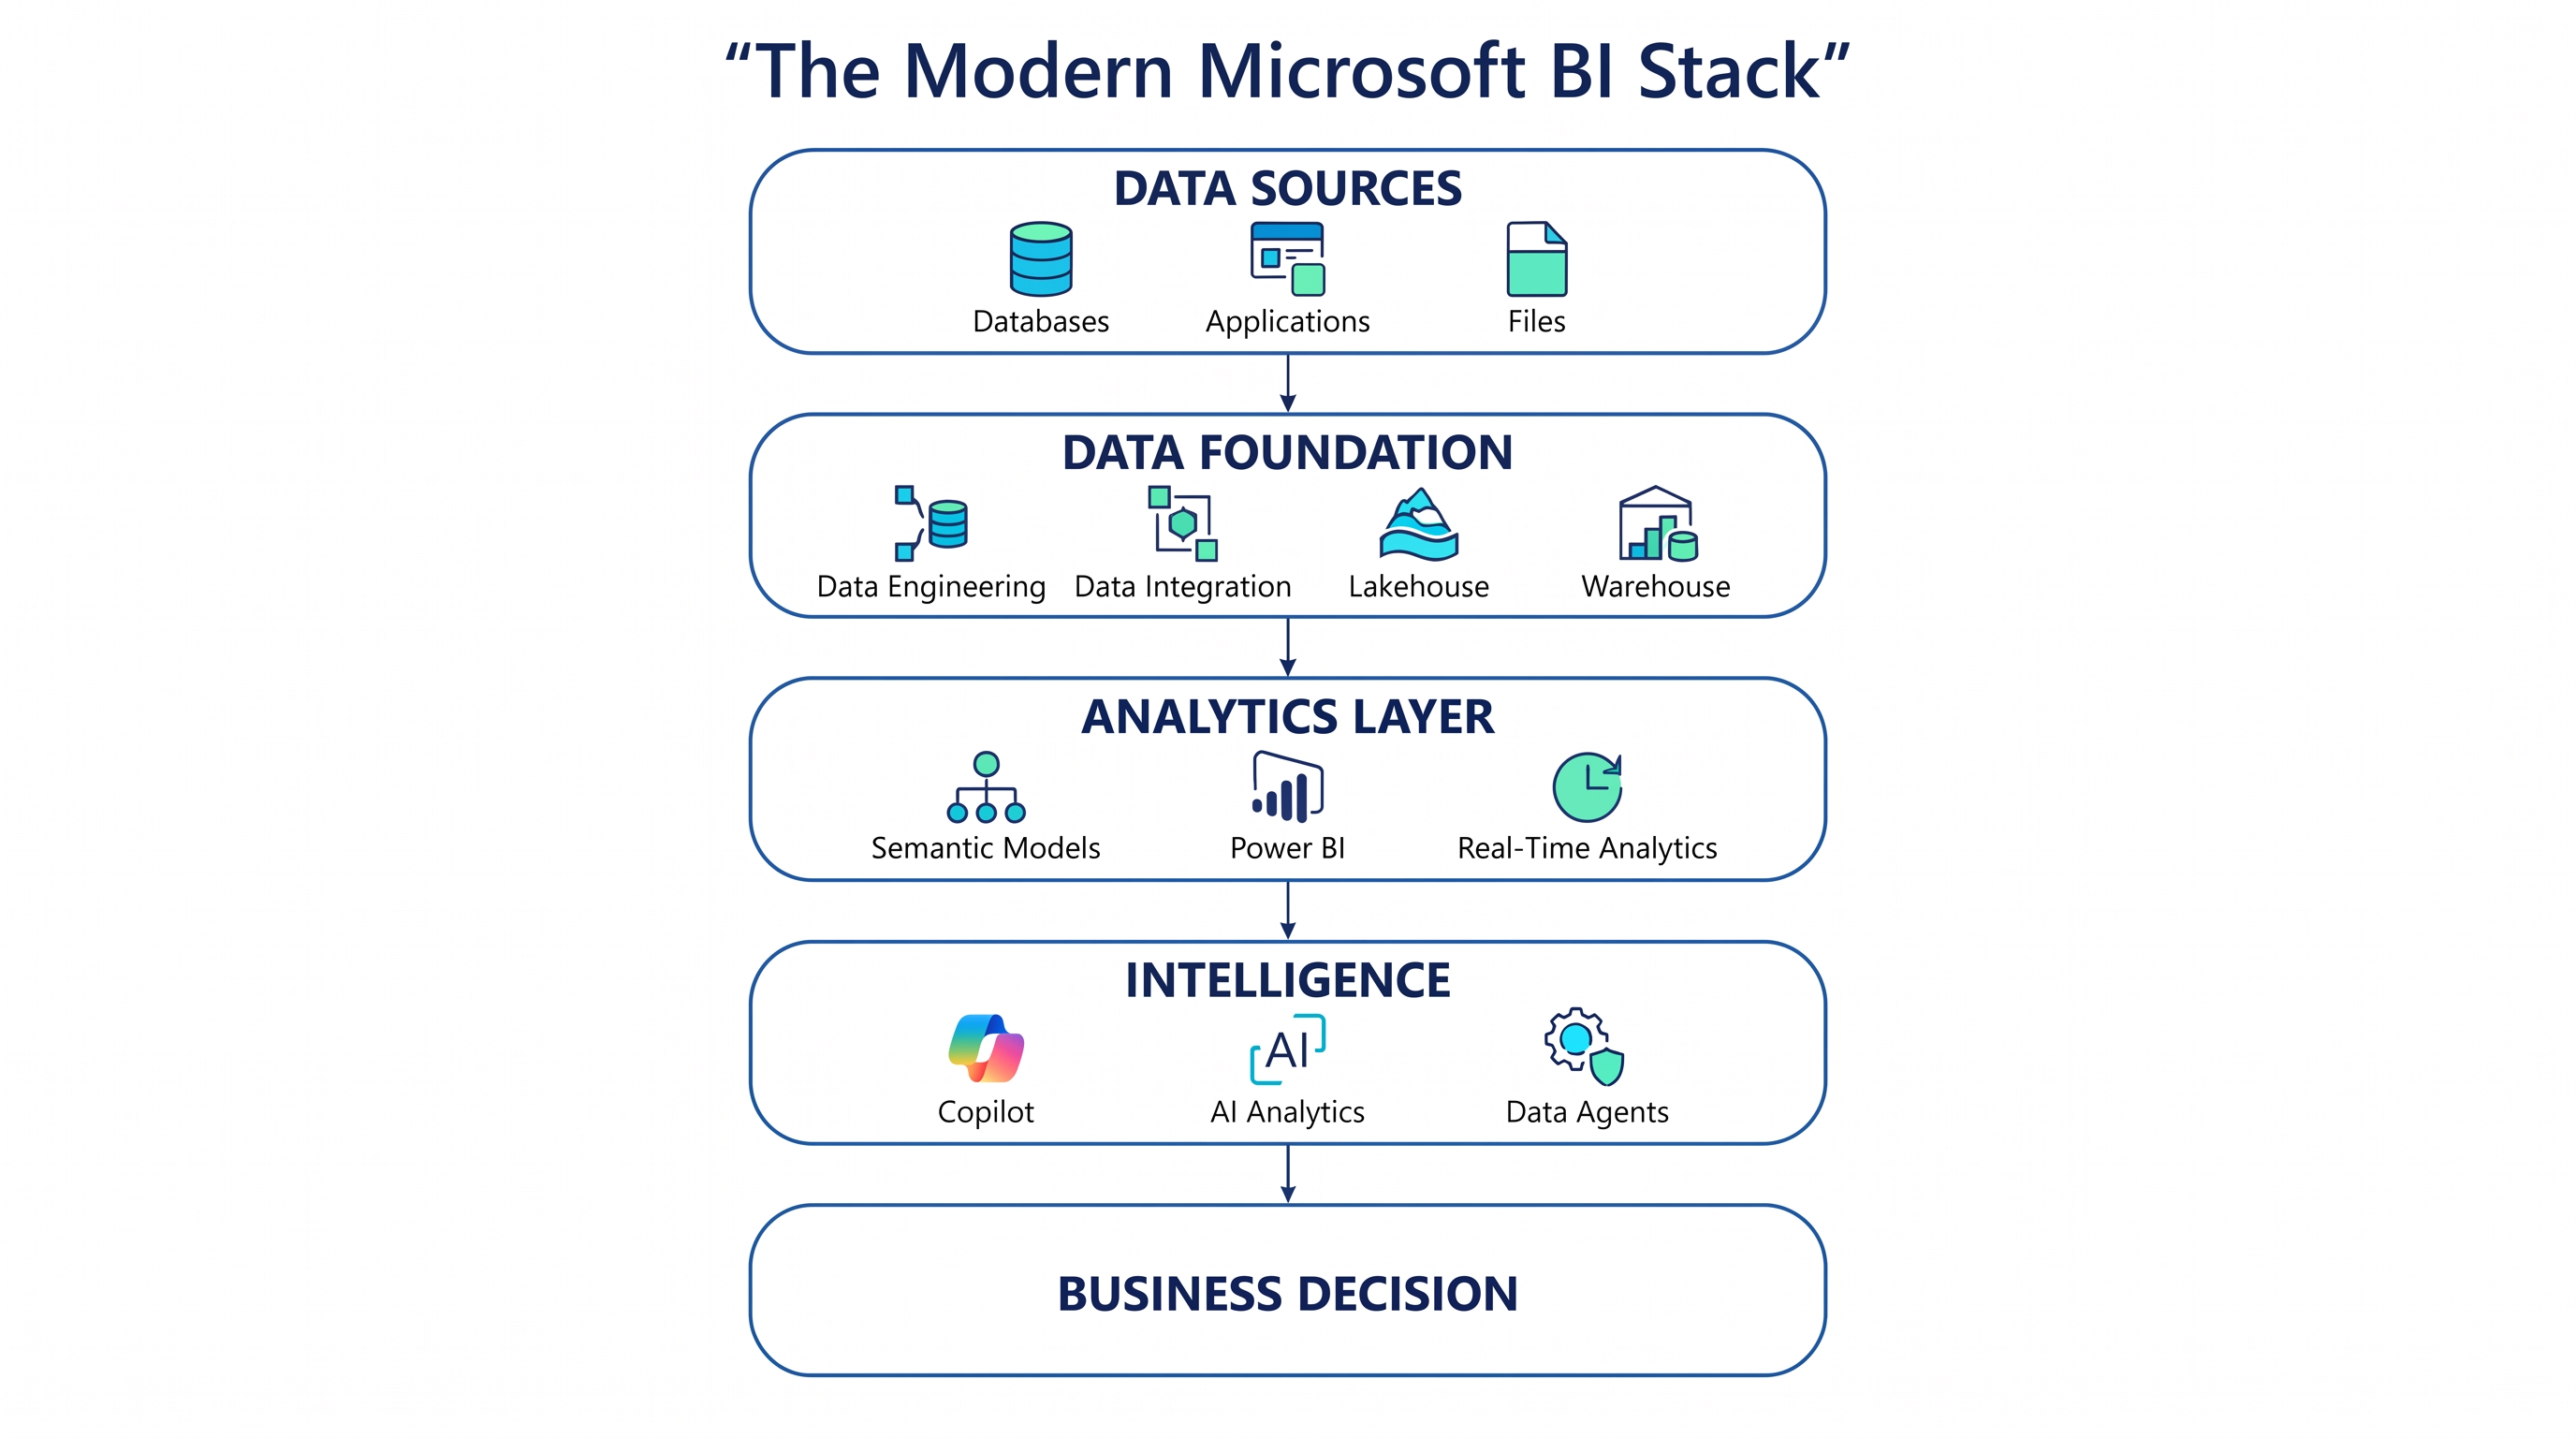
The bigger idea is that Fabric brings multiple parts of the data lifecycle into a unified environment.
Microsoft describes Fabric as a platform for data and analytics that brings together capabilities including
data engineering, data integration, data science, warehousing, real-time intelligence, and Power BI.
Why does that matter for AI?
Because AI is only useful when it can work with reliable, understandable data.
If information is scattered across disconnected systems, poorly documented tables,
inconsistent definitions, and isolated reports, adding an AI assistant
does not magically fix the underlying problem.
In fact, it can expose the problem.
A good AI answer needs a good data foundation. That makes the evolution from traditional BI to modern
analytics much bigger than simply adding a chatbot to Power BI.
The New BI Stack Is Bigger Than the Dashboard
Traditional BI conversations often focused on reporting.
Modern BI is becoming much broader.
A Microsoft data environment can involve:
Data integration
Data engineering
Lake houses
Data warehouses
Semantic models
Power BI
Real-time analytics
AI and machine learning
Data agents
Security
Governance
Automation
Microsoft Fabric is designed to connect many of these capabilities within one analytics platform.
That changes what a BI professional needs to understand.
Building a report is still valuable.
But understanding where the data comes from, how it is transformed, how business logic is defined,
How it is governed, and how AI can use that information is becoming equally important.
This is where traditional MSBI knowledge starts meeting the modern Microsoft data stack.
Where MSBI Still Fits
The rise of Fabric and AI does not make traditional Microsoft Business Intelligence knowledge irrelevant.
The fundamentals still matter.
SQL still matters.
Data transformation still matters.
Data modeling still matters.
Reporting still matters.
Understanding business requirements still matters.
In fact, these fundamentals become more important when AI enters the picture because someone has
to make sure the information being analyzed is meaningful and trustworthy.
For professionals building these foundations, an MSBI course can provide a structured introduction to
Microsoft's traditional Business Intelligence ecosystem while creating a base for moving
toward newer analytics technologies.
The important point is not to stop there.
Traditional BI should be viewed as a foundation rather than the final destination.
AI Does Not Make Data Modeling Less Important
There is a common assumption that AI will make traditional BI skills unnecessary.
If someone can type a question into an AI assistant, why would they need to understand
data models, relationships, measures, or business logic?
Because the question itself can be deceptively simple.
Consider:
What was our profit last year?
What exactly does “profit” mean?
Is it revenue minus product costs?
Are refunds included?
Are taxes included?
A human analyst understands that these questions matter.
AI cannot simply invent the organization's definition and be trusted.
That is why semantic models remain important.
Microsoft describes Power BI semantic models as the analytical foundation
behind reports, helping centralize business logic, calculations, and governance.
So AI may change how people ask questions, but it does not remove the need for well-structured data.
If anything, it raises the standard.
The Rise of the AI-Ready Data Model
This is one of the less obvious changes taking place in BI.
Traditionally, a semantic model existed mainly to support reporting and consistent business calculations.
Now there is another question:
Can AI understand it?
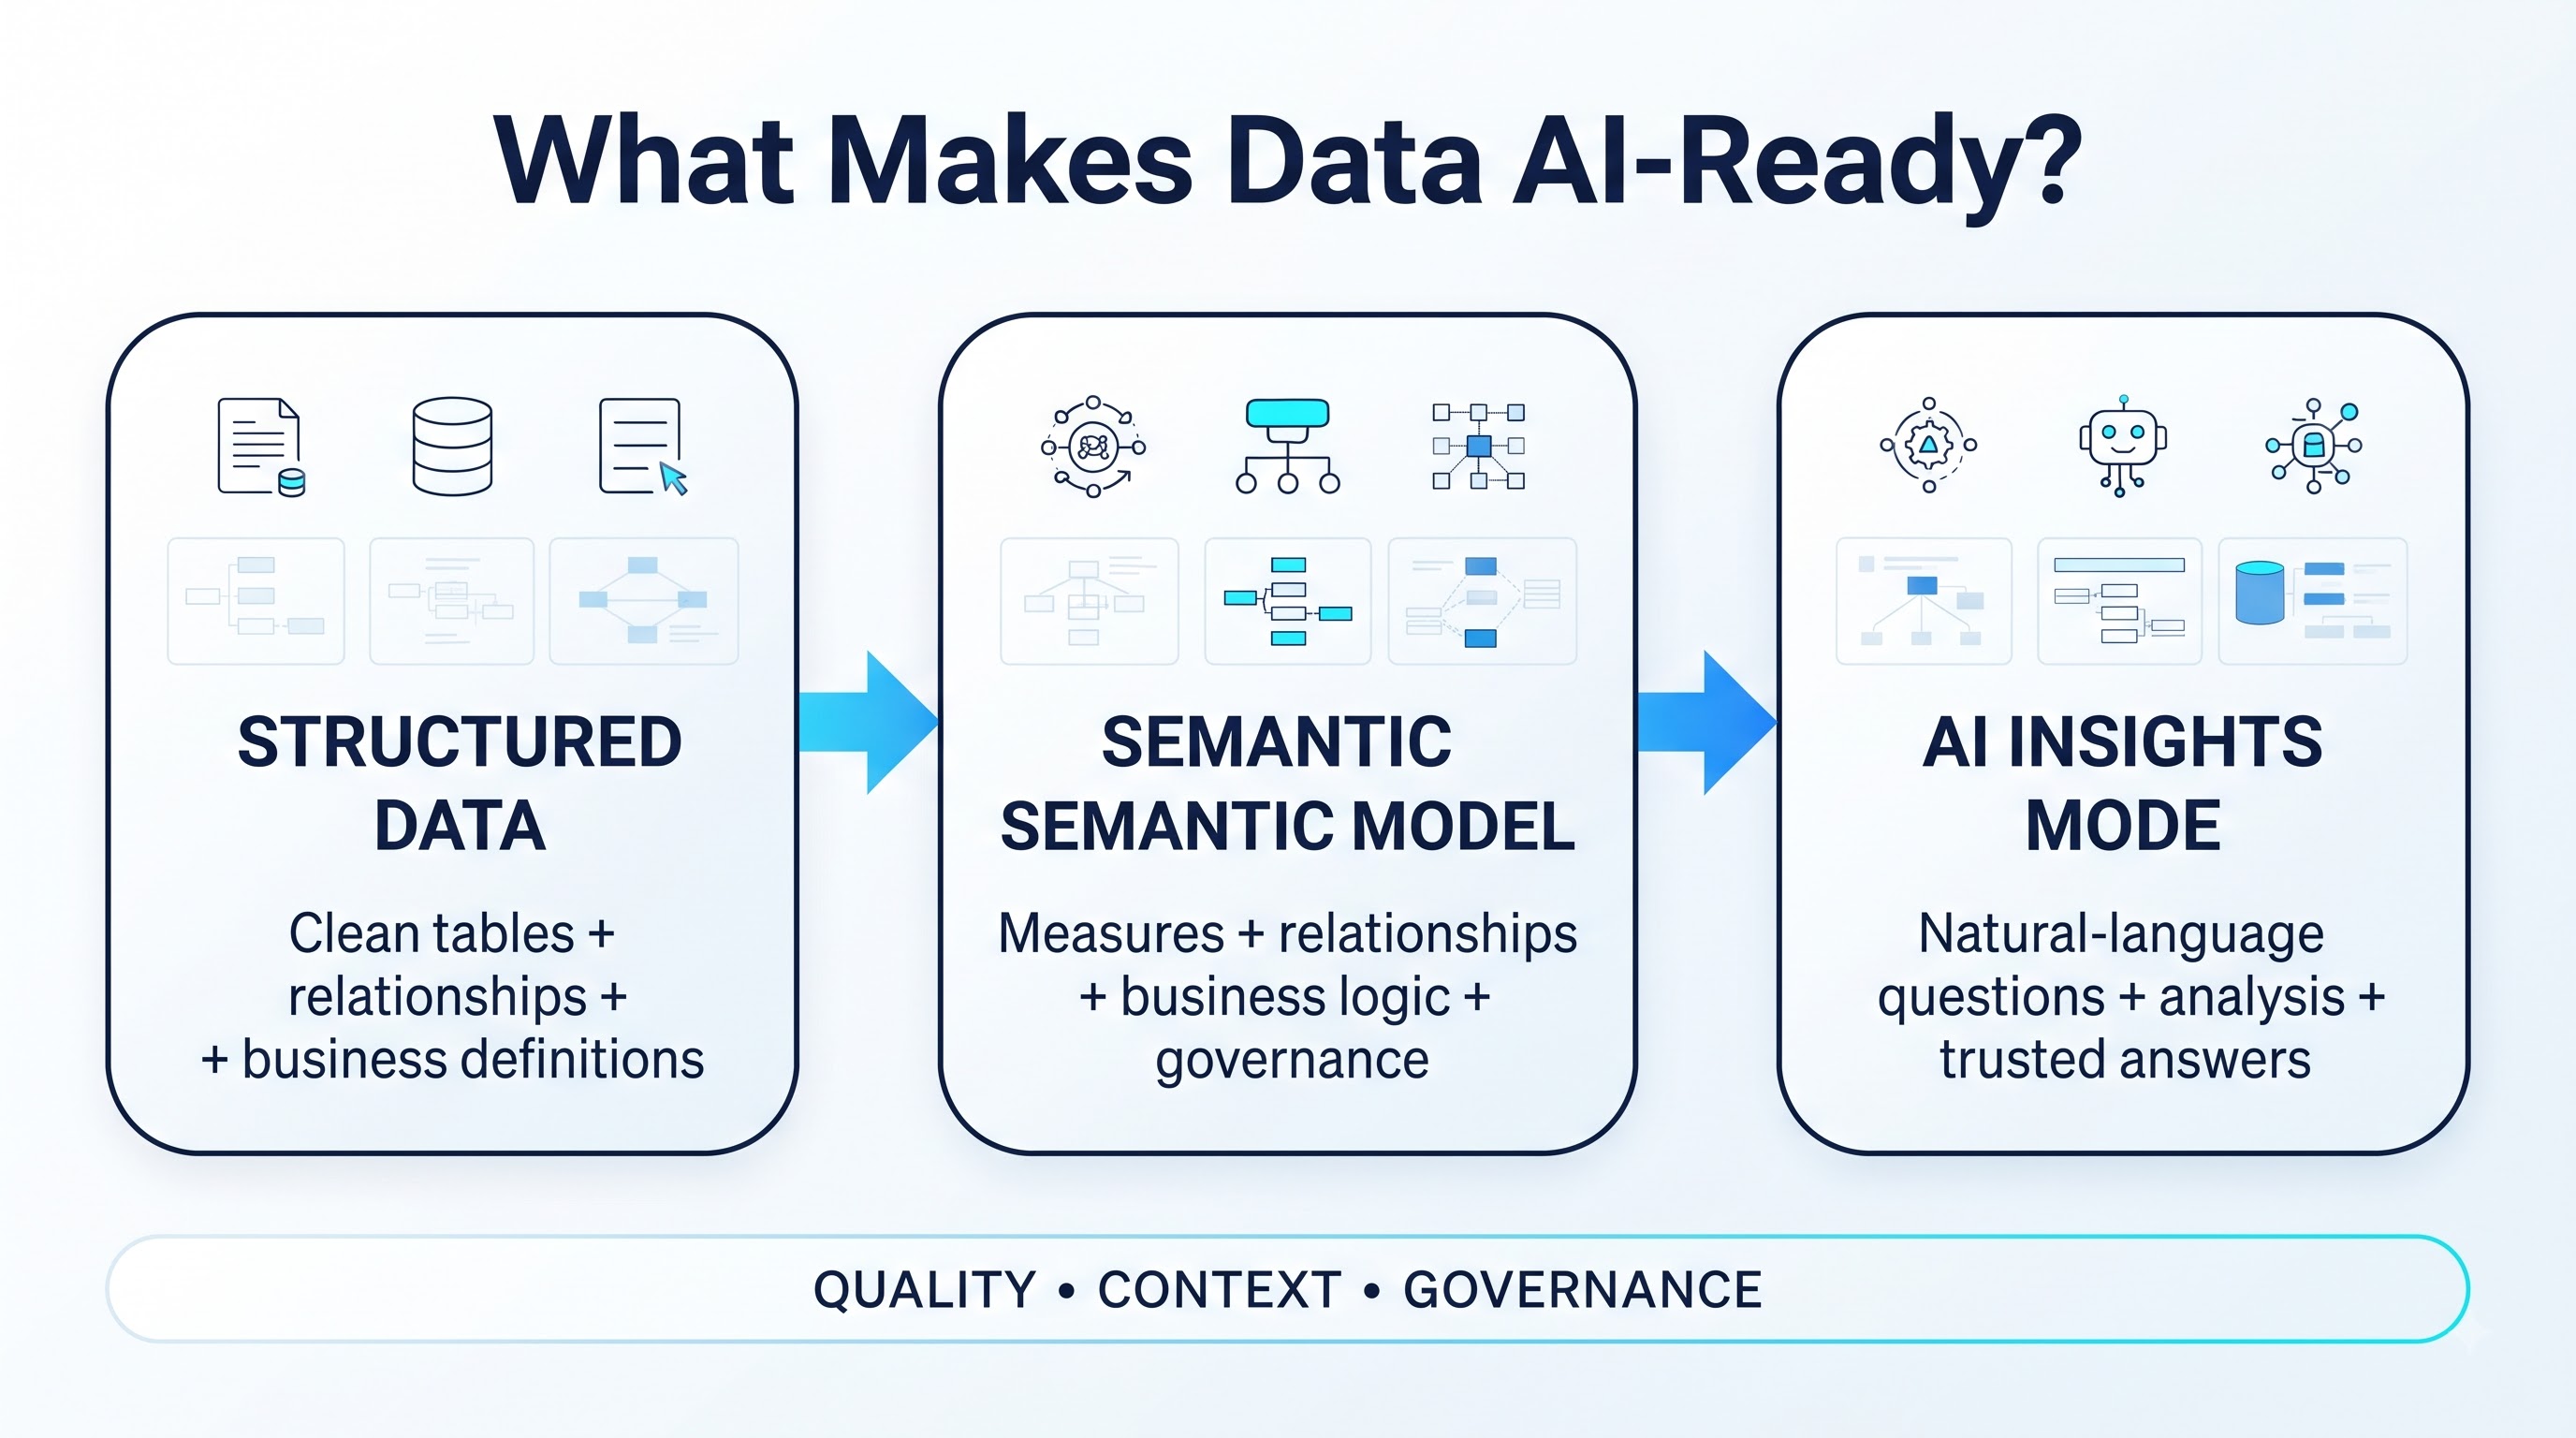
A useful AI experience requires meaningful field names, reliable measures, clear relationships,
business context, and appropriate governance.
Microsoft's current Fabric and Power BI guidance emphasizes preparing data and semantic
models so AI experiences can produce more relevant and reliable results. This creates a new
responsibility for BI teams. The work does not begin when the user opens the dashboard.
It begins much earlier.
The better the data foundation, the better the questions AI can help answer.
From Dashboards to Data Conversations
This is where the title “The Death of the Dashboard” becomes interesting.
Consider two experiences.
Microsoft Fabric Data Agents Take It Further
The shift becomes even more interesting with Fabric data agents.
Microsoft Fabric allows data agents to create conversational experiences over sources such as
lake houses, warehouses, Power BI semantic models, and KQL databases. Users can ask questions in
natural language without necessarily knowing SQL, DAX, or KQL.
Think about what that means for an employee who needs information but is not a data specialist.
Instead of asking:
“Which report contains our customer retention numbers?”
they could ask:
“How has customer retention changed over the last six months?”
The underlying technology may be complicated.
The user experience becomes simpler. And that is often what successful technology does:
More complexity underneath. Less friction on top.
What Happens to BI Professionals?
This is probably the question many people care about most.
If AI can create summaries, suggest visuals, generate DAX, and answer
questions about data, does that make BI professionals less important?
Not necessarily.
It changes where their value comes from.
A BI professional who spends most of the day producing repetitive
reports may see parts of that work automated. But businesses will
still need people who understand:
Data modeling
Business requirements
Data quality
DAX
SQL
Governance
Security
Performance
AI-generated insights
Report design
The difference is that professionals can potentially spend less time producing repetitive outputs
and more time solving meaningful business problems.
That is a positive shift.
Why MSBI Training Is Also Changing
The traditional learning path for Microsoft BI often focused heavily on SQL Server, SSIS, SSAS, SSRS,
and reporting. Those skills still provide useful foundations. But the modern Microsoft ecosystem has expanded.
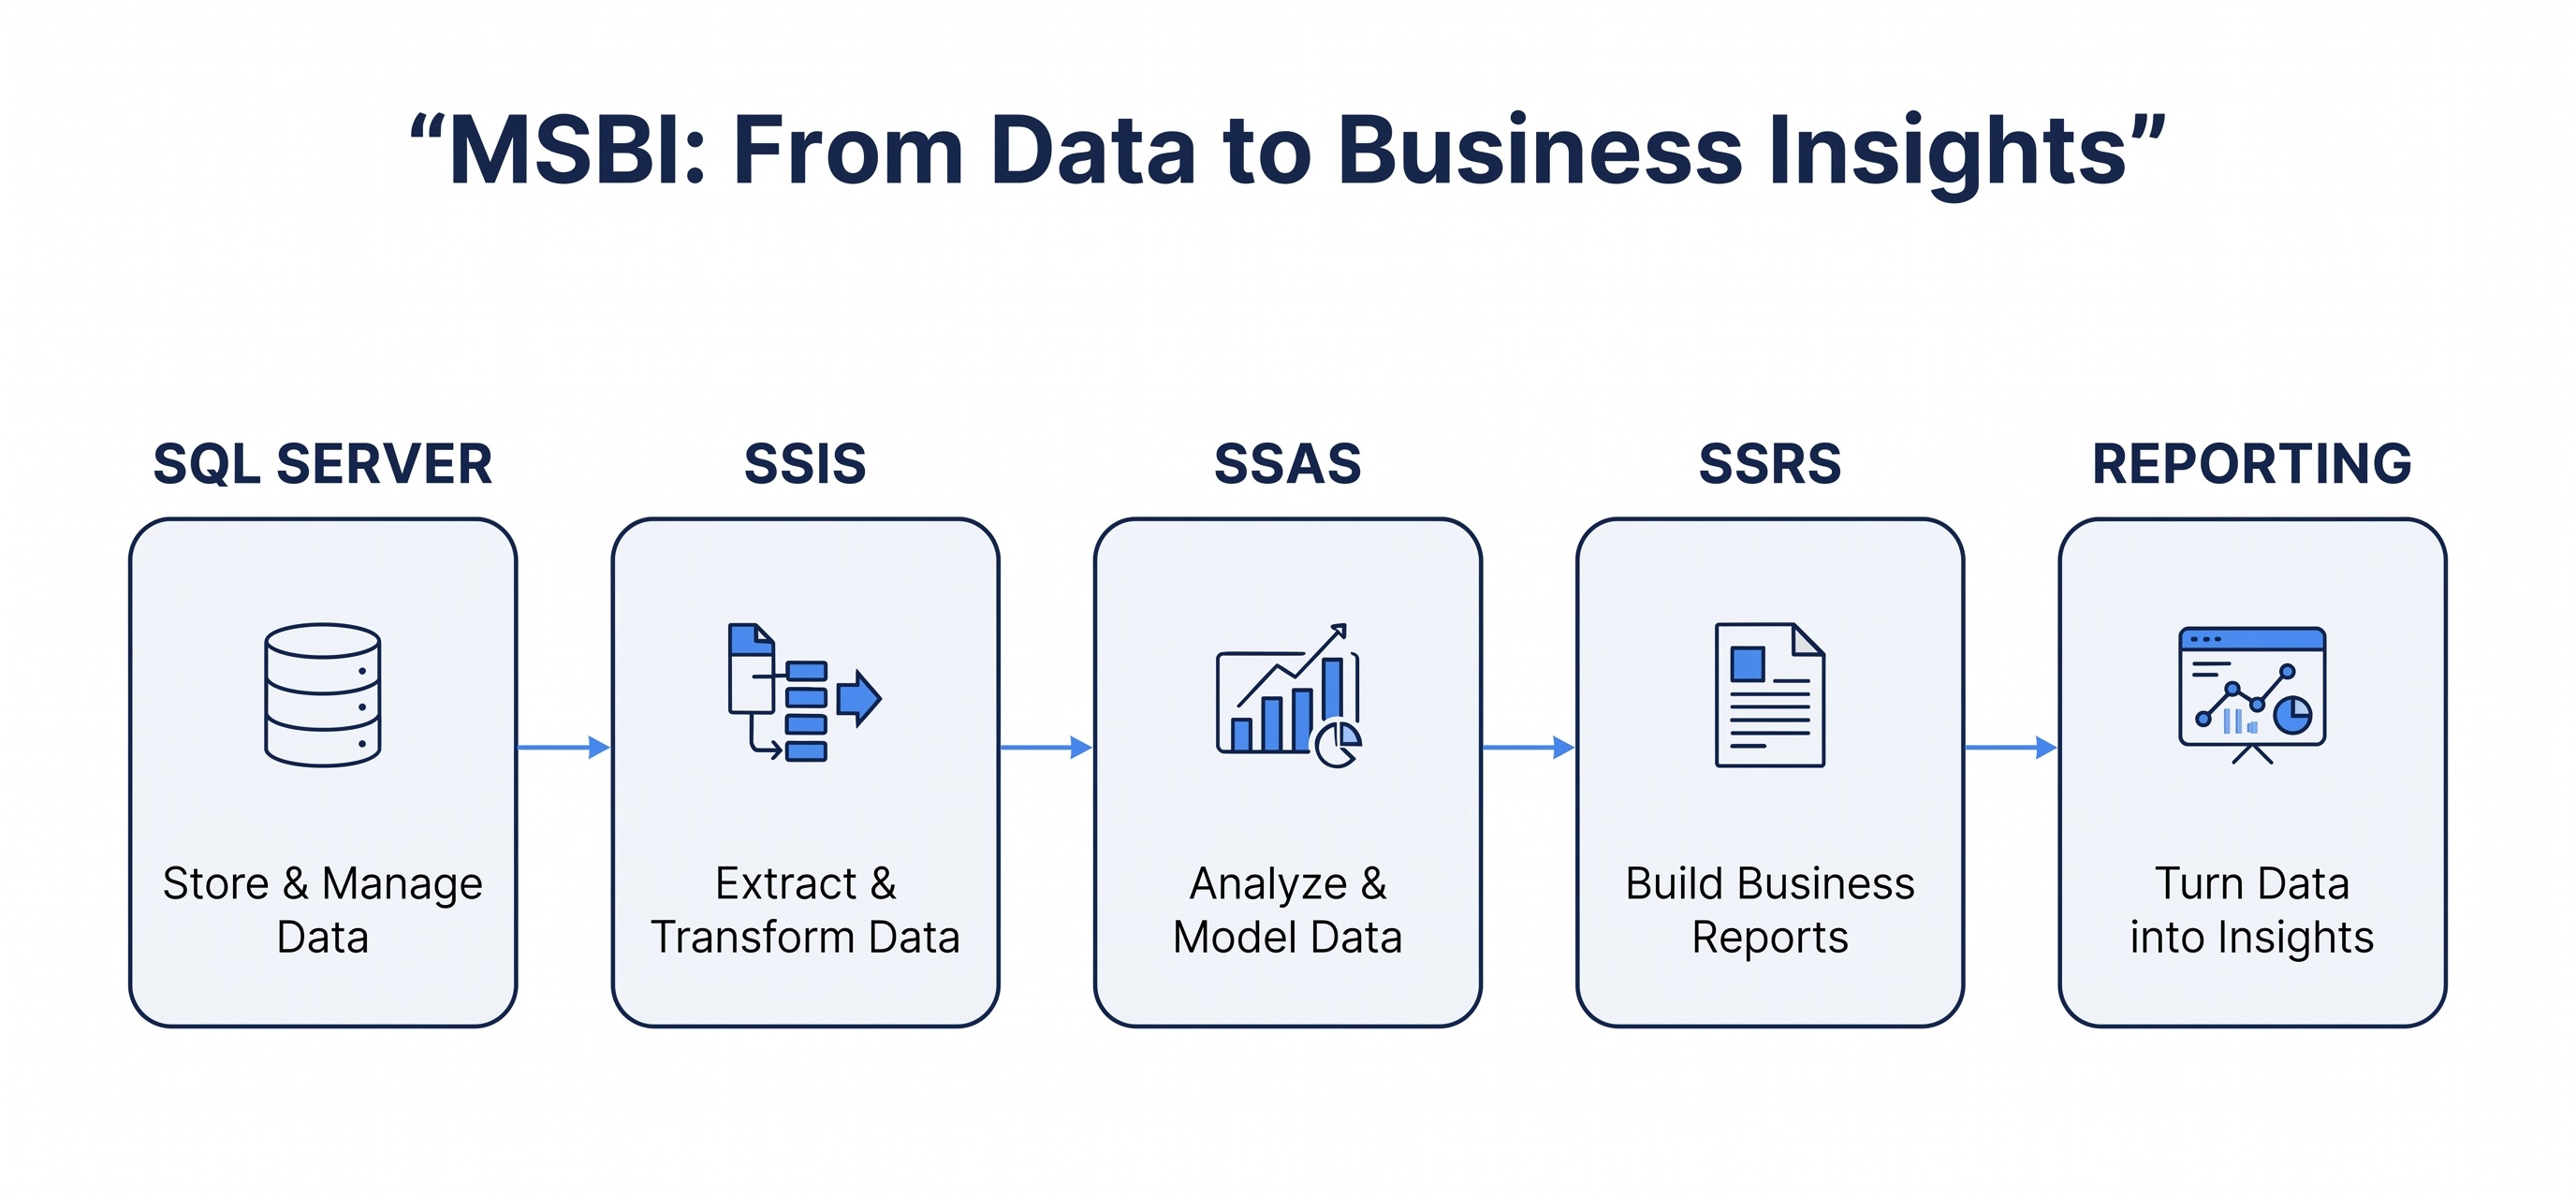
A professional entering the field today may eventually work with Power BI, Azure services, Microsoft Fabric,
semantic models, AI-assisted analytics, and data engineering workflows.
That is why MSBI training should not be viewed only as learning a collection
of older Microsoft BI tools. A stronger learning approach connects traditional BI
concepts with the technologies that are shaping modern analytics.
The fundamentals still matter.
The direction in which those fundamentals are applied is changing.
Power BI Is Not Going Away
If the dashboard is supposedly dying, what happens to Power BI?
The answer is simple:
Power BI is evolving with it.
Power BI remains a core component of Microsoft Fabric and continues to provide reporting,
visualization, semantic modeling, and analytics capabilities.
The difference is that Power BI is no longer just about creating dashboards; it is increasingly
becoming a place where people can interact with governed business data using both traditional
visual analytics and AI-assisted experiences.
That combination is important.
Some questions are easier to answer with a chart.
Some are easier to answer with a conversation. The future of BI will likely use both.
The Business Value of Microsoft Fabric
For organizations, the appeal of Fabric is not simply that it contains many tools.
The larger value is the possibility of creating a more connected data environment.
Instead of moving constantly between separate systems, teams can work across data engineering,
analytics, data science, real-time intelligence, and Power BI within the same broader platform.
That can simplify the path from:
Raw data → prepared data → modeled data → analysis → insight → decision.
AI can increasingly participate across that journey. For someone building their skills,
MSBI online training can therefore be useful when it provides more than traditional reporting concepts
and helps connect BI fundamentals with the broader Microsoft data ecosystem.
That connection is becoming increasingly important as organizations move toward cloud-based
analytics and AI-assisted decision-making.
The Biggest Risk: AI Can Make Bad BI Faster
There is a less exciting side to the AI story. AI does not automatically make business intelligence accurate.
If the underlying data is incomplete, poorly modeled, or based on inconsistent business definitions,
AI can produce answers that sound convincing but are still wrong.
That creates a serious responsibility for organizations. The faster people can access information,
the more important it becomes to know whether that information can be trusted.
This is why governance, security, lineage, permissions, and semantic modeling remain essential.
AI should reduce the effort required to understand data. It should not remove human judgment.
Real-Time Intelligence Changes the Game
Another important shift is the move from asking:
“What happened?”
to asking:
“What is happening right now?”
Traditional reporting often focuses on historical information.
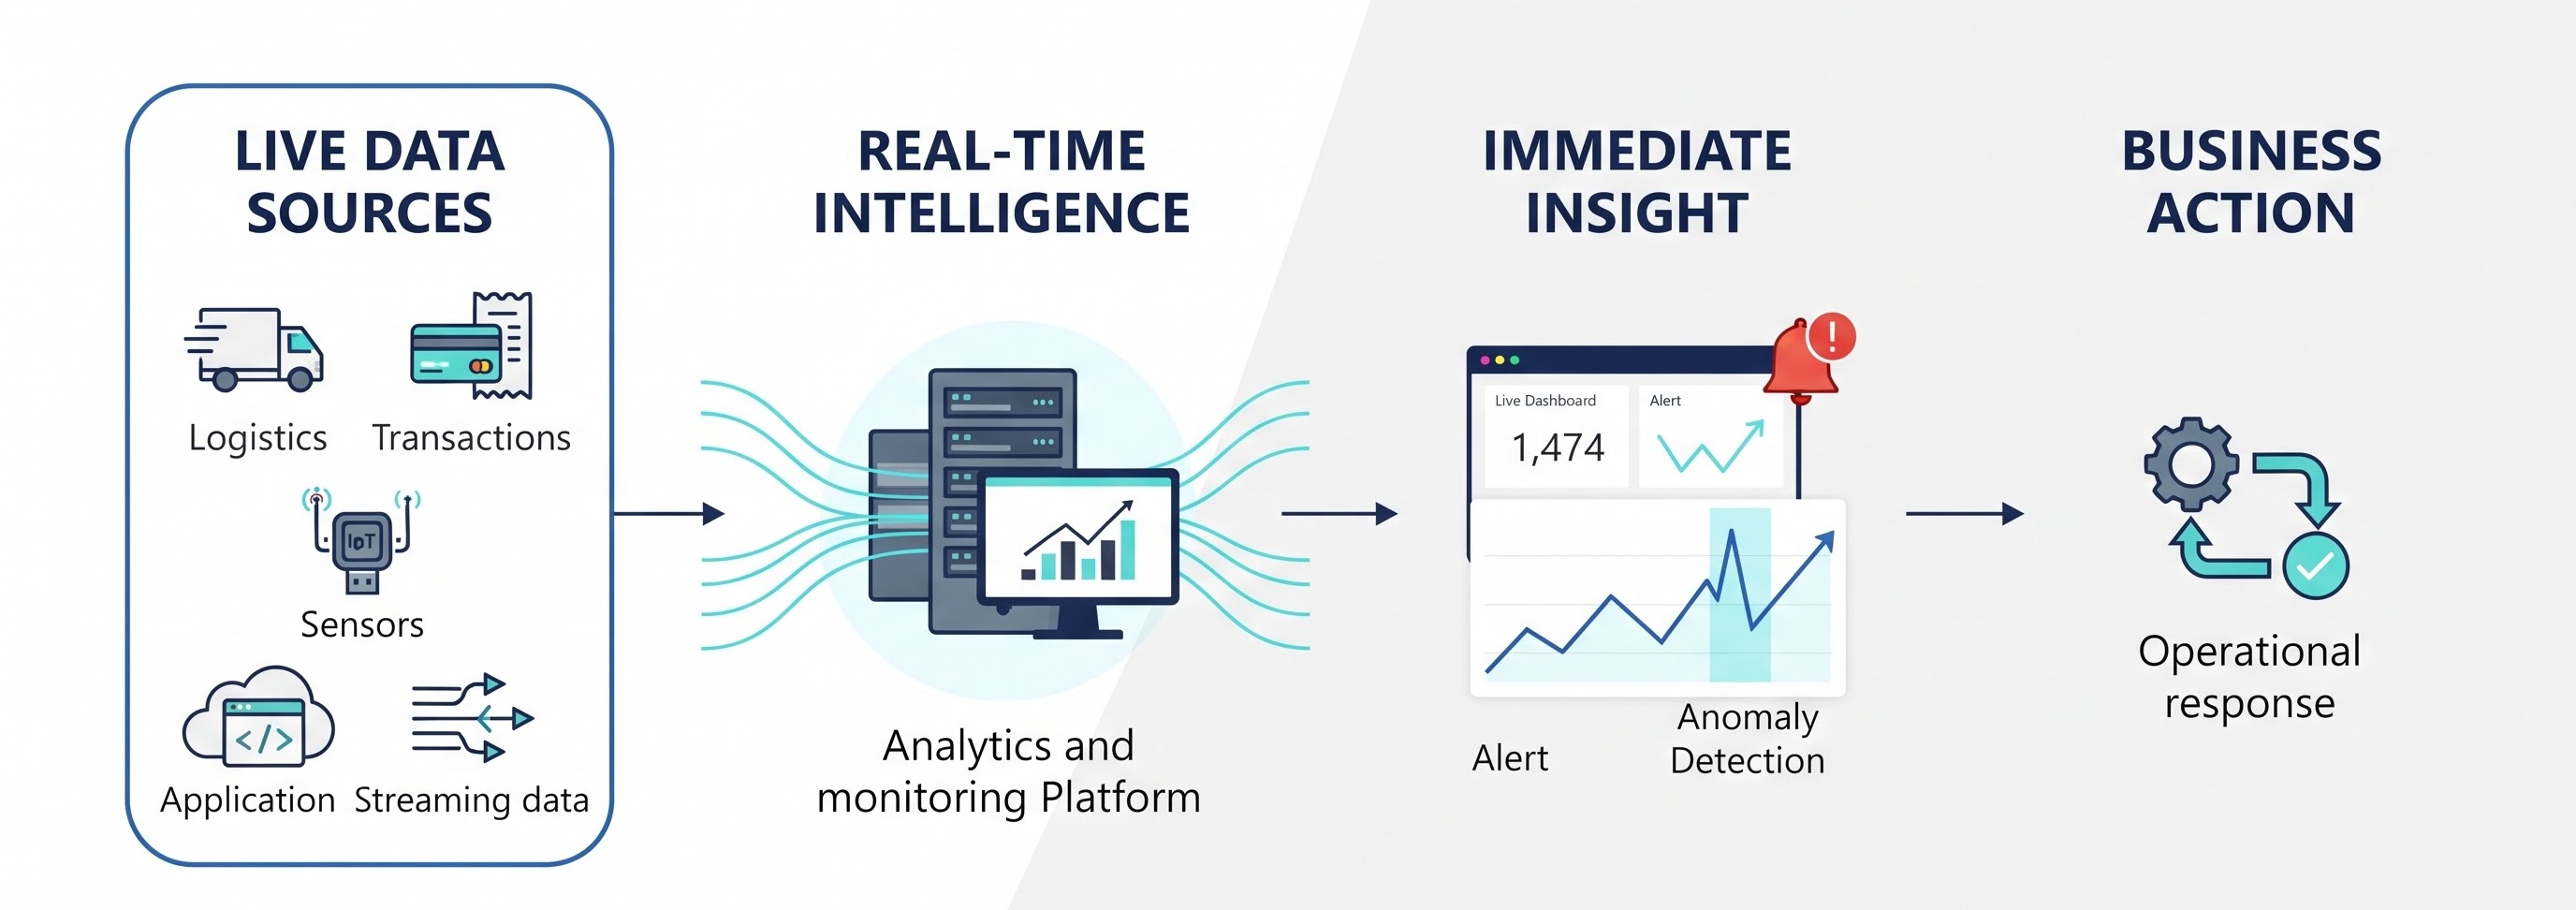
Modern analytics increasingly needs to respond to live or near-real-time events.
Microsoft Fabric includes Real-Time Intelligence alongside Power BI and other
analytics workloads, supporting scenarios where organizations need to monitor
and respond to streaming information.
Think about logistics.
A report showing yesterday's delivery performance is useful. But if an organization can identify a disruption
while it is happening and investigate the cause immediately, the value is much greater.
That moves BI closer to operational decision-making. The dashboard becomes less of a
static destination and more of a live window into the business.
What Should BI Professionals Learn Next?
The answer depends on where someone is starting.
A person with strong SQL knowledge may move toward Power BI and semantic modeling.
A Power BI developer may expand into Fabric.
A traditional BI professional may add cloud data engineering and AI-assisted analytics. A data engineer may
explore semantic models, Power BI, and conversational data experiences.
The important thing is not to learn every new technology at once. Build a connected skill set.
A practical progression could look like:
SQL → Data Modeling → Power BI → DAX → Microsoft Fabric → Data Engineering → AI-Assisted Analytics → Data Agents
This is where the future becomes interesting.
The most valuable professionals may not be those who know only AI.
They may be the people who understand data + business + AI together.
What the Future of Microsoft BI Could Look Like
The next generation of BI probably will not look like every employee abandoning dashboards and talking
to an AI assistant all day. Businesses are more complicated than that. Executives will still want performance
dashboards. Finance teams will still need standardized reports.
Operations teams will still monitor KPIs.
Analysts will still build models.
But the way people move between these experiences is likely to change.
A user might start with a dashboard.
Ask Copilot a question.
Explore a semantic model.
Use a data agent to investigate another source.
Check a real-time signal, Then return to a governed report before making a decision.
That is a much richer BI experience than simply opening a dashboard every morning.
Is the Dashboard Really Dead?
No.
And that is probably the most important conclusion.
The dashboard is not dead. The dashboard-only era is changing.
For years, the model was:
Data → Report → Dashboard → Human interpretation
The emerging model looks more like:
Data → Fabric → Semantic Model → Dashboard + AI → Conversation → Decision
Microsoft Fabric provides the broader data and analytics foundation, while Power BI continues
to provide visualization and reporting. AI capabilities such as Copilot and Fabric data agents
add new ways for people to interact with organizational data.
The dashboard still has a job.
It just no longer has to do the entire job.
AI is helping us understand why—and what to do next.
A dashboard can tell you:
“Sales are down.”
AI can help you ask:
“Why are sales down?”
Then:
“Which customers are affected?”
And ultimately:
“What should we investigate next?”
That does not make BI professionals less important. If anything, it raises the
value of the work behind the insight. Reliable answers still depend on quality data, sound modeling,
business context, and strong governance.
So perhaps “The Death of the Dashboard” is not really about dashboards disappearing.
It is about what comes after them.
The dashboard is no longer the destination. It is becoming the starting point for a conversation with data.
And that may be the real transformation taking place in Microsoft Business Intelligence: moving from simply
seeing what happened to understanding why it happened—and deciding what to do next.