
The Evolution and Strategic Impact of Microsoft Power BI
Last updated on Aug 20, 2026

Data drives the modern business. There is no digital interaction made, action taken in the supply chain, purchase made by a client, or internal task performed that does not leave behind important information. Yet, collecting raw data is not the same as knowing how to interpret it. For decades, companies have been trapped in data silos, poor reporting systems, and a high dependence on engineering teams that produce easily generated operational reports. The bottleneck resulted in delays of critical decisions and using outdated knowledge rather than timely data for making these decisions.
Microsoft Power BI was designed to mitigate this operational friction. With the goal of bridging the gap between data management and business needs, the platform grew from a simple reporting tool to a full-fledged business intelligence platform.
The platform democratizes access to business intelligence, which allows employees of the organization, from point-of-entry supervisors tracking daily data to executives assessing international performance, to approach information directly. The platform’s friendly interface transforms complex and inconsistent data into simple images that make it easy to look into the trends and investigate their causes.
Finally, Power BI helps corporate businesses’ cultures to move from passive storage of data to proactively solving challenges. With the possibilities Power BI gives to teams to explore data on their own and disclose trends in business processes, organizations can react to market changes faster, improve daily operations, and make sensible strategic decisions.
In order to close the scientific gap and gain expertise in the use of contemporary analytics, future data specialists should look to join an organized online power bi training in order to gain valuable experience in the platform. OnlineITGuru offers best online power bi course studies which teach a range of practical skills that can be used in any company, from learning how to clean data to making and running dashboards.
The concepts of Power BI started in Microsoft Excel
Back in the late 2000s and early 2010s, Microsoft launched several new analytics extensions for Excel such as Power Query for data transformation, Power Pivot for quick data modeling, and Power View for visual data representation. Although these tools were quite powerful, sharing insights within an organization was limited due to the nature of sending huge files.
Knowing that a centralized cloud-based platform is needed, Microsoft combined these various engines into one solution and released Power BI officially in 2015.
The architecture was purposely constructed to bring about three separate phases of data analytics:
Data Ingestion and Transformation: Offering a non-technical peer with an easy interface for connecting with many sources, cleaning messy data, and automating extraction-transformation-loading processes.
Semantic Modeling: Promoting robust data architectures, multi-table relationships, and complex business calculations taking advantage of the speed of in-memory database engines.
Interactive Data Visualization: Providing interactive dashboards and reports where users can drill into statistics, filter across instances, and grasp the causes behind business phenomena.
Core Architecture and Product Ecosystem
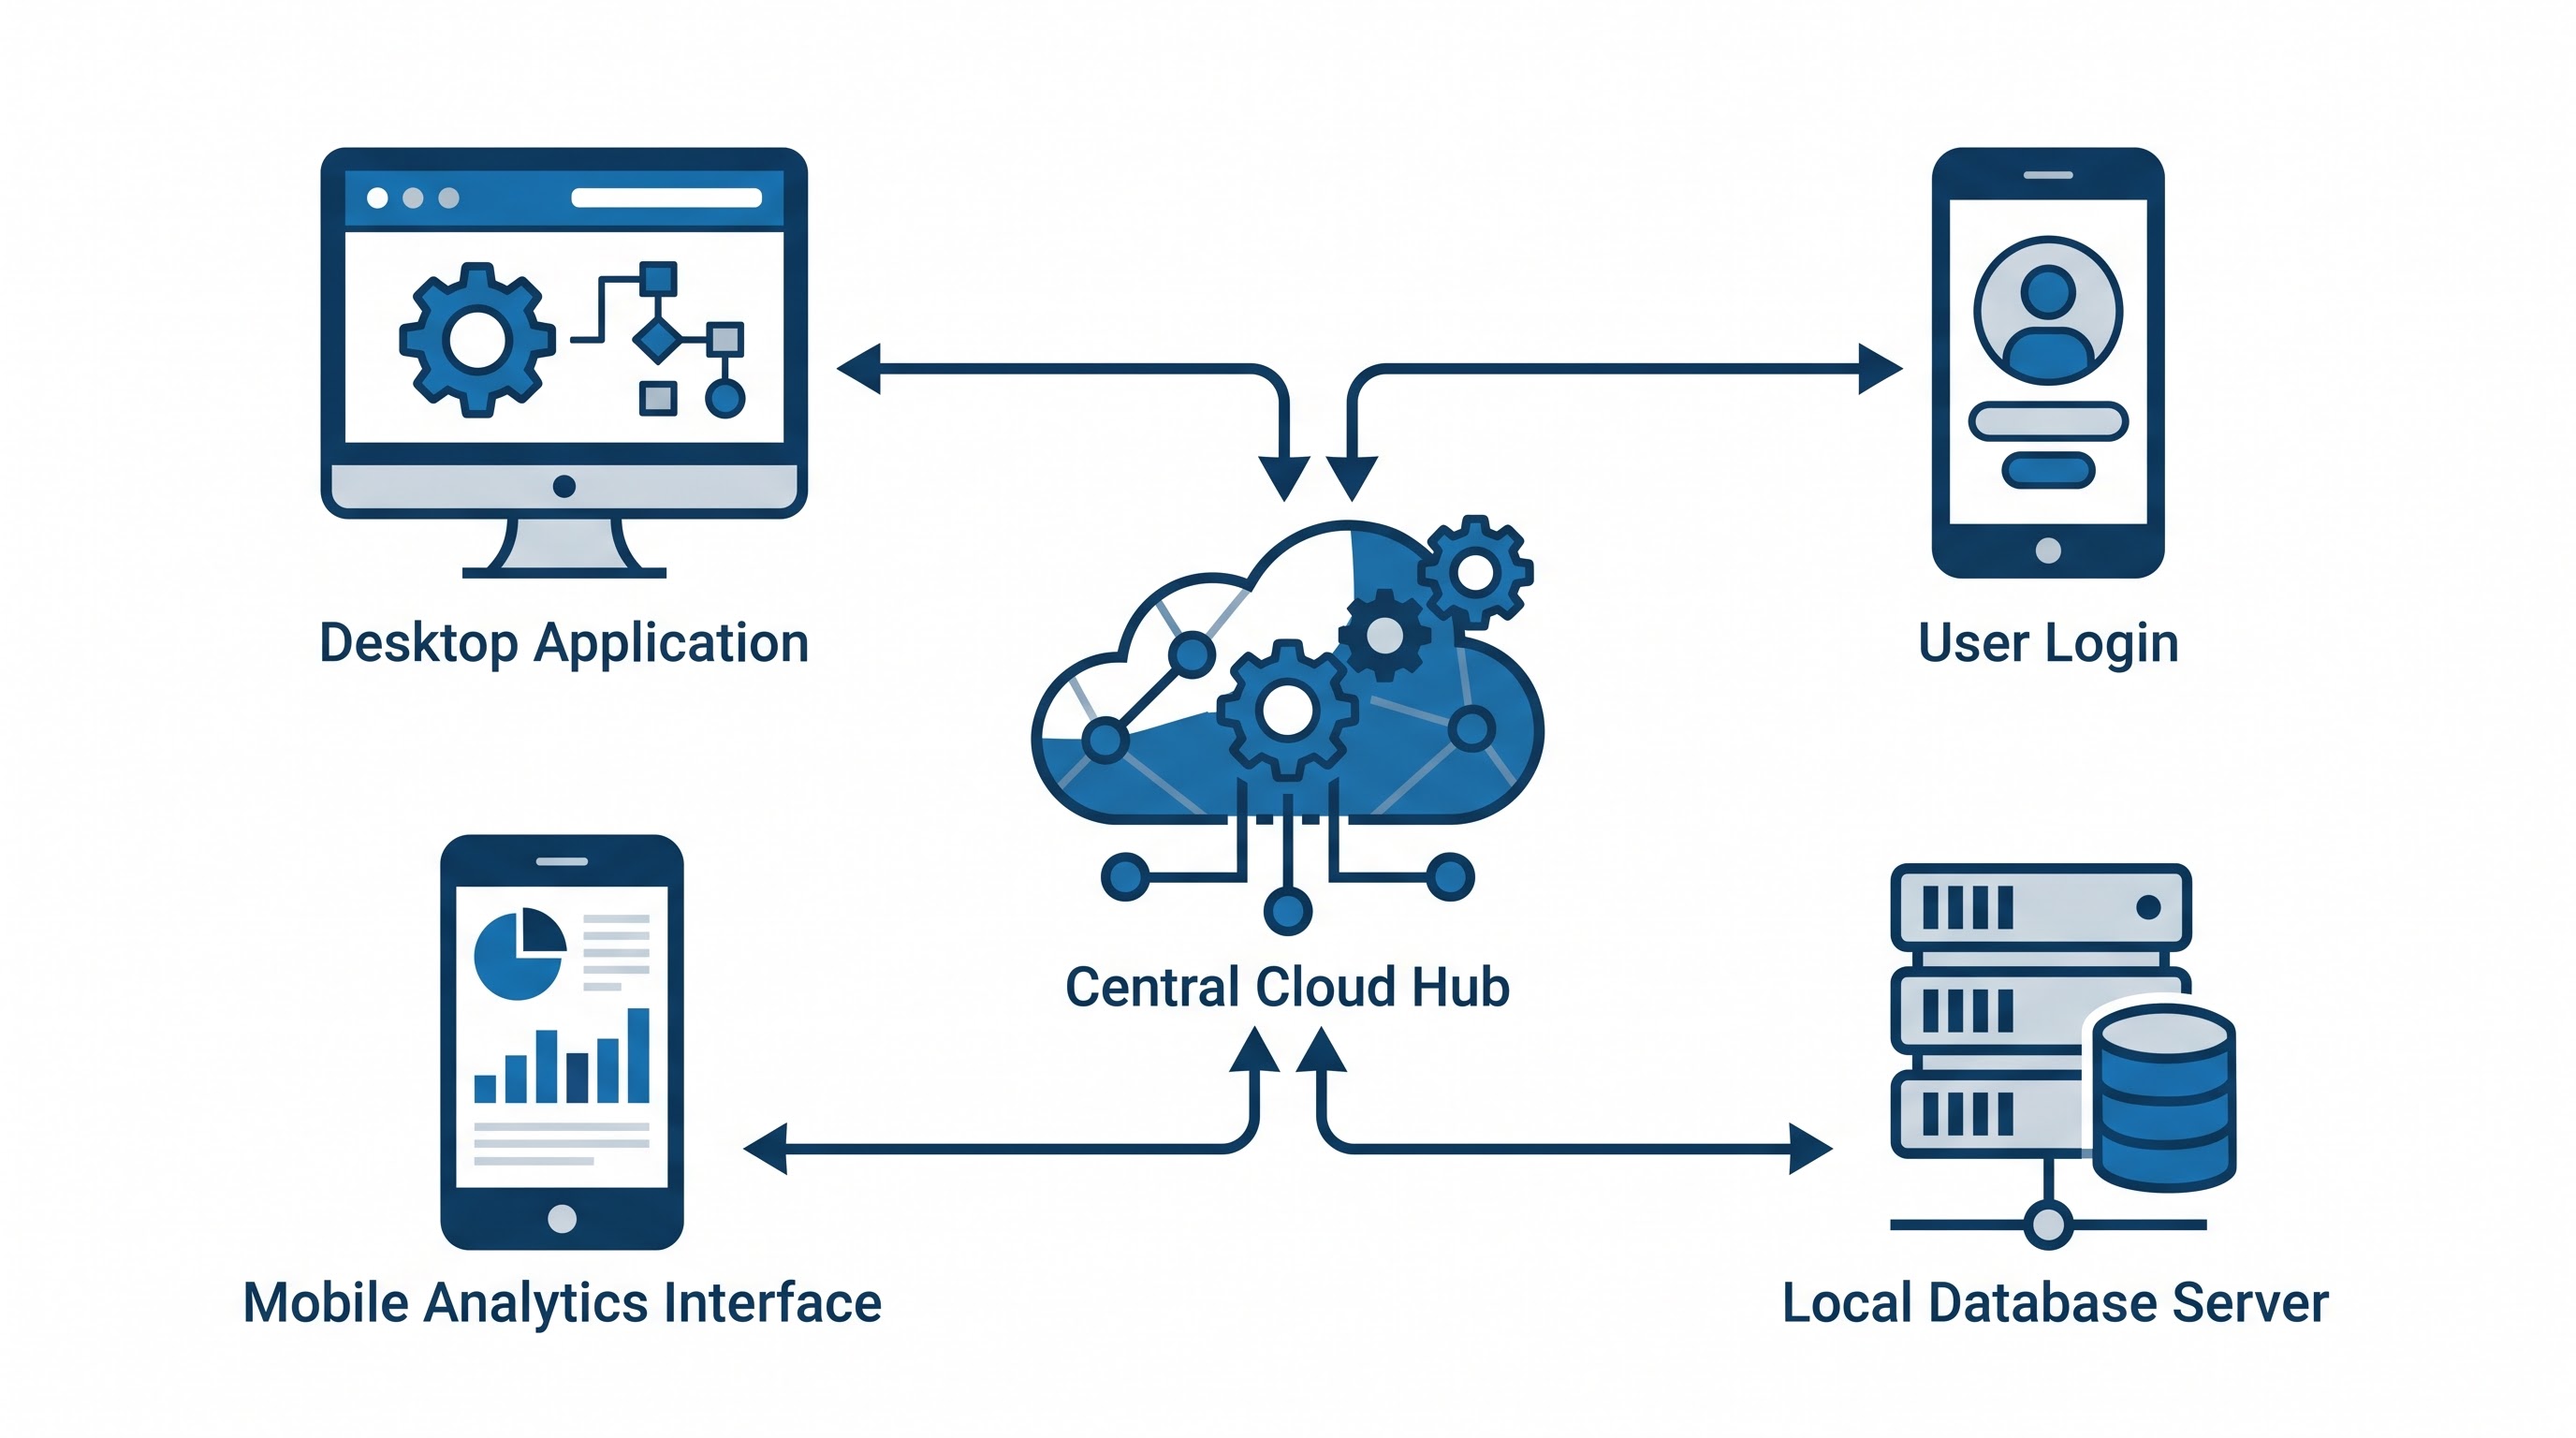
Power BI is not just a program, but rather it is a connected ecosystem of desktop applications, cloud services, and mobile tools facilitating different stages of report writing, collaboration, and governance.
Power BI Desktop
The purpose of Power BI Desktop is to provide a platform for an authoring tool. It can be present on a computer and perform complete control of data loading and data modeling. Users spend a lot of their day working in Power BI Desktop, creating connections and designing reports.
Since becoming proficient in Data Analysis Expressions (DAX) and relationship design requires a lot of practice, many analysts pursue power bi classes online at platforms such as Online IT Guru to learn row and filter contexts in real-life business scenarios.
Power BI Service
Power BI Service is a cloud-based solution as a service that is used to make reports accessible. After creating a report in Power BI Desktop, the user publishes it to the Service, where it is accessed by business users through a web browser. In Power BI Service, users can create and manage dashboards, set up data refresh automation, and work in shared teams via spaces created in the service.
Power BI Mobile
Modern decision-makers need the tools that the updated digital world can provide. Therefore, Microsoft offers native applications for mobile devices. Power BI Mobile is an application that allows seeing the interactive dashboards, as well as to get notifications based on the established rules.
Power BI Reporting Server
For businesses regulated by stringent legal guidelines, information sovereignty regulations, or separate networks, Power BI Report Server is offered by the vendor. The solution enables corporations to create reports using Power BI Desktop and publish them on intranet using the local server infrastructure, without transmitting company information over the cloud.
Power BI Embedded
Independent software developers, as well as customers who require the addition of reporting features into their unique systems, are able to use the embedded version of Power BI that can actually provide reporting capabilities whenever and wherever they need them. Instead of purchasing access rights for cloud service for each user or client, the organization has the ability to provide users with reporting features without buying access using provided APIs.
Real In-Depth Analysis of Computational and Data Modeling Engine
For understanding how Power BI operates smoothly and efficiently from single-table spreadsheets to rich data warehouses, its computational engines should be analyzed in detail.
Powered by the Query Engine
Functional data transformation allows the data transformation layer to operate via its embedded engine. The engine does not simply translate a user action such as deleting rows or replacing errors into data processing steps itself. Rather, it enables logical processing of data queries, connecting the data source through query folding—connecting to the source database and creating a database query for the UI query before the data transmission, thus reducing computational loading.
The VertiPaq Analytical Engine
The modeling level relies on VertiPaq data processing technology (an in-memory columnar database). Unlike classic relational databases that store data in rows enabling quick processing of transactions but slow processing of analytical aggregations, VertiPaq processes data column by column using unique compression techniques:
ValueEncoding: Compression algorithm that relies on calculating the difference of each value from the minimum value of the column.
Dictionary Encoding: Compression algorithm that substitutes recurring values with the lightweight keys.
Run-Length Encoding: Compression algorithm that saves ordered dataset, using repeated occurrences of each value.
The engine can maintain a vast array of records in its quick memory by compressing data into tiny portions of its original disk volume and instantaneously accessing them for analysis.
Calculation Dynamics: Row Context and Filter Context
The functional expression language (DAX) is based on two main rules of evaluation: row context and filter context. The difference between the two has to be well understood to write correct calculation formulas.
Row context involves an evaluation of values from a row to row in a process of calculation. For instance, in the column of the order table, quantity must be multiplied by unit price in every single line.
Filter context stands for the active filtering conditions in the process of coming up with specific visual data. Each operation done by a slicer, all highlighted areas in a bar chart, and each row heading in a matrix give rise to a filter context.
The Complete Analytical Process
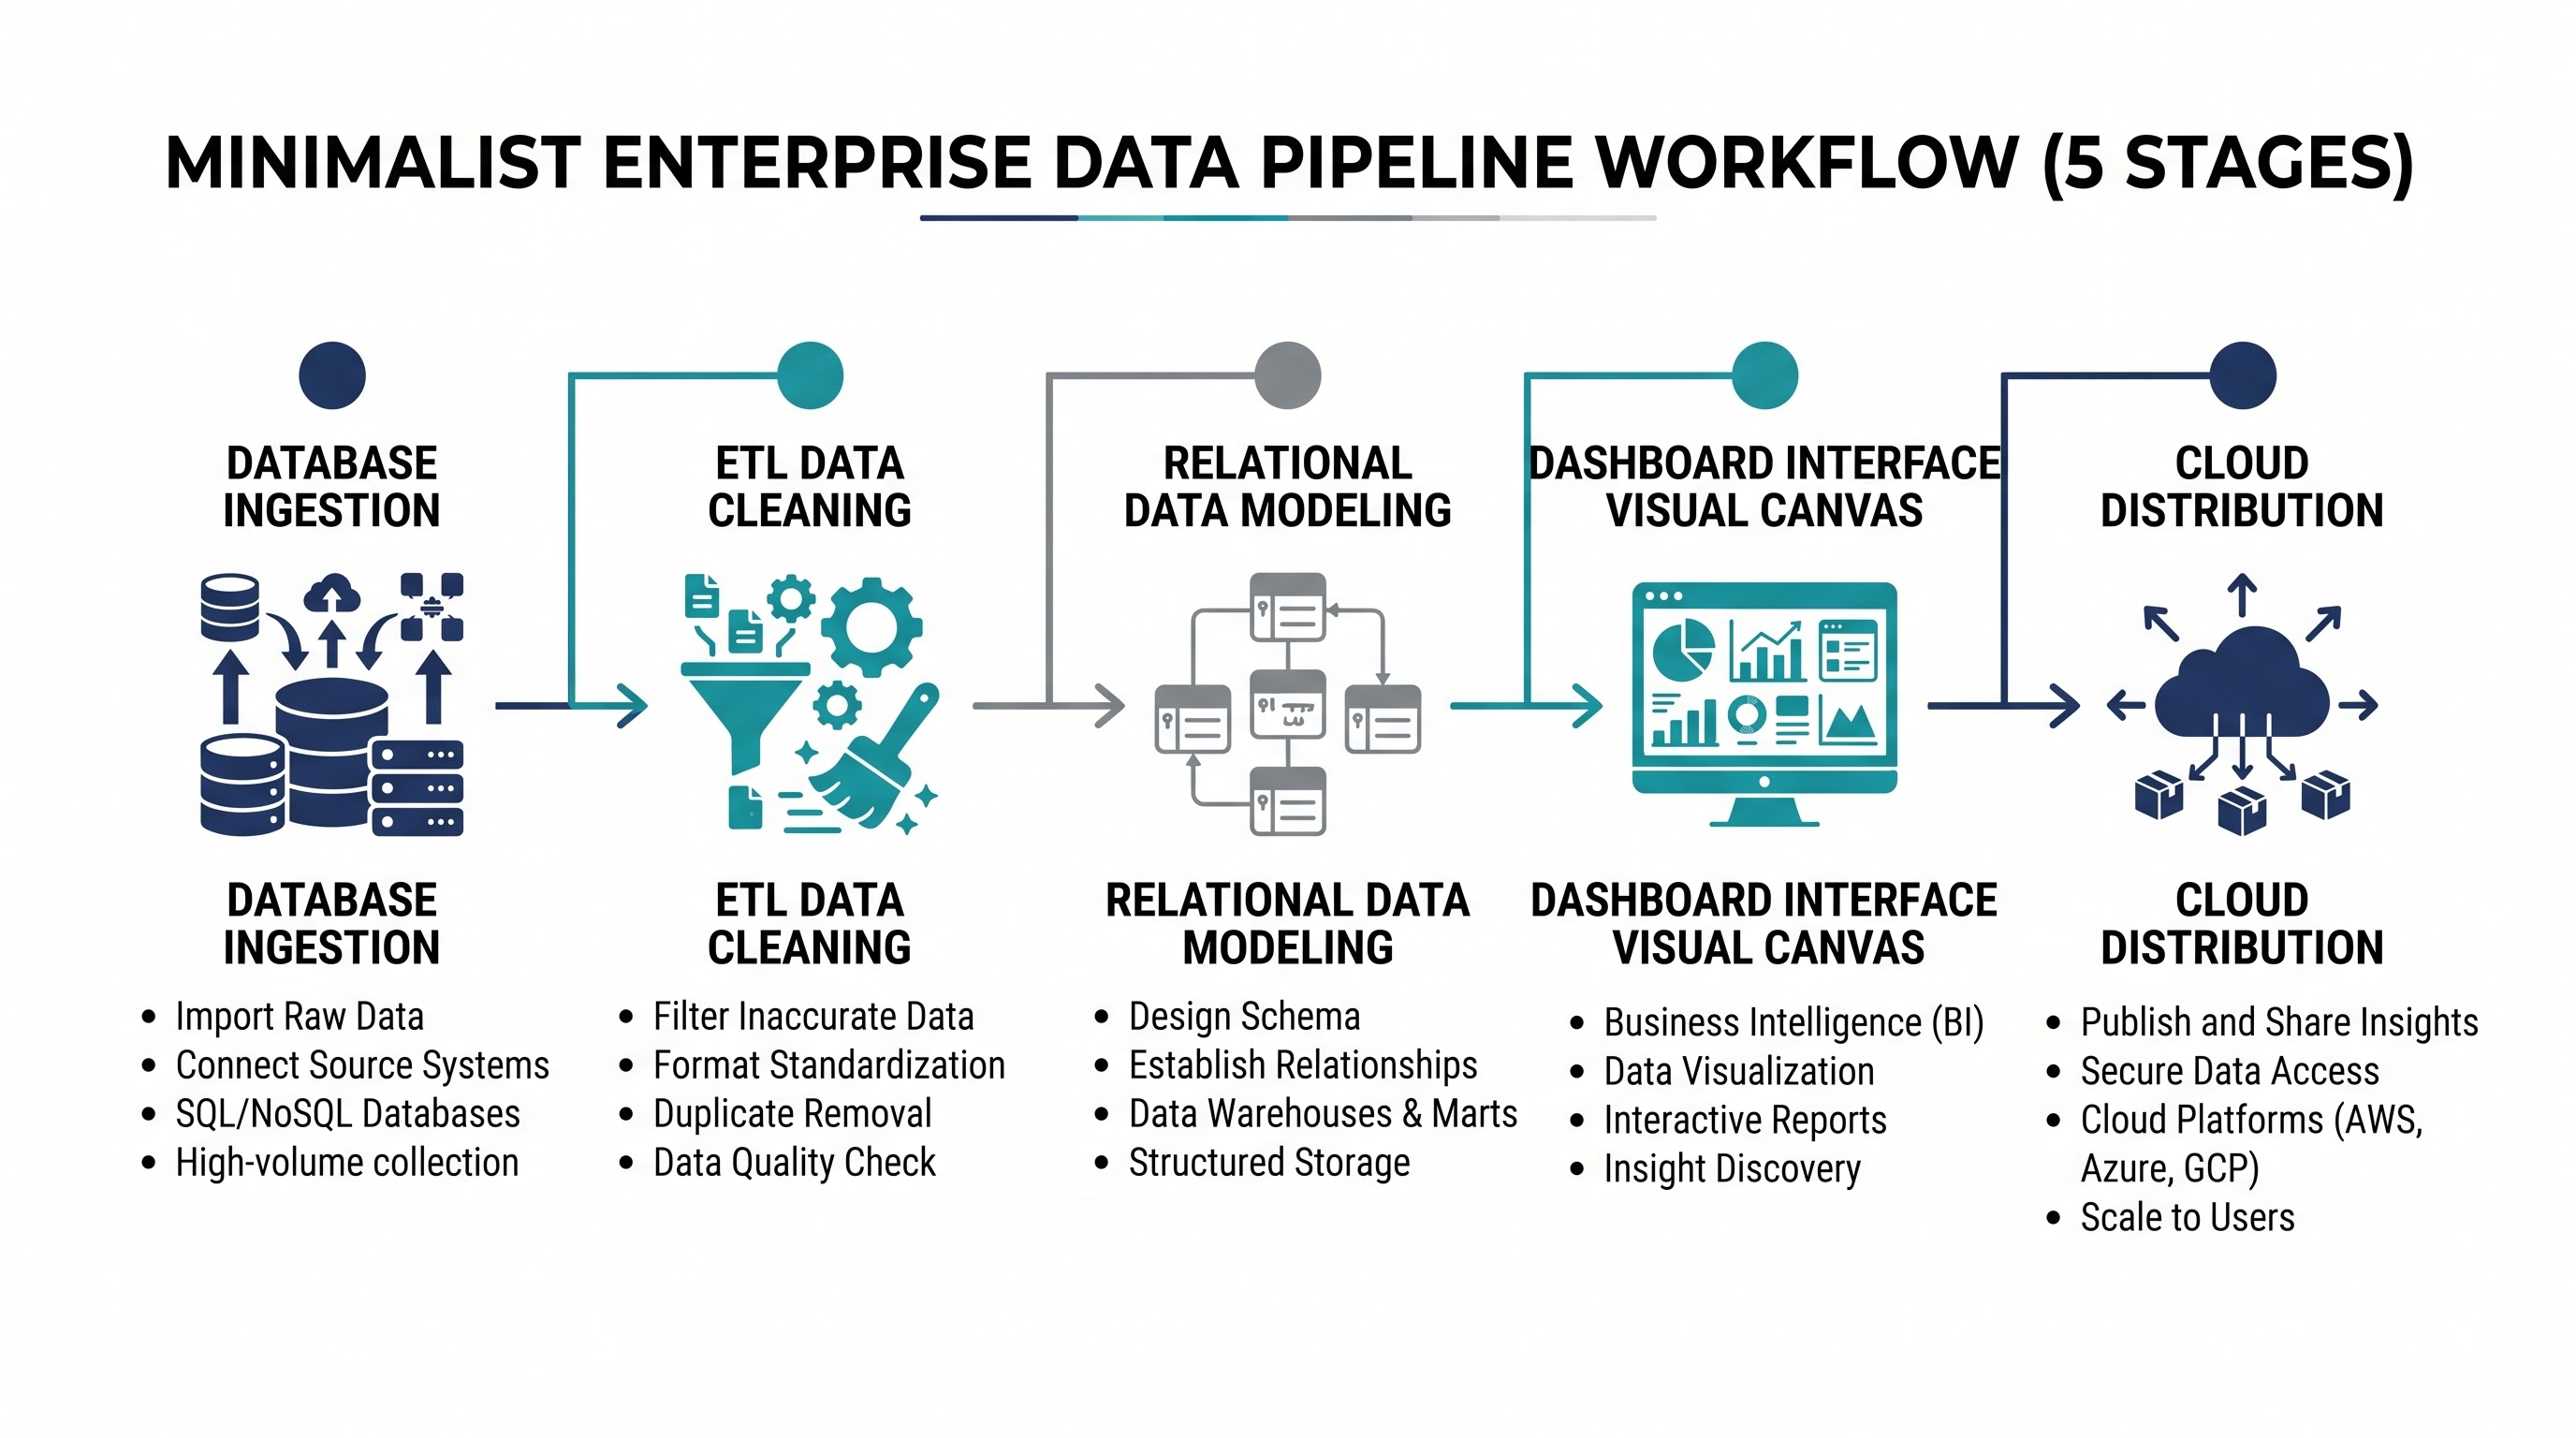
In order to comprehend Power BI effectively, it is necessary to look at the organized path that the raw materials take at the start before they become useful in the hands of the executives.
The process starts with the raw storage systems, then it is changed into a relational model, is then represented as a piece of art and finally, the information is delivered in safe cloud transactions.
Getting Data and Processing It
The start involves establishing connections to data sources. Power BI connects to many data sources quickly as it gives hundreds of options for connections including the traditional relational databases, cloud data storage, and even internet applications.
After this, data cannot be received in an ideal way. The built-in interface for data processing helps the specialists to remove unneeded records, change records using the pivot table.
Constructing the Semantic Model
When clean data is in memory, the report designer starts establishing links between various tables. Rather than creating a comprehensive, large, and complex table that has all the data, Power BI takes advantage of relational models.
By establishing connections between different entities of business such as linking sales to customer profiles, products, and calendar dimension, the engine can filter and sum data in different areas of operation simultaneously.
Calculating Logic
When very basic calculations such as sums or number of records are performed automatically, complex business intelligence involves the use of a specific logic. Power BI employs a professional functional language known as DAX.
With the help of that layer, the program can perform calculations such as year-on-year growth percentages, running financial totals, rolling moving average and dynamic customer retention rates. Since these calculations are computed dynamically at run time, they adjust to any filters or slices chosen by a user on the screen.
Creating the Visual Experience
Once the model has been built, the author creates an interactive visual layout. Users can choose dimensions and facts and place them on charts, such as bar charts, line charts, maps, tree maps, waterfall charts, and card metrics.
Power BI visual components are interactive by nature; when a category is clicked on a visual, it gets filtered and highlighted automatically in other visuals on the screen, which encourages exploring the data in a straightforward way without special navigation tools.
Publishing, Sharing, and Managing
After all is set, the author publishes the file in Power BI Service. The administrator sorts out the content into various Workspaces and allocates specific roles to the authors. In some cases, Row-Level Security rules are implemented so that a manager can only see data for his/her region, department, or level.
Modes of Data Connectivity: Balancing Between Speed and Volume
When corporate applications are concerned, a trade-off must often be made between speed of query answers and the volume of data being handled. Power BI offers different connectivity methods to cover this range of needs.
Import Mode
The Import mode is the fastest mode of operation. Data is taken from the data source during scheduled updates, processed by VertiPaq and stored in memory. This mode offers the best speed and computing power, thus being appropriate for data sets from several thousands to hundreds of millions of rows.
Direct Query Mode
In cases where data lakes reach petabyte size or a real-time report is necessary with no data refreshing required, Direct Query enables Power BI to leave the data stored in the source. In this case, when a user interacts with a report, Power BI automatically creates and executes queries against the database. In this case, there are no memory constraints, but dashboard response will depend on the performance of the database.
Composite Models and Hybrid Tables
Using composite modeling, developers can create a single semantic model that combines both Import and DirectQuery modes. Historical operational data can be stored in high-speed memory, while data for today’s transactions is directly queried through DirectQuery. This way, users can have fast access to historical trend data and operational data in real-time.
Modern Innovations and the AI Frontier
Thanks to the evolution of enterprise analytics, Power BI is equipped with a lot of advanced features, such as artificial intelligence, automated machine learning, and full usage of contemporary cloud platforms.
Natural Language Querying
Power BI has capabilities of natural language processing that allow business people to ask particular questions about their data. Users can just write their questions in the box and the search engine will interpret the speech, reflect it with the help of the model, and generate the visualization in a very short time.
Conversational Insights and Identification of Irregularities
The system uses integrated machine learning algorithms to investigate existing datasets to reveal unusual trends, unexpected peaks, rare declines, and anomalies. The application not only saves time and effort spent on manual examination but also sends automated alerts that indicate the components responsible for the change in business operations.
Microsoft Fabric and Combined Data Lakes
Microsoft Fabric is built around Power BI, an innovative analytical platform. In this startup, companies can use Power BI to connect their data lakes via Direct Lake mode. This means that users can work with large datasets with billions of rows without making duplicates and moving data from place to place.
Co-pilot and Generative AI
The use of generative artificial intelligence in Power BI has simplified development processes to a great extent.
Report generators can verbalize their needs in terms of layouts and the sections in the report shall be created in a sec.
Complex computational logic can be implemented and tested using natural language communication.
Automatic production of texts helps to create easy-to-understand reporters from complicated dashboards instantly.
Enterprise Roll-out Effectiveness: Dos and Don’ts
Just being a pioneer of Power BI in the company does not mean being successful at business. The building of architecture, governance, and people development must be prioritized. Using comprehensive power bi online training enables internal teams to master all the modeling methods and rules for self-service use.
The Star Schema Concept
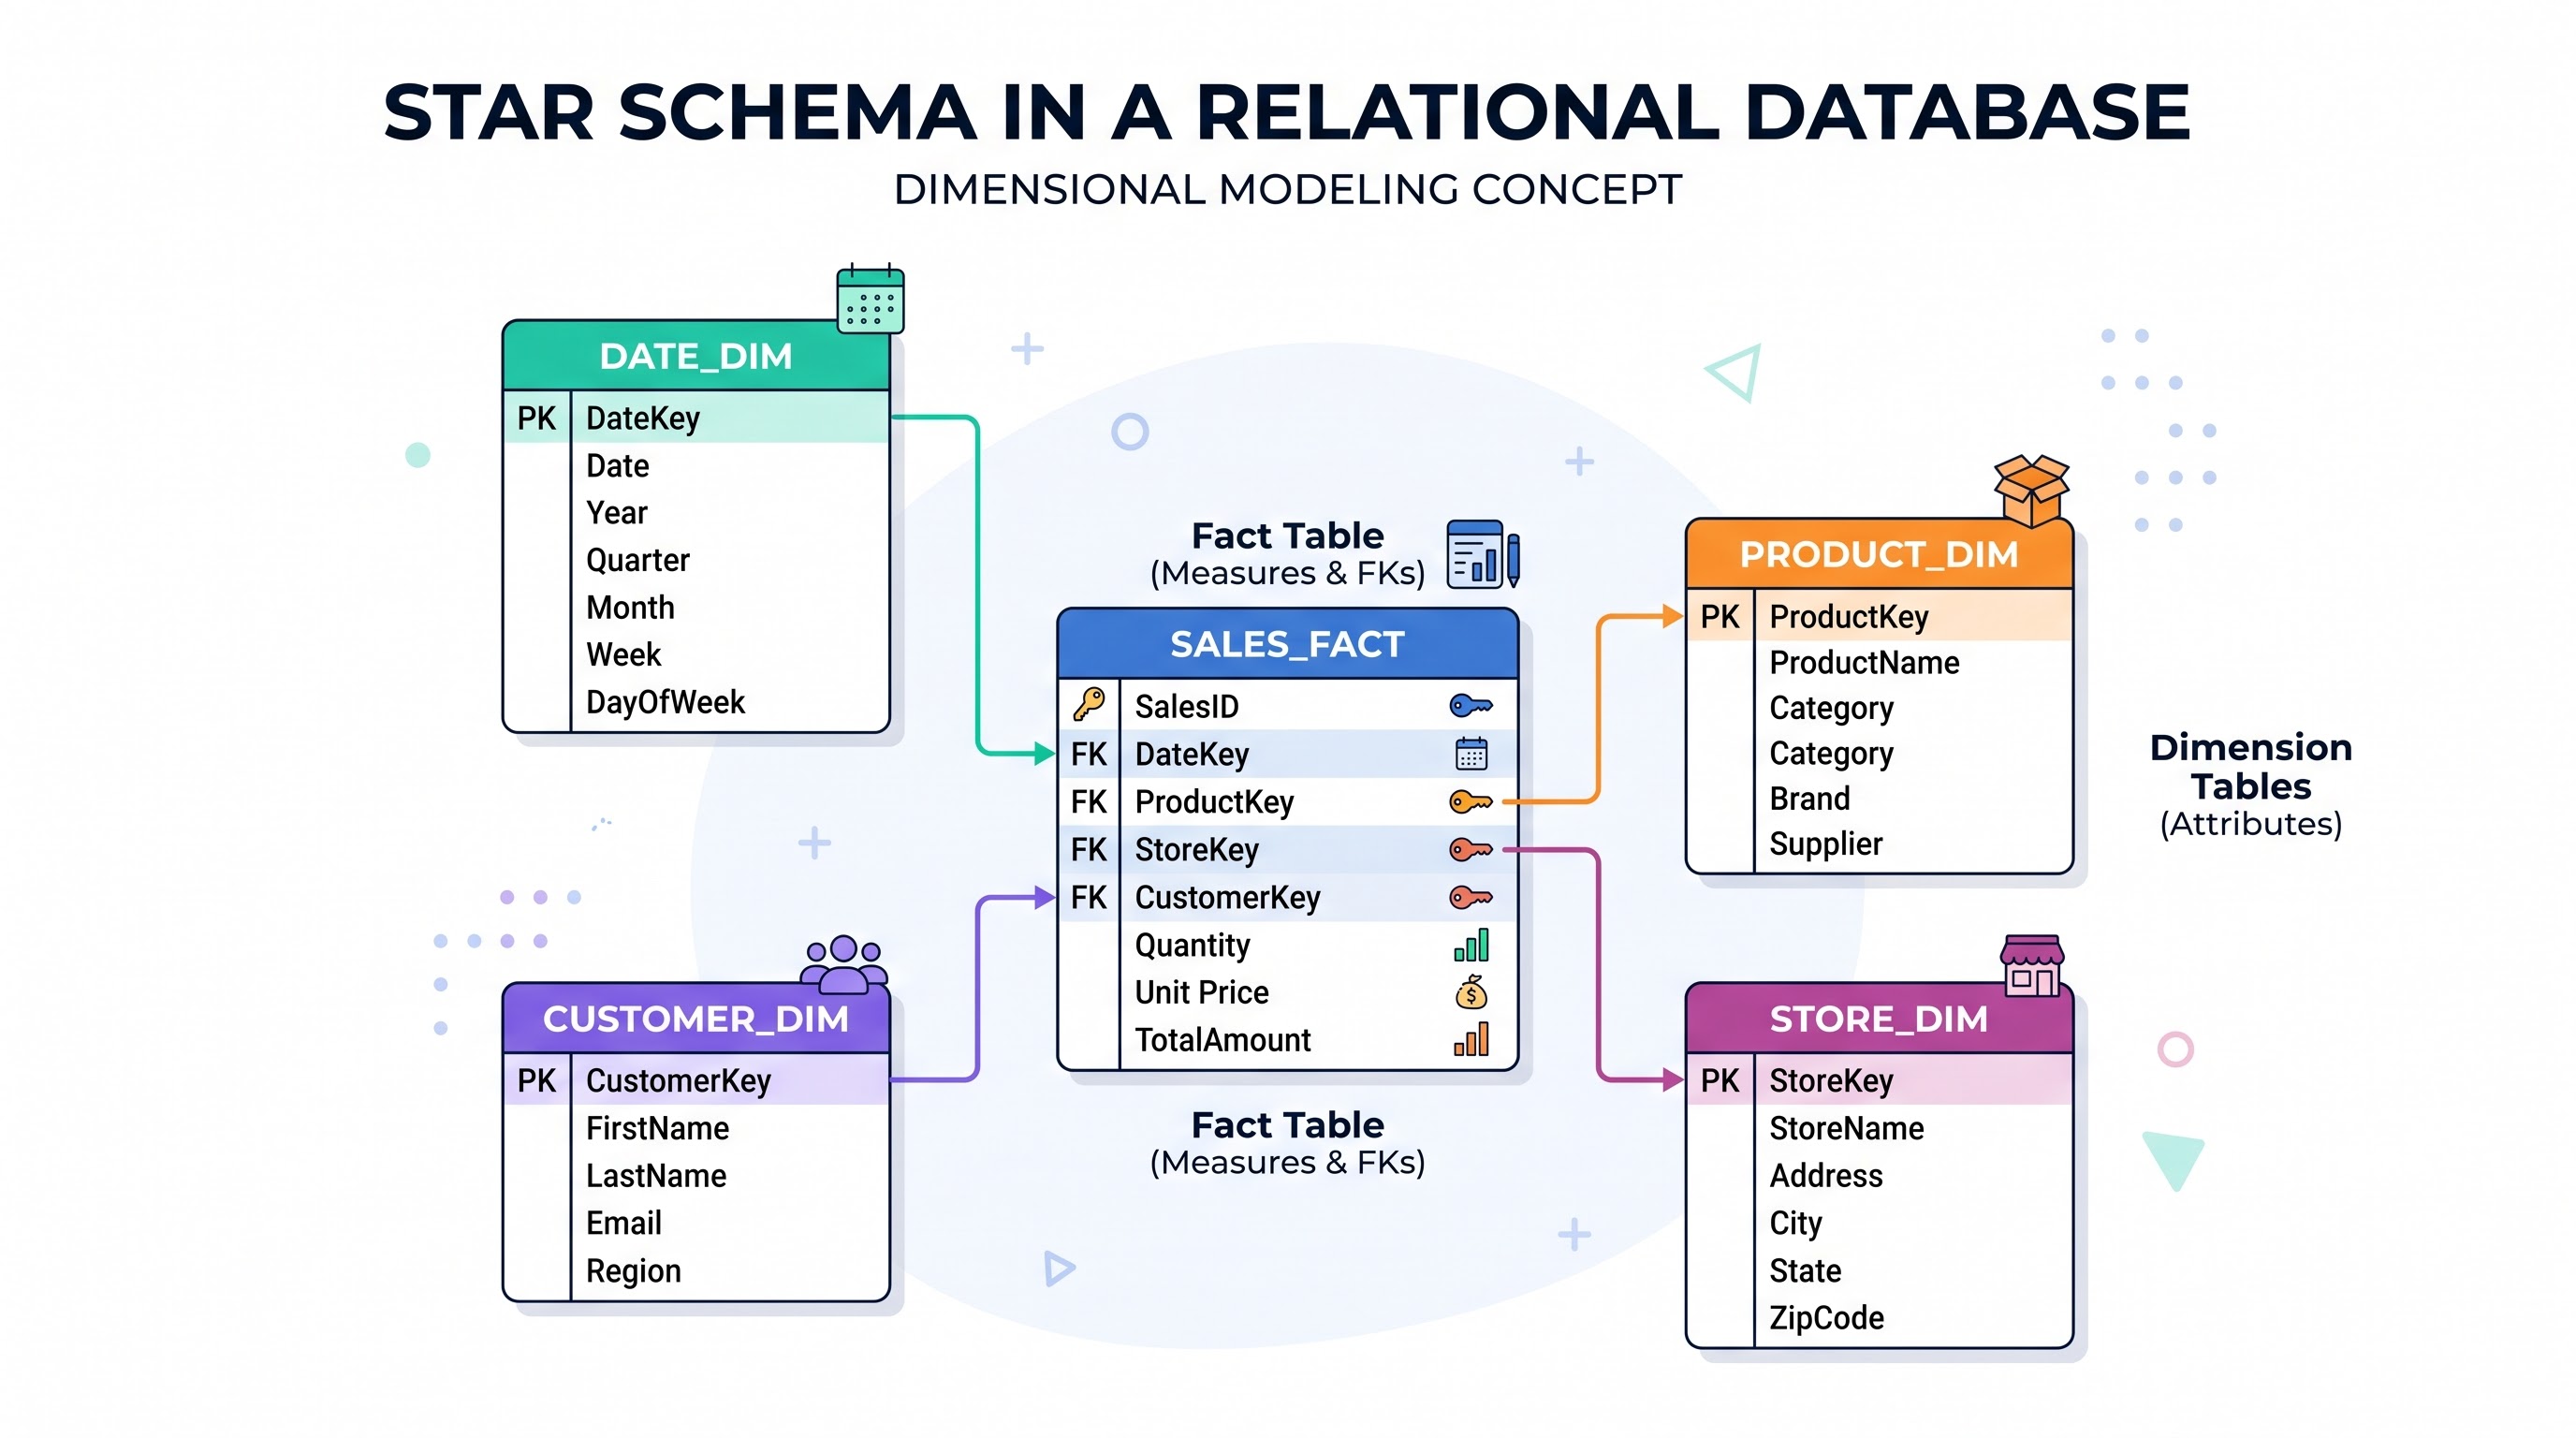
One of the most common mistakes in enterprise self-service analysis is to try to produce reports based on a flat file or a complex snowflake database. It is advisable to stick to a proper star schema.
Maintaining a Balance between Self-Service and Centralized Governance
Companies usually find themselves at one of two extremes when it comes to reporting: either excessively restrictive centralized reporting that leads to delivery delays in IT or uncontrolled self-service that causes competing and inconsistent reports.
The right mix consists of managed self-service.
Centralized enterprise analytics teams employ certified and centrally regulated semantic models, which use uniform definitions for important business metrics like revenue, profit, and turnover.
This means that the business analyst personnel of the various departmental units can build customized reports using these unified models.
Thus, the company is able to achieve a balance between flexibility in reporting and a single source of truth at the organization level.
Enterprise Lifecycle Management and DevOps
Developed analytics processes necessitate reliable deployment controls. The latest version of Power BI incorporates deployment pipelines used for all phases: development, testing, and production. Report creators have the ability to compare between different environments, perform automatic validation procedures, monitor model changes using version control systems, and deploy new updates efficiently without impairing executive reporting environments.
Safety, Adherence, and Information Security
The importance of defending analytical data is evident in today’s tough privacy laws. Power BI is associated with Microsoft Purview Information Protection, providing administrators with a means of applying sensitivity labels to organizational data models. When reports are downloaded in a spreadsheet or presentation format, both the security classification and encryption rules are automatically included in the file. The Row-Level and Object-Level Security prevents unrestricted people from looking at sensitive operational results and data from specific columns.
Improving Speed and Resource Efficiency
Huge reports are frequently vulnerable to slow loading and running speed due to the presence of unused columns with a high rank, wrong custom calculations, and too many visual representations presented on one canvas. Efficient teams practice modeling principles that include the removal of unnecessary columns, the use of numeric identifiers, avoiding two-way relationships if possible, and reducing the number of simultaneous visuals.
Industry Applications and Effects on Businesses
Power BI has shown its flexibility by being implemented in numerous fields and industries.
Finance Department
Power BI is being adopted by finance departments of companies, replacing the old way of generating reporting through static presentations using Power BI features of variance analysis. The finance department connects actual expenses directly with financial records in the ledger and tracks performance of budget versus actual results in all the working countries of the company. The users are able to drill down the whole information from reports and make a decision within seconds.
Supply Chain Management
Global supply chain companies use real-time display of inventory turnover, warehouse capacity, and transportation. Users observe geospatial maps showing deliveries and can see on the map the regions of the potential shortages.
Administration in Healthcare and Its Impact on Patients
Healthcare providers implement Power BI to track saturation levels in health facilities, usage of the operating room, and chances for patients to be re-hospitalized. By combining clinical data with operations tools with the help of robust cybersecurity measures, hospital management can ensure the best allocation of human resources and necessary medical equipment within emergency departments.
Power BI and the Analytics Industry
When it comes to the business intelligence market, Power BI is one of the most advanced platforms along with tableau, click, and looker. There are three key advantages that Power BI has over other business intelligence solutions:
Seamless integration with other software: Power BI can work perfectly with Microsoft 365, Microsoft Teams, Microsoft SharePoint, Microsoft Azure Synapse and Microsoft PowerPoint. Thus, the information is available for users in various channels where they exchange communication.
Cost and Product Development: There are clear pricing and licensing policies in place which allow everyone from entrepreneurs to big Fortune 500 companies to access Power BI.
Product Development: Power BI improves its solutions every month using customer feedback, safety updates and new visual tools.
Getting Raw Data to Strategic Clarity
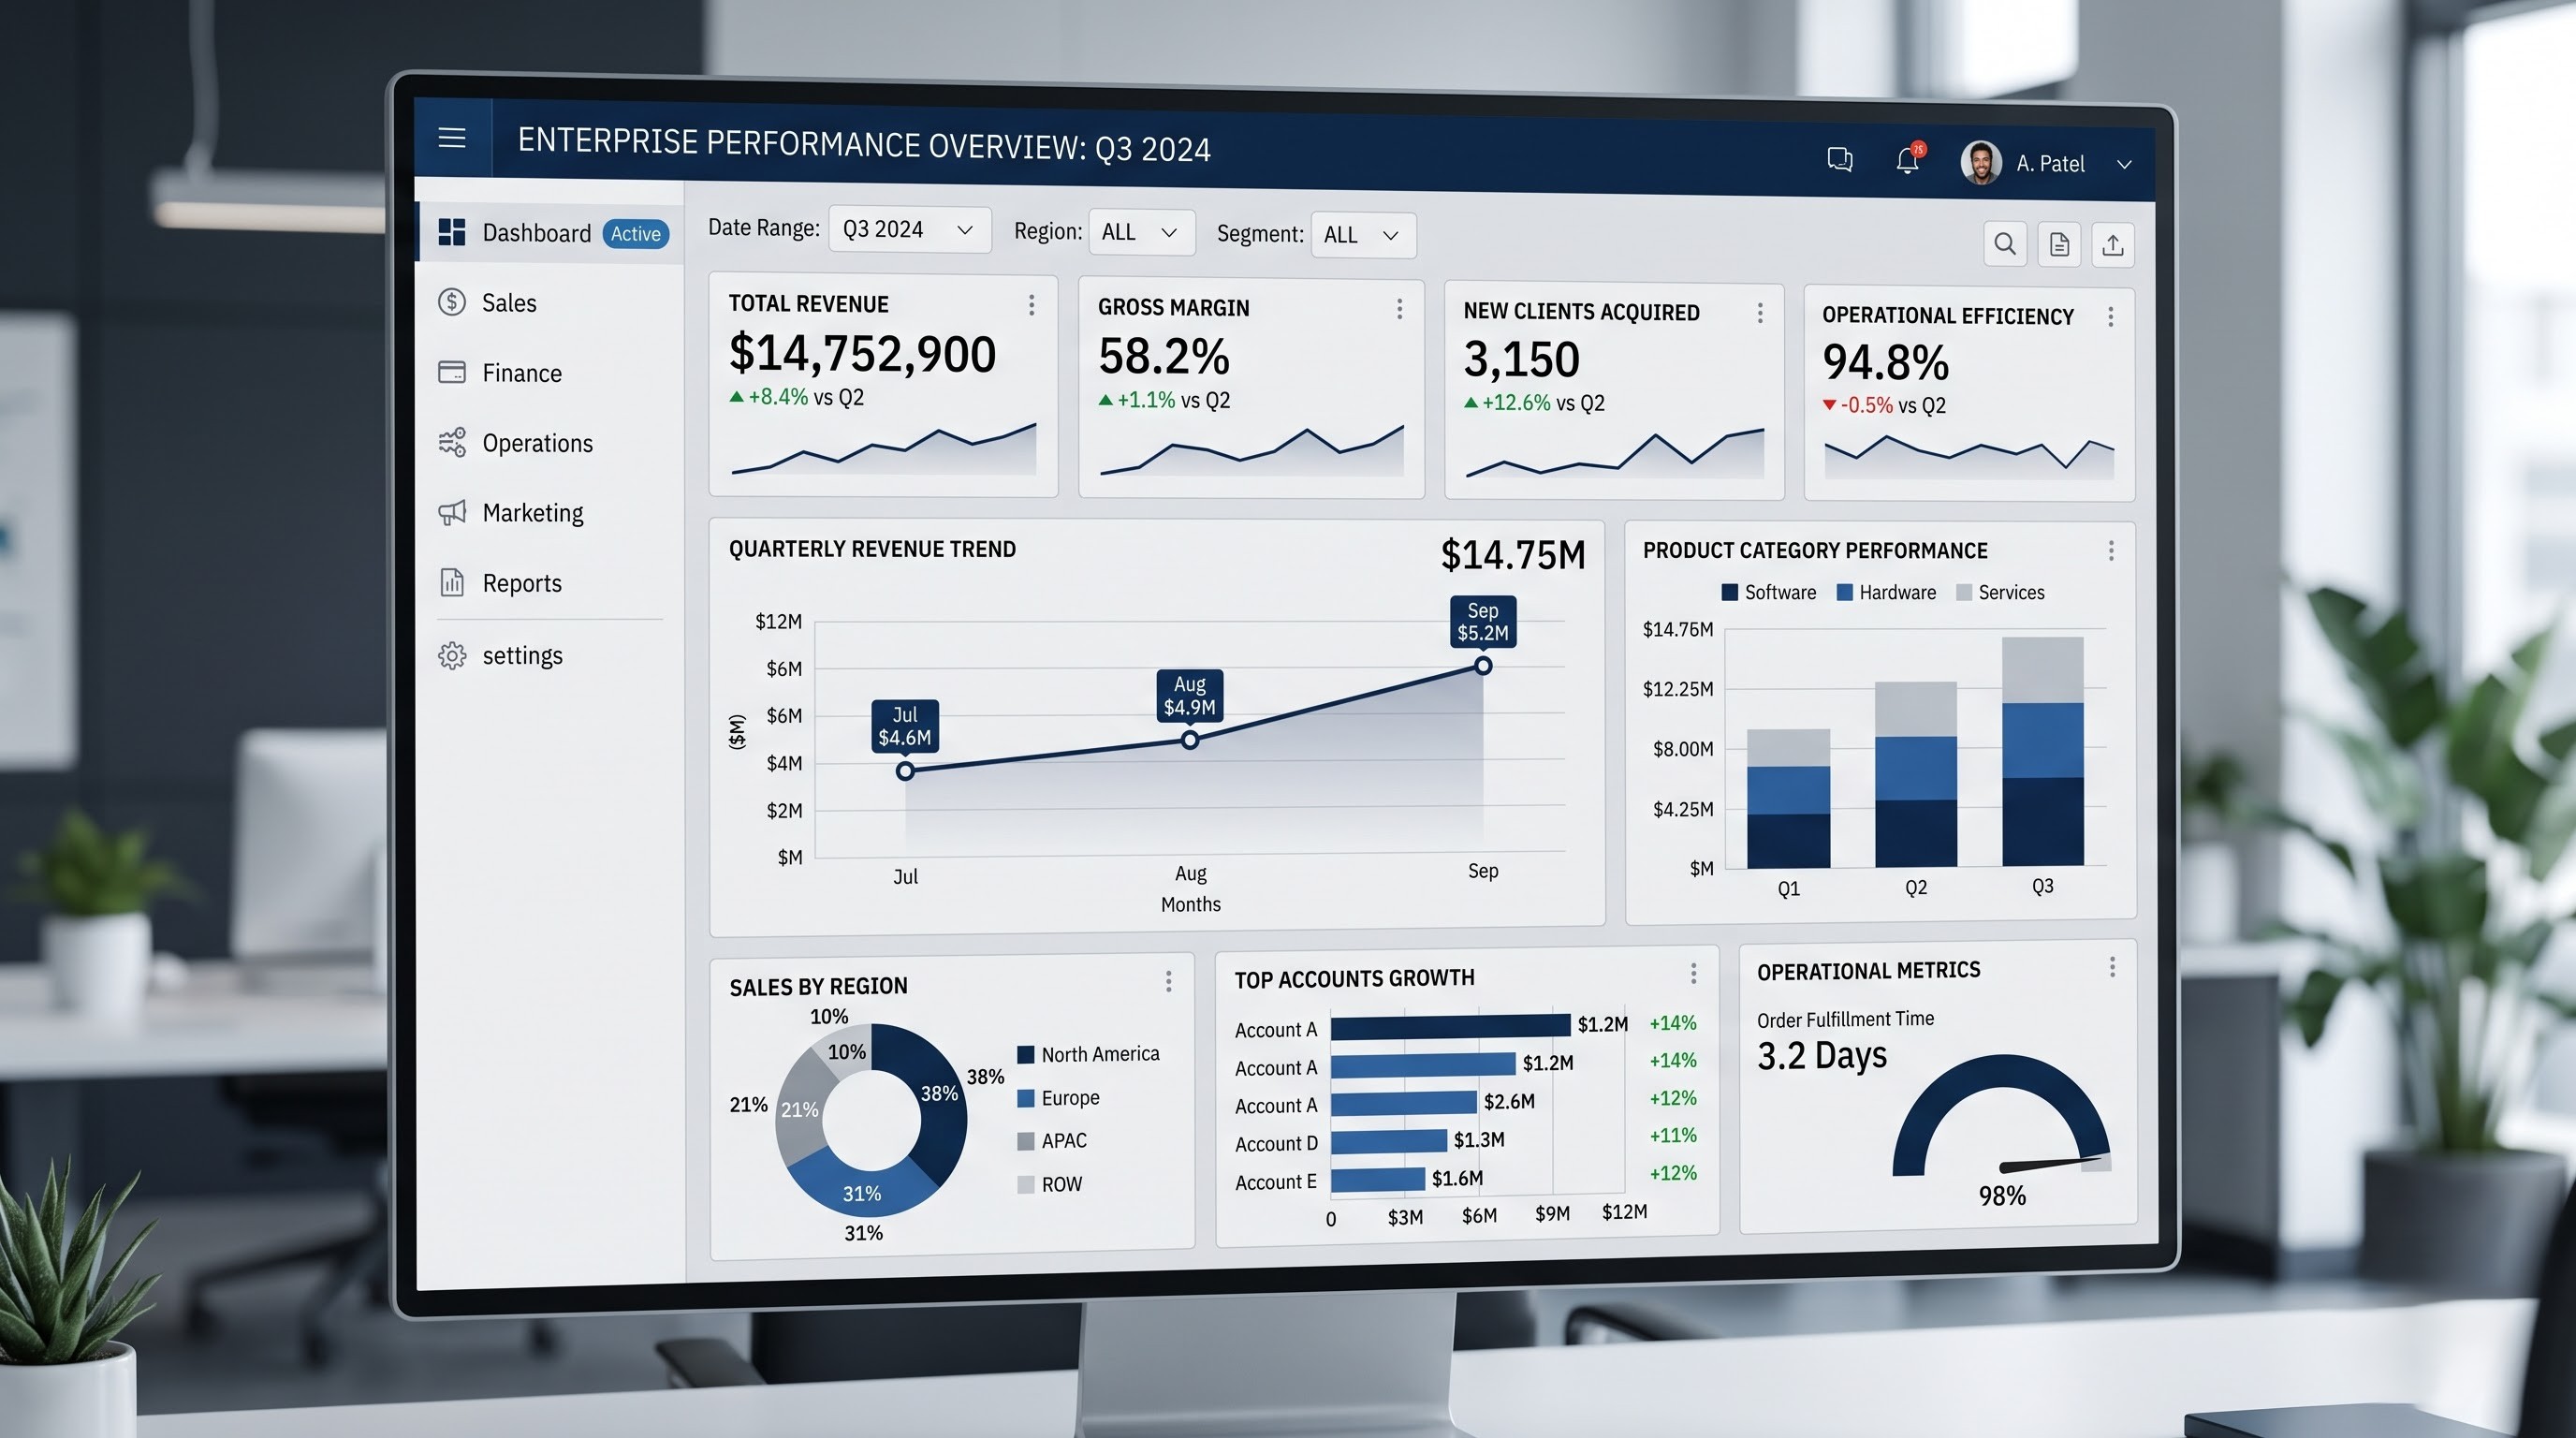
Successful enterprises in the present-day marketplace do not only gather data. They create a climate of perpetual learning and data-driven choices.
Microsoft Power BI acts as a bridge between raw construction and strategic execution. By integrating data transformation, relational modeling, advanced computation, governance, and interactive visual storytelling—making it accessible to everyone—it democratizes analytic power at all company levels. As companies continue to grow in the direction of increased automation and data complexities, Power BI becomes a critical tool for transforming noise into actionable clarity.