
The Power of Tableau in the Modern Data Revolution
Last updated on Aug 17, 2026
Introduction: The Democratization of Data
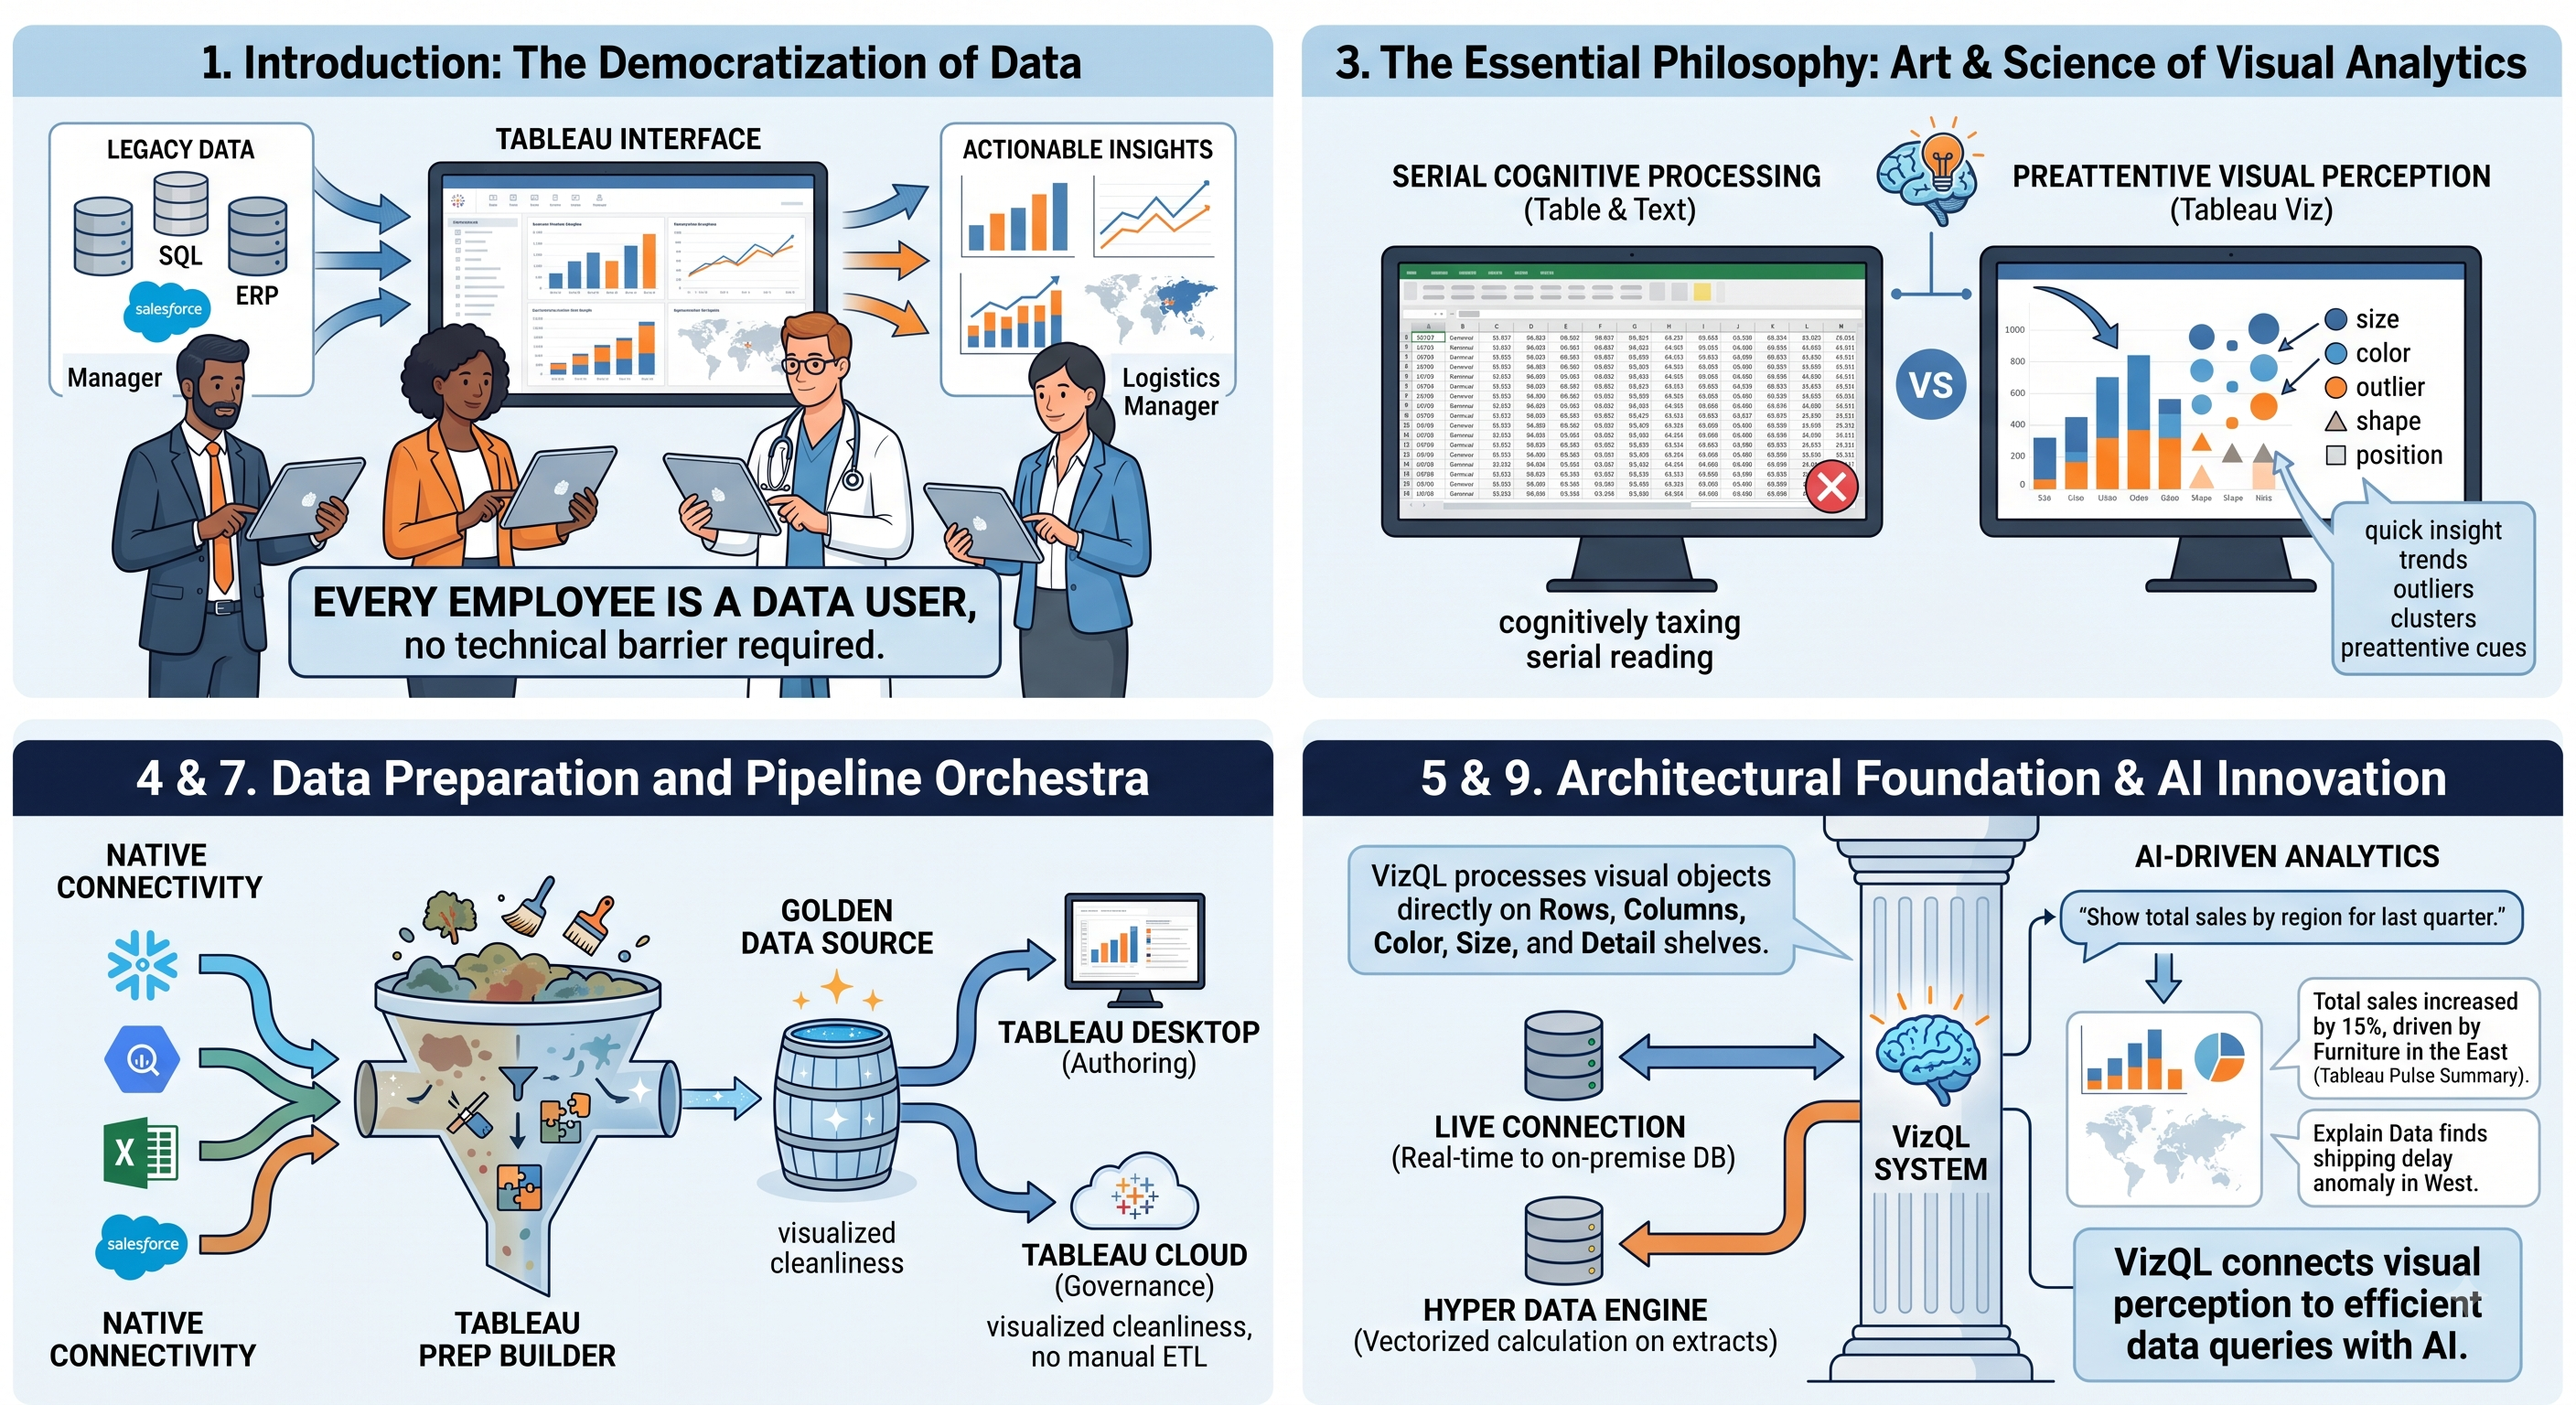
The corporate world relied on technical complexity for decades. The databases, the enterprise resource planning systems and legacy reporting solutions stored huge chunks of data, and drawing useful conclusions from this data entailed the need for database administrators, writing intricate SQL queries and spending days or weeks producing and generating the reports. By the time executives got their hands on the printed reports or spreadsheets, the business context had changed and the opportunities vanished.
The introduction of Tableau fundamentally changed the situation. By marrying aspects of modern computer science, HCI and cognitive psychology, Tableau turned raw data processing from a difficult and complicated technical task into a simple and intuitive process. The company introduced the principle of democratization of data, i.e. the idea that every employee of an organization should be able to use the data no matter how competent he or she is technologically.
Data literacy is no longer a luxury that only software developers embrace, but it has become a must-have competence for managers, marketers, doctors, logistics managers, and state employees. This niche has become actively developing in many industries, persuading many professionals to enroll in the best tableau training online. The role of Tableau in this area is significant as it utilizes the talent of people to recognize images linking the dislocated information technology systems of different companies.
The history of Tableau
Academic Beginnings at Stanford University
The beginning of Tableau may be traced back to Stanford University from 1997 to 2002. The project financed by the US Defense Advanced Research Projects Agency was led by computer scientist Pat Hanrahan, PhD student Chris Stolte, and businessman Christian Chabot in order to tackle the question of how to represent huge multi-dimensional databases to the users who are not computer programmers.
The idea behind the work was that relational databases can only express mathematical sets and sets in mathematical relations while human beings depend on visual characteristics like colors, sizes, orientations and positions of objects. This realization led to the belief that if every user action of dragging a field to a canvas, filtering the category or grouping of values could be converted into a database query while at the same time producing the visual representation of data, the user would be watching the process of data analysis in an interactive and exploratory way.
To make it possible, VizQL was developed, which is a visual query language combining the querying of data with visual representation and analysis of data. In 2003 the founders of Tableau Software, that was formed in Mountain View, California, i.e. Chabot, Stolte and Hanrahan, created a tremendously powerful tool, which can help in business intelligence.
Beginning with the Transition from Individual Use to Large Scale Application
Right from its launch, Tableau Desktop won the approval of the individual data analysts, who were running into problems that involved the analytical and visual capabilities of conventional spreadsheet applications. These analysts could access local files and corporate databases with direct links and create interactive dashboards in a matter of a few minutes.
After numerous companies embraced the concept of the new kind of analytical tool, the issue of scaling emerged. This is how Tableau Server was created – a tool that allowed users to share interactive dashboards in a web browser and run regular data refreshes while ensuring the security typical of enterprise software. The appearance of Tableau Cloud completely covered the issue, as it provided its users with a hosted environment and eliminated the need of having any local alternative infrastructure.
The Salesforce Era and The Age of Augmented Intelligence
In 2019, Salesforce bought Tableau for more than $15 billion, marking a milestone for both entities. It means that Tableau became a part of one of the leading customer relationship management platforms and expanded its technological capabilities. With Tableau now capable of doing more than just traditional dashboard building, it has integrated new technologies into its solutions, such as generative artificial intelligence and automated metric summaries via Tableau Pulse. Moreover, Tableau can use real-time streaming data formats, which allow it to make direct connections with modern data warehouses and consolidated data platforms.
The Essential Philosophy: The Art and Science behind Visual Analytics
Understanding Human Perception and Attributes of Preattentive Processing
Tableau is founded on cognitive science, focusing on the human visual perception. In dealing with numbers presented either in tables or text, the brain has to apply serial cognitive processing whereby it reads the information in a sequential manner across the cells. This approach is cognitively taxing and often misses important patterns or correlations.
On the contrary, visual analytics takes advantage of preattentive processes in visual perception. Pre-attentive processes are low-level visual cues that are perceived before the conscious attention takes over and they include things like position on an established scale, line length, 2-d positioning, color hue, saturation, shape, and grouping. By aligning quantitative and qualitative aspects with the preattentive features, Tableau becomes capable of informing users of trends, outliers, clusters, and sharp drops in performance in a short time.
Visual exploration involves various stages and elements
It is not merely a straightforward process of creating a final work of art. Rather, it is a controlled cycle of interrogation, exploration, and improvement which begins with the following events:
The data is gathered and arranged: The analyst connects to the data and designates fields on visual shelves.
Patterns emerge: The visualisation shape shows unexpected spikes, holes, or relations.
Hypothesizing and filtering: The analyst digs deeper, choose particular areas, or add context.
Communication: The results of the work become the base for a collective transparent decision-making process.
Tableau makes it simple to get from questioning to visualising, thus allowing the analyst to have a perspective flow, in which their curiosity directly guides them to exciting business solutions.
The Tableau Ecosystem
Tableau is an interconnected system composed of many applications. This system encompasses various software tools, which have different purposes to meet various requirements through stages like data preparation, data publishing and data consumption.
Authoring and Exploration
Tableau Desktop: The primary instrument for visualization of data is set up on the computer which permits users to work on complex models, calculated fields, and maps. When the major technical functions are learned through a structured tableau developer course, the user is able to create dashboards for business intelligence with the help of this knowledge in the writing.
Tableau Web Authoring: This tool contains all the features of Tableau Desktop and allows its users to work on their visualizations using the server system, which does not require any installation on their PCs.
Tableau Public: This program is known as one of the applications offered free of charge and used by users worldwide, including journalists, scientists, and any creators who want to publish their own ideas.
Double-checking to ensure the originality check’s parameters
Sharing, Collaboration and Governance
Tableau Server: The enterprise deployment option that businesses can install, manage, and scale in-house, or in their own private cloud. It takes care of managing centralized sources of data, authorization of users, permissions based on their roles, automated background extracts and enterprise collaboration.
Tableau Cloud: Fully managed SaaS version of the tableau server, provided by Tableau and Salesforce. It takes care of all maintenance of the infrastructure, automatic upgrades, scalable capacity, and works with modern cloud data stacks.
Tableau Mobile: A dedicated application for iOS and Android tablets and smartphones, delivering touch-friendly dashboards, so the mobile executives and employees can access the key metrics anywhere.
Tableau Reader and Tableau Viewer: Tableau Reader is an obsolete application for desktop that allows to view the static packaged workbooks. In companies it has been replaced by licenses of Tableau Viewer through Server and Cloud, providing secure and browser based usage.
Data Preparation and Transformation
Tableau Prep Builder is a data preparation solution that demonstrates how to prepare data for better analysis by cleaning, formatting, combining, and converting all sorts of unorganized and differently formatted data. The system comes with an easy-to-use profile-based user friendly interface that allows users to easily rotate columns, eliminate whitespaces, combine data that is spelled similarly, and link tables without creating transformation programs.
Tableau Prep Conductor – an additional feature that is available through Tableau Server or Cloud – operates automatically by scheduling, overseeing, and making data preparation flows work so that data is processed efficiently throughout the entire organization.
The Architectural Foundations of Tableau's Data Processing and Visualization
Grasping the mechanics of Tableau helps in understanding why this software can process data fast and efficiently, even when they contain hundreds of millions of records.
The VizQL System
The core of Tableau functionality relies on the VizQL system. Old-fashioned BI tools create constant charts by making references to the database, filling out an intermediate data grid, and attaching a specific chart type (e.g. standard bar chart, pie chart, etc.) to that grid.
The VizQL system works differently because it does not need an intermediate grid. It processes visual objects that lie on the rows, columns, color, size, and detail shelves and automatically creates a query suitable for the encoding of the database engine. Once the database runs a query and returns the results, VizQL converts these results into graphic primitives. The architecture allows keeping constant links between visual formats, aggregation levels, and data-related queries.
Live Connections or Hyper In-Memory Extracts
Tableau provides its users with two different methods of interacting with the original data sources, which are appropriate for different business situations.
Live Connections means that Tableau forwards queries to the on-premise database directly and in real-time. The relevance of this mode stems from the requirement of a company for instant data crucial for the efficient workflow, as well as from the ability of the organization to make use of the advanced data warehouse allowing for complex analytic queries to be performed in milliseconds.
Hyper Data Engine is designed as a successor to the old-school extraction facilities. It is the property of Tableau; it is hugely effective. The Hyper Engine gets the data out of the data sources and provides quick calculation across a few millions of records because of its vectorized execution capabilities, column-wise reading, and multi-core processing.
Flexibility of Hybrid Architecture
Tableau operates its hybrid architecture mapping. It helps the users in making live connections with fast-cloud data integrations, which helps control transactions. Furthermore, Tableau can allow creating different file formats for traditional databases situated on the premises.
Innovative Analytical Principles
Overall, Tableau is mostly famous for simplicity, at the same time, it has developed special and advanced methods to perform analytical tasks involving advanced calculations and forecasting.
Types of Dimensions, Measures, and Their Classification
According to Tableau, there are basic data roles given to any particular data parameter.
Dimensions: Representing categorical data, (describing customer categories, regions, and order status) dimensions highlight all aspects of the final visualization.
Measures: Presents constant numbers within the database.
Taking into consideration differences between categorical (blue) and constant types of data (green), Tableau provides users with a possibility of controlling the axes, text, and colors of the analysis.
The significance of Calculated Fields
Tableau has a powerful function, offering a strong calculative feature that allows the users to achieve the following:
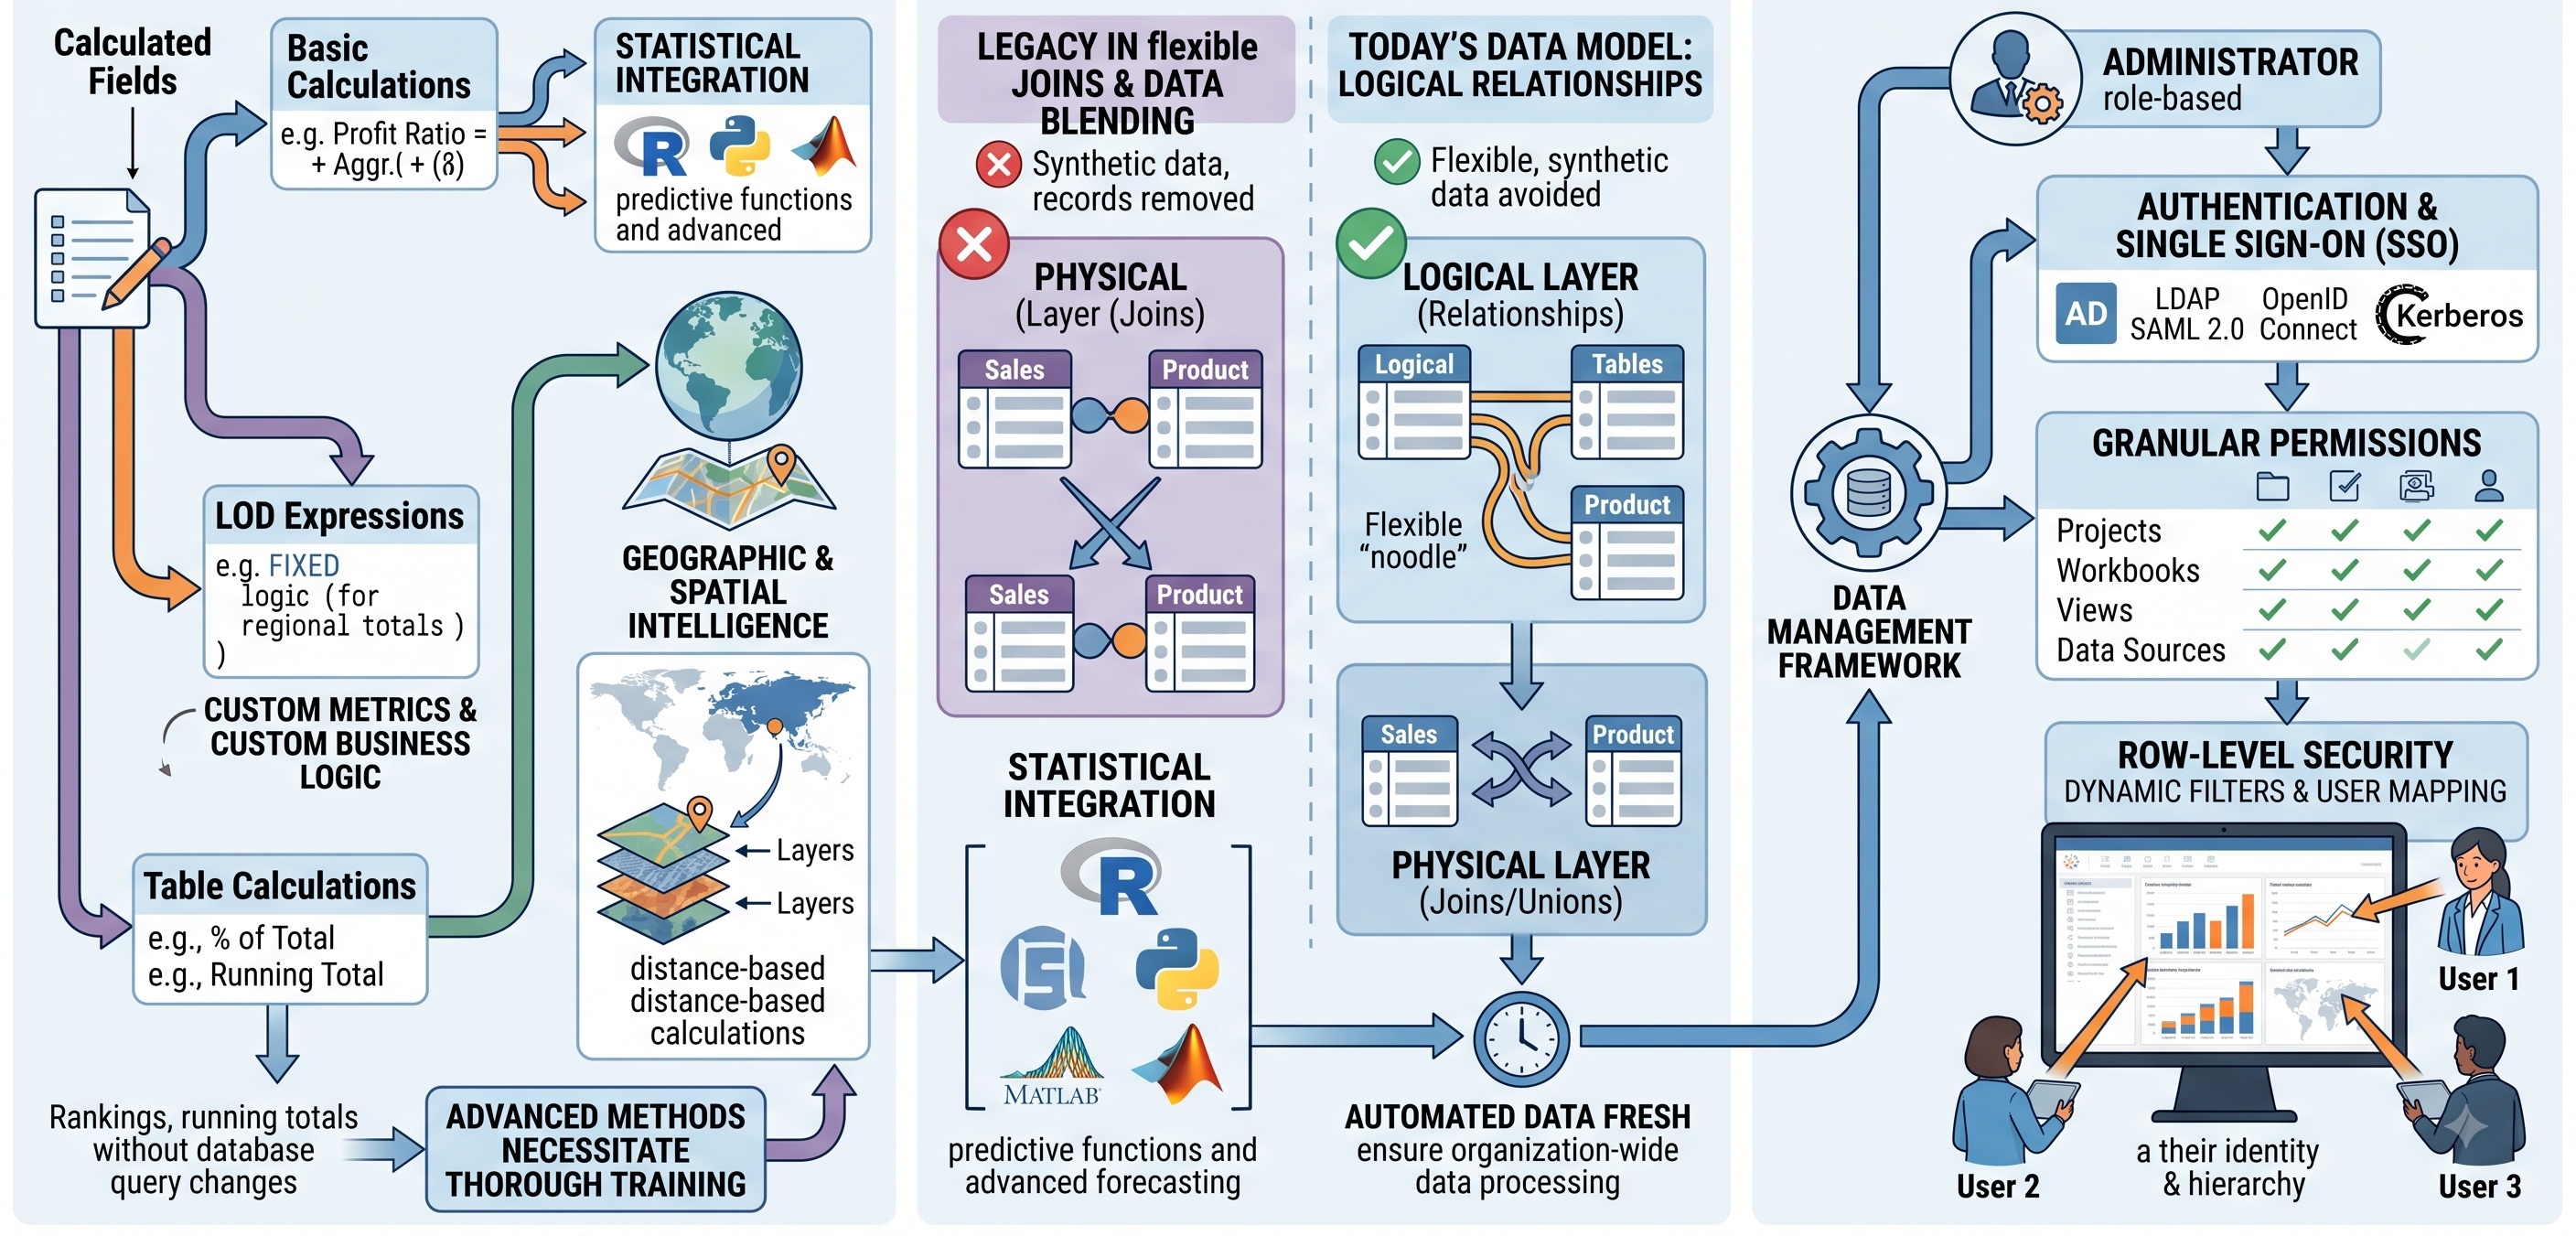
Basic Calculations: The users can perform row level operations and aggregate expressions, for instance calculating profit ratio, conditional operations, string manipulations, and date difference calculations.
Level of Detail Expressions: Tableau provides robust calculation functionality for users to create personalized metrics and sophisticated business logic based on comprehensive calculations. However, advanced methods such as Level of Detail (LOD) expressions and complicated table calculations necessitate practicing and experimenting with them, making thorough tableau developer training very important for the acquisition of these analytical processes.
Table Calculations: Calculating values with the help of total aggregate set of data brought back by the Tableau on the client side so that running totals could be calculated, period growth and process of calculating the percent of total along with the ranking without changing the database query itself.
Geographic Intelligence and Spatial Intelligence
Tableau comes with an inherent geospatial engine that contains ample data about the globe's boundaries, states, provinces, zip codes, and metropolitan areas. The tool autonomously gets the latitude and longitude measurements by identifying various geographical names. It also offers multiple spatial data forms, shapefiles, maps that have many layers, territory grouping formed from the spatial data, and calculations based on distances.
Statistical Integration and Predictive Analytics
Besides the basic trend lines, confidence bands, and exponential smoothing forecast, Tableau has bi-directional analytic features built into the tool. With these features, Tableau is able to send data to the external statistical engines, like R, Python, MATLAB, and perform various predictive functions.
Data Preparation and Integration and Orchestration of Data Pipeline
Broken and incomplete data are frequently the reasons for failures in modern analytics. Data analysts used to utilize up to eighty percent of their working time for data collection, purification, and normalization only before performing any analytical functions.
Native Connectivity to Data
Tableau features hundreds of connectors, including:
Cloud Data Warehouses: Snowflake, Google BigQuery, Amazon Redshift, Microsoft Azure Synapse, and Databricks;
Relational and NoSQL Databases: Oracle, Microsoft SQL Server, PostgreSQL, MySQL, IBM DB2, MongoDB, and Apache Cassandra;
Enterprise Applications: Salesforce CRM, Google Analytics, ServiceNow, SAP S/4HANA, and Workday;
Local Files and Big Data Frameworks: Parquet, Excel, CSV, JSON, Apache Hadoop, and Spark.
Modern Data Model: Relationships and Physices Layers
Previously, it was essential to either use inflexible physical joins or data blending to achieve integration of data in Tableau. Today’s data model allows to separate logical layer from physical layer in Tableau:
The Logical Layer (Relationships): In this layer, users are able to establish relationships between logical tables through commonality in fields. In this case, logical tables are not merged, and records of data that remain unmatched are not removed before some form of aggregation. Therefore, there is no duplication of synthetic data, and the process of analysis of several fact tables is simplified.
The Physical Layer (Joins and Unions): In this layer, users are given the opportunity to perform joins and unions that involve direct access to the physical layer.
Facilitating Data Hygiene through Tableau Prep
Tableau Prep Builder is a revolutionary tool for data cleansing. Organizations can now visualize data cleanliness by revealing missing values using visual distribution techniques, combining similar values using phonetics and spelling algorithms, transforming wide format data to longer structures, and building complex multiple step pipelines. This makes it possible to minimize dependence on complicated external ETL scripts for regular business analytics.
Enterprise Deployment, Security, and Governance
With analytics expanding from departmental prototypes to corporate solutions for thousands of users, strict rules of governance, security, and data access have to be established.
Role-Based Access Control and Row-Level Security
Tableau Server and Tableau Cloud provide strong security architectures:
Authentication & Single Sign-On: Full integration with Active Directory, LDAP, SAML 2.0, OpenID Connect, and Kerberos are ensured compliant enterprise identity management solutions.
Granular Permissions: The administrators are allowed to set up the fine-grain permissions throughout the projects, workbooks, single views and published data sources.
Row-Level Security: Dynamic filters and user mapping functionalities enable organizations to publish just one dashboard which will automatically limit the number of visible rows completing users’ identities and management hierarchical levels.
Data Governance in Tableau Catalog
The conflict between agile self-service analytics and centralized IT governance has always been an issue for enterprise technology leaders. Tableau solves this problem through Tableau Catalog and the Data Management framework:
Centralized Data Sources: Data engineering teams can gather, check, authorize, and publish golden data sources that contain unified calculations, metadata, and security procedures that help business users conduct their investigations with no uncertainty.
Data Lineage and Impact Assessment: Tableau Catalog shows the full path of data from the underlying database to each individual dashboard. For example, if the type of a column is changed by a database manager, the impact analysis process determines within a split second what workbooks and dashboards will be affected.
Data Quality Warnings: Administrators and data maintainers may attach data quality warnings to the datasets that are being processed, warning business users about temporary inconsistencies directly on the dashboard screen.
Tableau in the Age of AI and Enhanced Analytics
The field of business intelligence is witnessing a major change due to the impact of generative artificial intelligence, natural language interfaces as well as self-sufficient diagnostic insights while Tableau has already started using intelligent automation into the analytic process.
Natural Language Processing in the Form of Ask Data
Tableau provides natural language querying abilities through Ask Data, that provides users with an opportunity to ask any question like, “Show total sales by region for last quarter in the form of a bar chart,” and receive an instant dynamic visualization. The engine analyzes synonyms, identifies data types, translates ambiguous wording and suggests a few relevant follow up questions.
Explanation of Data through Automated Insights
Explain Data uses statistical models and Bayesian modeling in order to find the hidden causes of specific data points. When a user spots any unusual values or sudden changes in the data presented in the chart, by clicking Explain Data, it analyzes millions of possible variants from all underlying variables and produces visual explanations that define which combinations of data or hidden variables cause this anomaly.
Tableau Pulse and Metric-Centric Intelligence
"In Tableau's augmented intelligence development, Tableau Pulse plays a crucial role. This tool caters to busy decision-makers who may lack the skills necessary to handle more complex dashboards by offering automatic metric streams:
Guaranteed Reports Delivery: Important metrics get tracked and sent to users directly through email, corporate communication applications, or mobile devices.
Generative AI Summaries: Based on integrated enterprise generative AI models, Pulse provides a summary of metrics and shows what changes occurred, how they occurred and what trends need to be reacted on.
Uniform Metrics Definitions: Pulse works with performance metrics that are based on uniform business metrics, so that every department analyses its performance with the same interpretation of metrics."
Conclusion: Converting Data into Practical Wisdom
Today, throughout the difficult and unpredictable world economy, businesses produce countless amounts of data per second. However, data by itself has no value; it is simply waste until it is mastered, analyzed, and turned into decisive action.
The enduring gift of Tableau to the field of modern computing is the recognition of the fact that human perception comes first. By building a mathematical and cognitive bridge between complex database engines and the human perception system, Tableau moved business intelligence from an exclusive piece of engineering knowledge to a collaborative tool used to better understand the world.
Tableau constantly demonstrates how important it is for people to gain the ability to visualize data and obtain insights that can transform their operations, whether it is to improve global logistics or develop better health care processes. Those seeking to become data analyst professionals can greatly benefit from the comprehensive tableau courses online available to equip themselves with the skills.