
Top 10 Business Analytics Tools to Learn in 2026
Last updated on Oct 12, 2026
Business analytics have gone through a fundamental change in the present-day context. The time when organizations depended on unchanging spreadsheets and strictly monthly analytics is gone. At present, business analytics is a discipline that is dynamic, in real time, predictive, and driven by artificial intelligence.
The field of analytics is important for various sectors, such as fast-paced e-commerce companies, global supply chain networks, financial institutions, and quick-growing startups. Analytics professionals are in high demand in the corporate world, and their role is to analyze huge volumes of big data, process complex data sets, and make sense of all the numbers in order to gain strategic advantages.
The shift in the paradigm is caused by the development of AI technologies, NLG, and cloud-based data systems. In keeping with the advance of technologies, the software which solutions are needed to process, analyze, and visualize data underwent significant changes too. Therefore, being proficient in analytics tools is no longer regarded as an additional skill or a nice addition to one’s CV. Instead, it is known as a necessity for achieving stable business expansion, streamlining complicated operations, and developing high-level business planning strategy in a modern business environment.
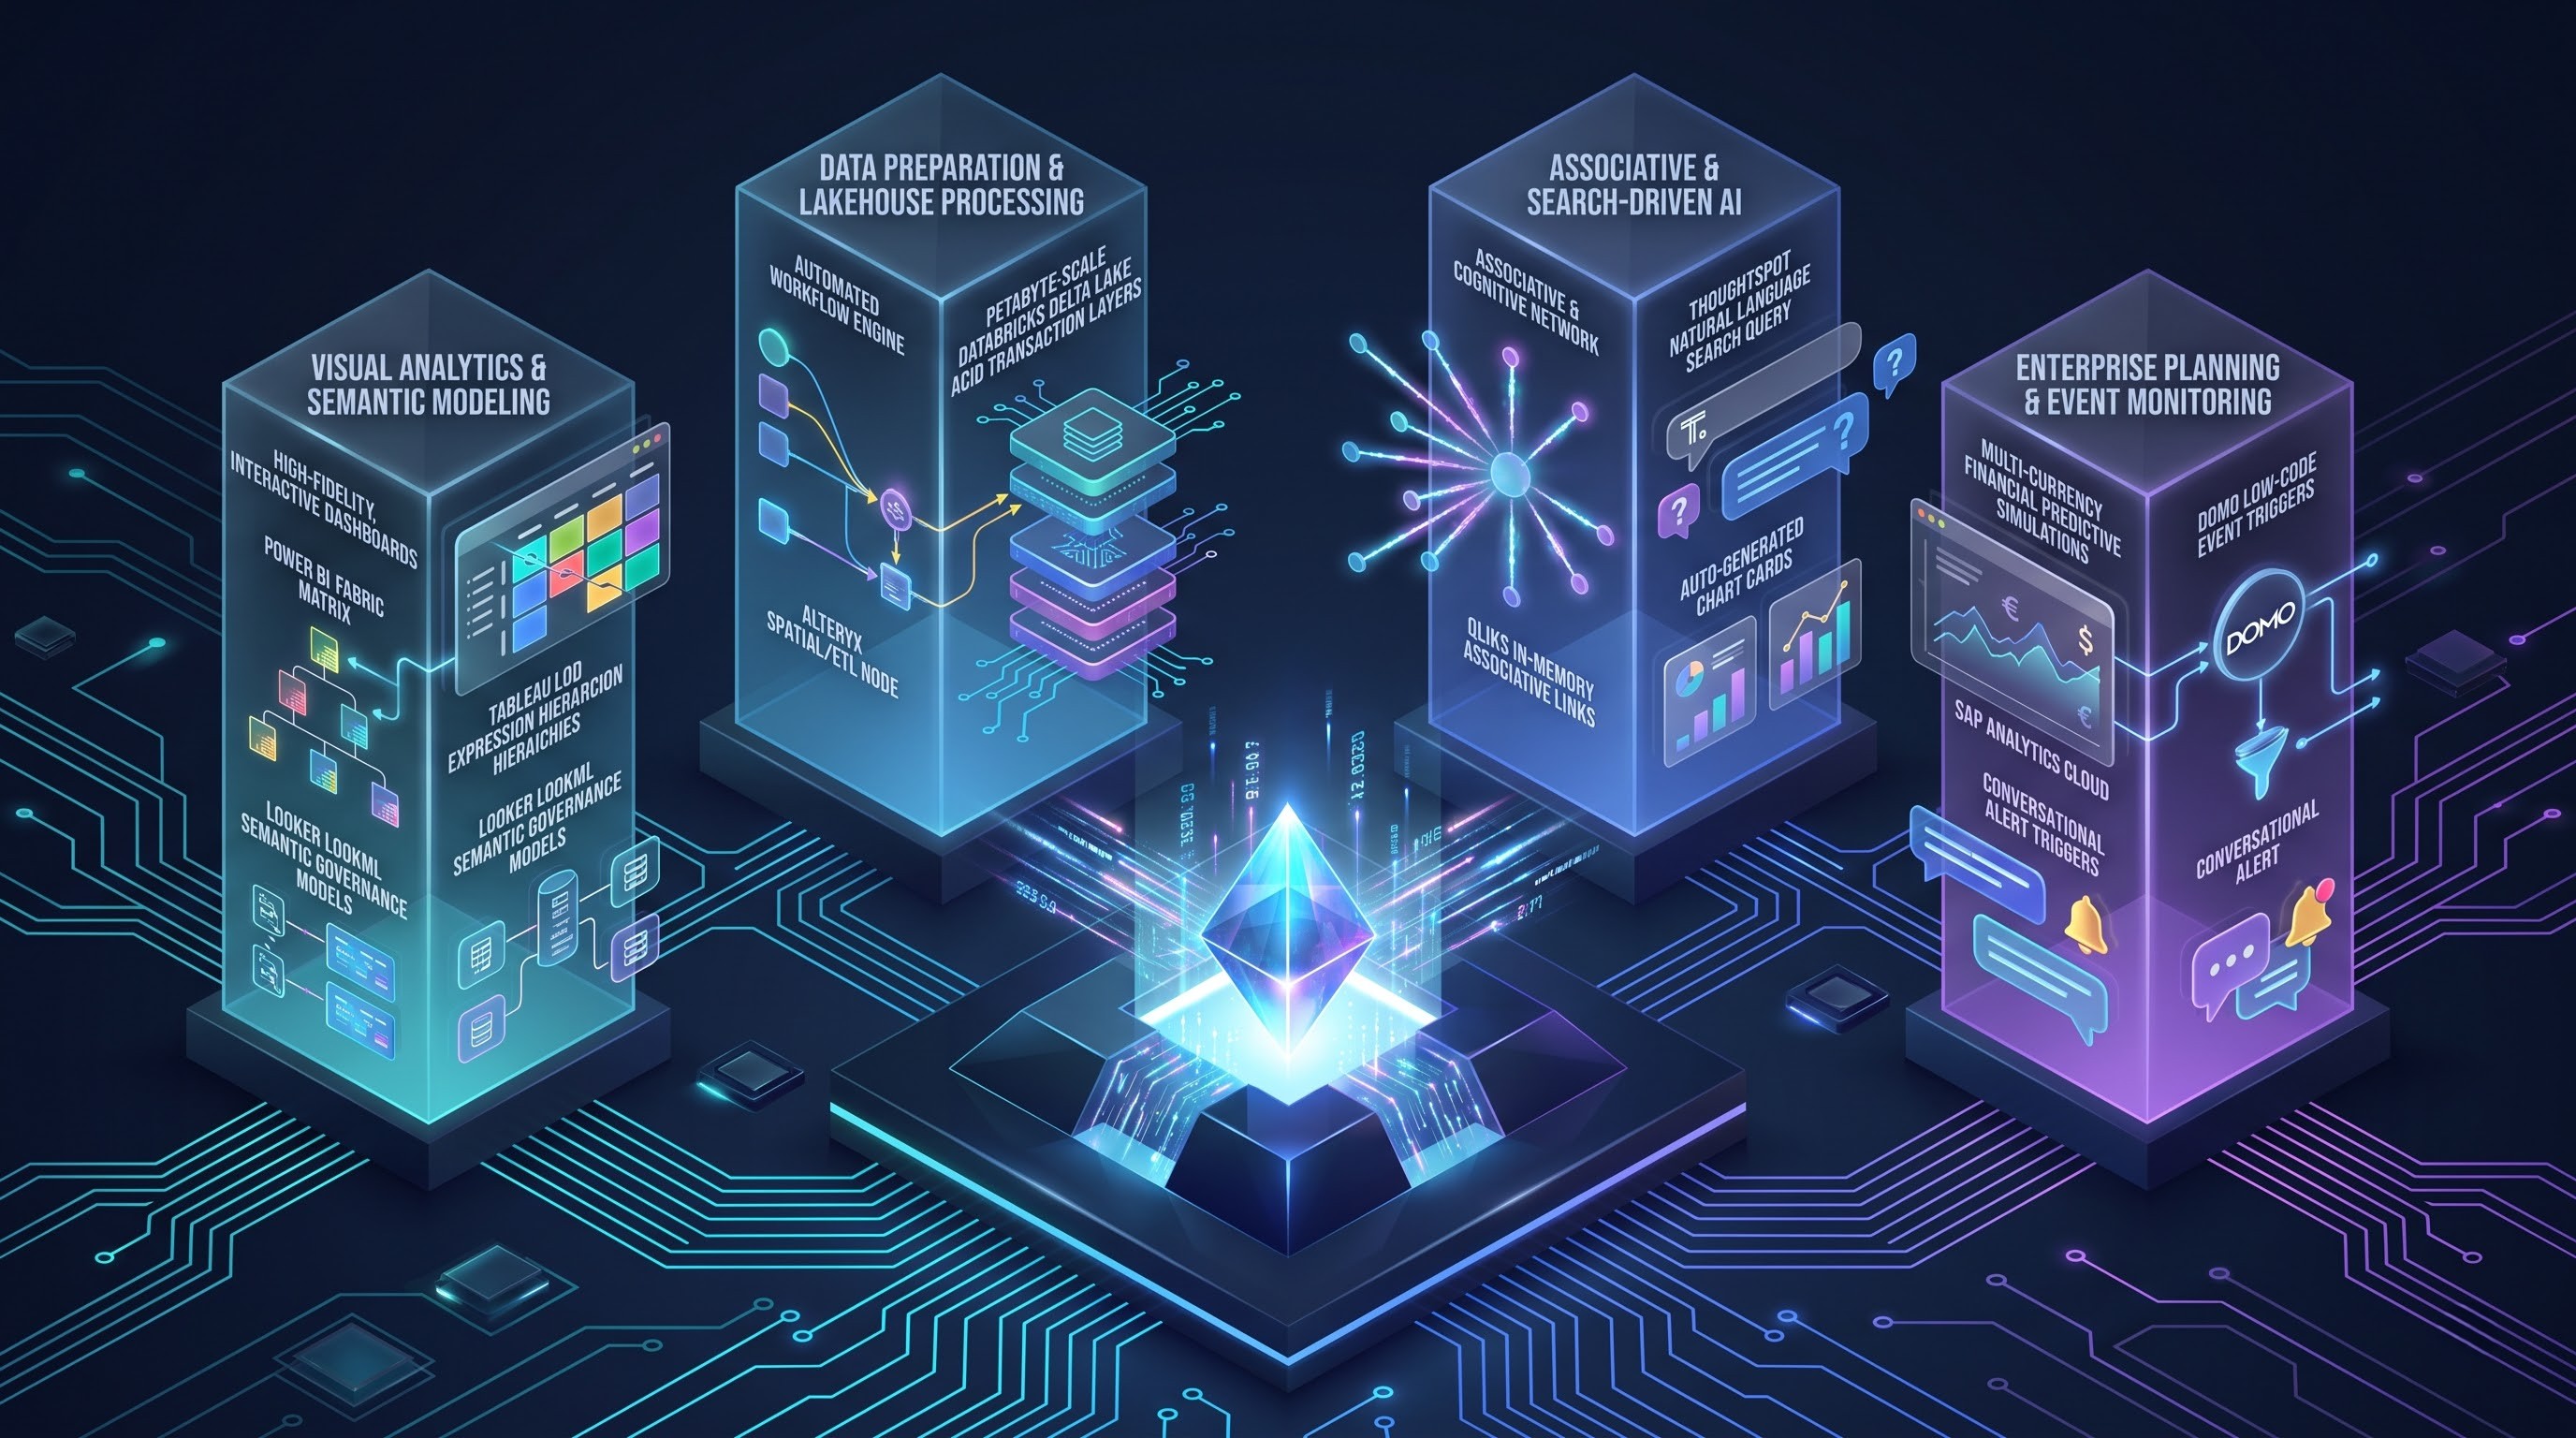
In order to keep up with changes, one needs to learn to work with advanced business intelligence tools. The following is the list of the best ten platforms for business analytics to learn and implement.
1. Microsoft Power BI
Power BI from the company Microsoft is one of the basic tools for many companies in the world, due to its good integration with Microsoft products such as Azure cloud technologies and the platform called Microsoft Fabric. The list of opportunities provided by Microsoft Power BI contains the connections with applied sources of data, reliable transformation processes using the internal query technology and the creation of dashboards which are full of interactivity and clear graphics.
Power BI includes the fact that it is easy to learn in practice. What is unique about Power BI is the balance between accessibility for beginners and the simplicity of professional analysts who are able to create meaningful reports and apply complicated models of work in no time. In addition, the artificial intelligence feature of Power BI simplifies the work of users, allowing them to receive the needed data with the help of ordinary spoken words.
Study of the Power BI Architecture and Usage in Enterprises
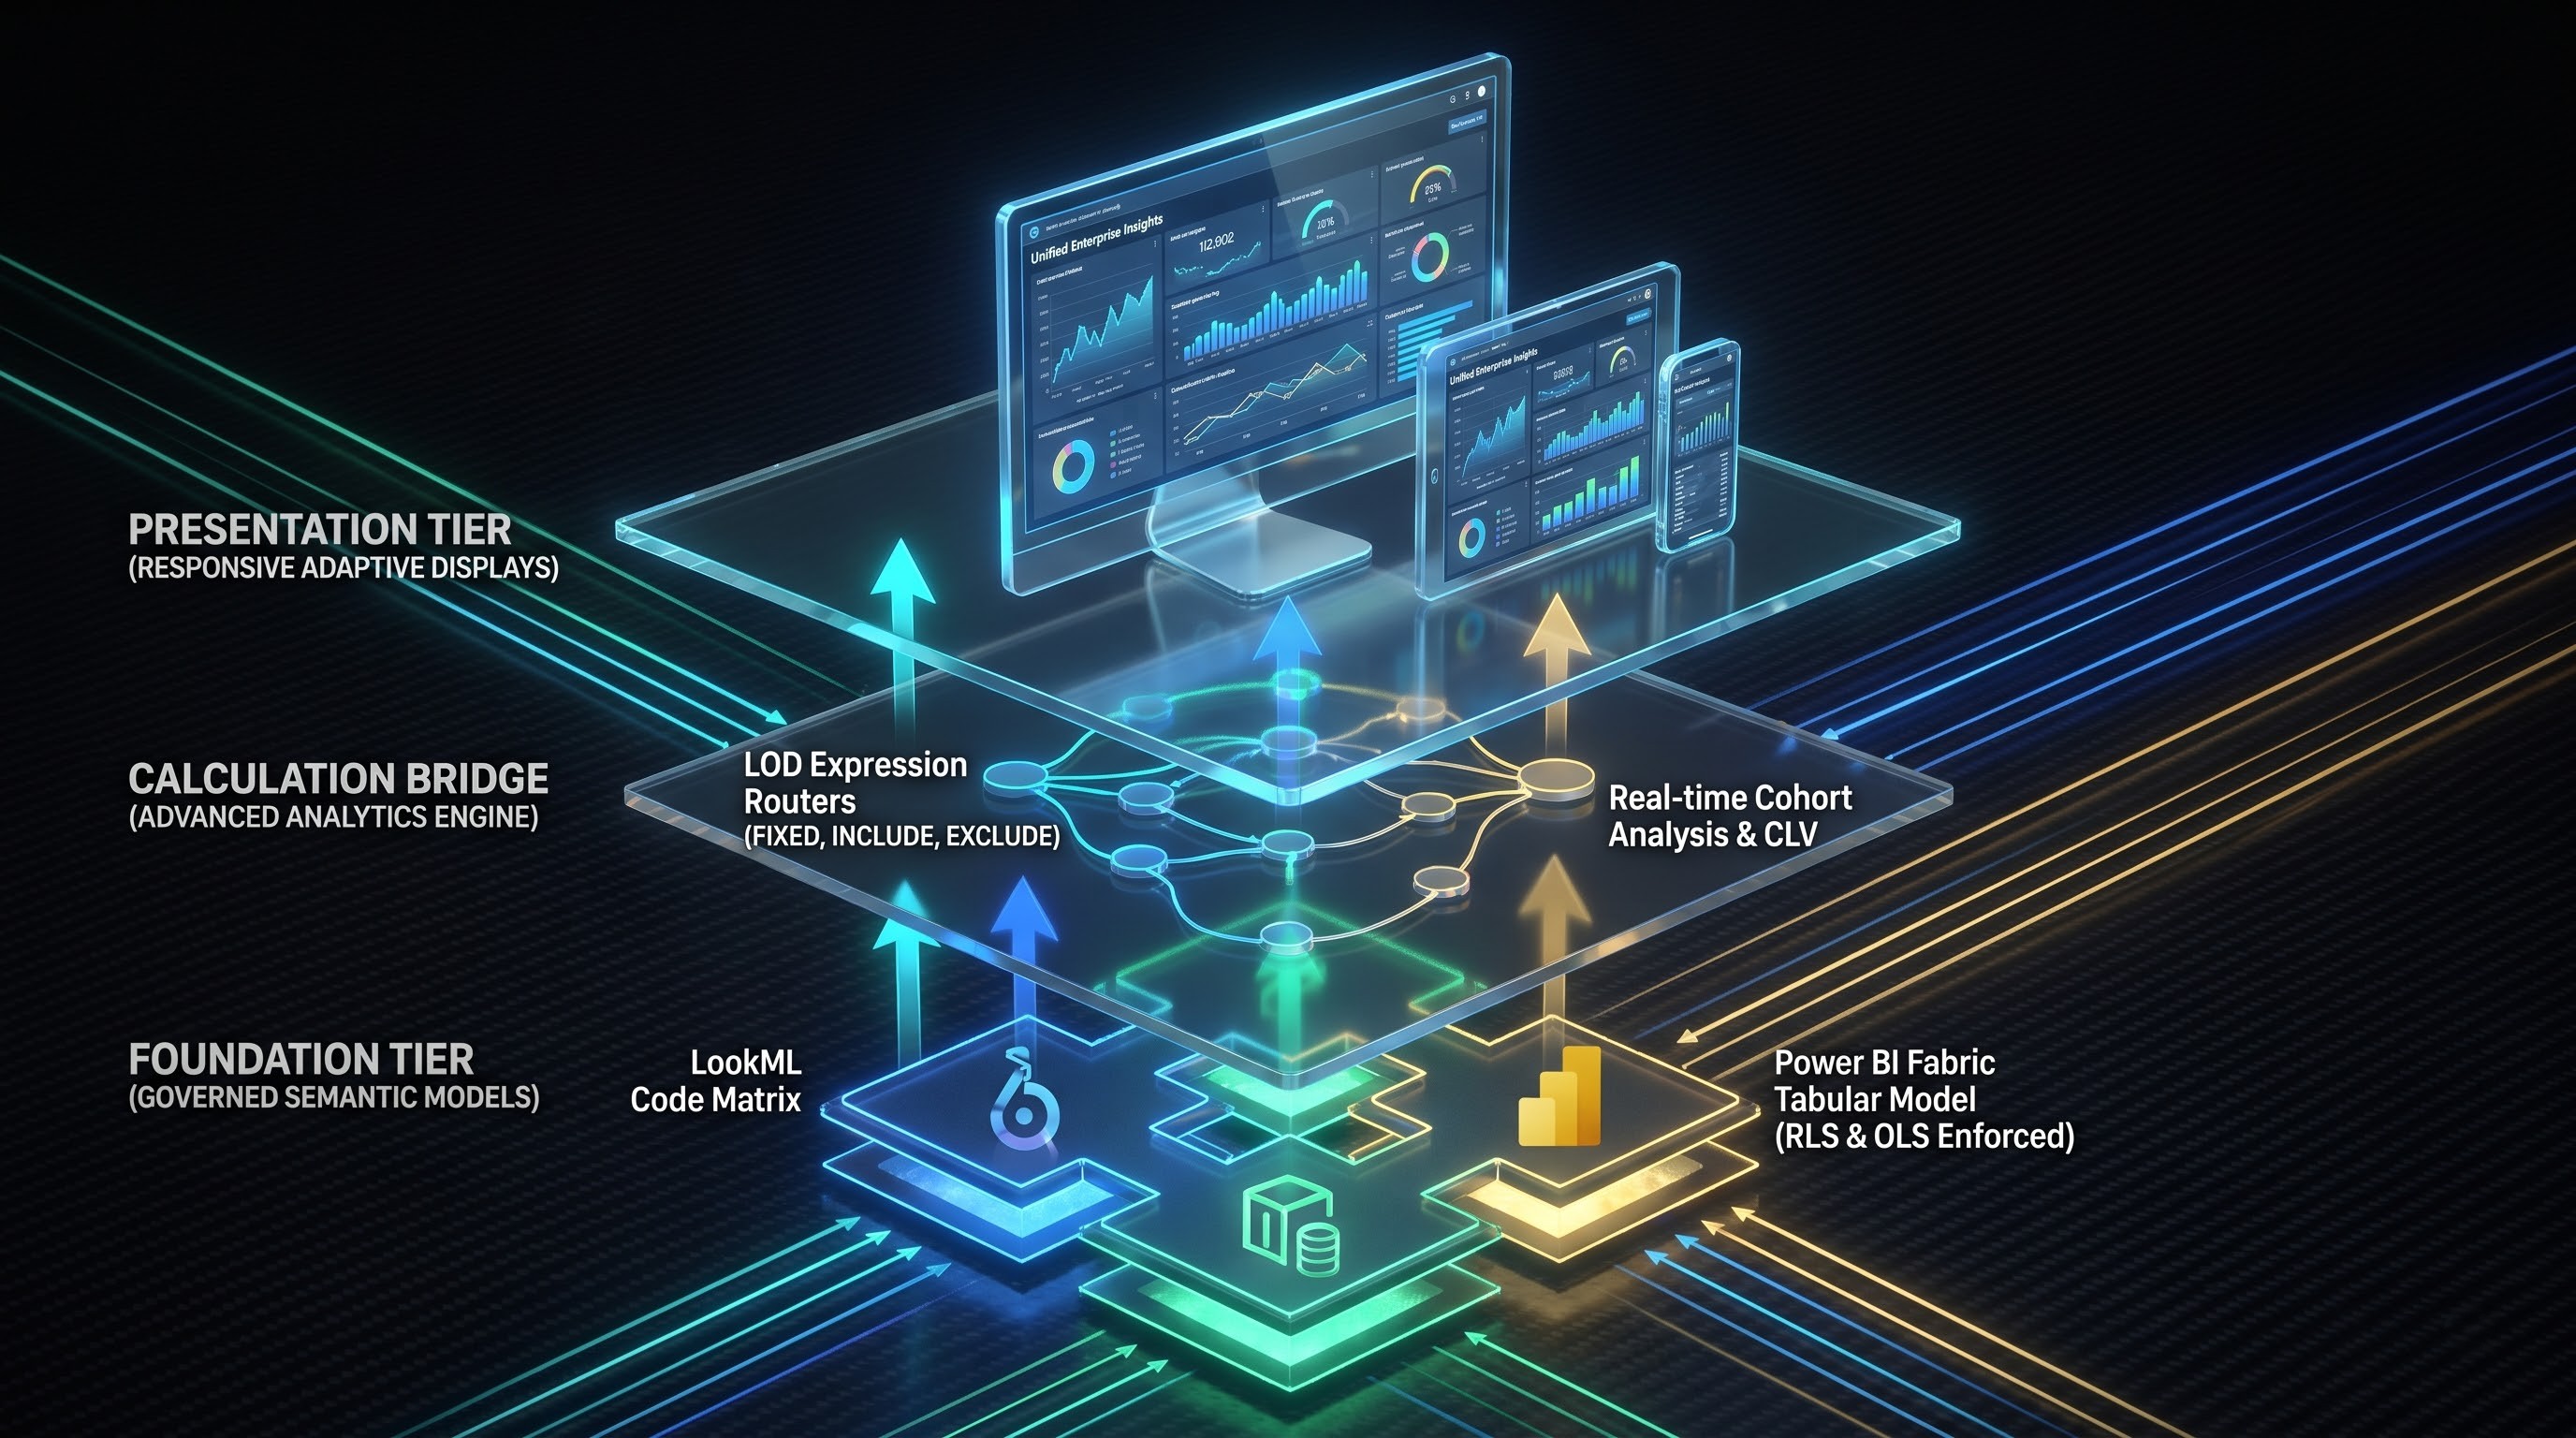
The acceptance of Power BI across organizations is primarily due to its ability to support various semantic layers that can be used in both self-service and centralized reporting approaches. In organizations, Power BI Premium is frequently used to provide enormous read-only workload processing that can be distributed for an unlimited number of users without affecting dataset refresh performance.
While working with Power BI, analysts must understand how different data storage models (Import, Direct Query, Composite) differ since these modes of storage allow reports weighing hundreds of gigabytes to maintain a high speed of query response. Moreover, Power BI services governance implies compliance with some rules and principles such as the use of row-level security (RLS) and object-level security (OLS) related to selling managers, heads of divisions, and board members to give them access only to the data tailored for them according to their organizational position.
2. Tableau
Tableau (part of the Salesforce ecosystem) continues to drive the standard for impactful data visualization and analytics storytelling. With its ability to simplify intricate datasets into easy-to-use, eye-catching formats, the Tableau platform lets analysts look for connections in data without the need for rigid structures.
Mastering Tableau gives analysts a crash course in human perception and data communication. Its structure supports flexible, adaptive dashboards that can move easily from offices to phones. Thanks to its many collaboration features, real-time data processing, and integration with customer relationship management systems, learning Tableau allows users to showcase findings that will inspire their audience to go from easy observers to decision-makers.
Understanding Visual Design Concepts and Data Layering in Tableau
The success of Tableau's calculation engine depends on the ability to use table calculations and Level of Detail (LOD) expressions in analyzing the results of the data. It is only through the use of such keywords as FIXED, INCLUDE, and EXCLUDE that the professionals can effectively accomplish the task of cohort analysis, customer lifetime value computation, and market basket analysis.
Besides, the integration of Tableau Cloud with the enterprise CRM instances allows for the simultaneous working of such things as the sales pipeline, ticket volumes of customer service queries, and the marketing attribution models for campaigns. The organizations that rely on the usage of Tableau usually develop centralized processes of server governance, which means that the sources of data published serve as the only source of truth, and this makes separate departments eliminate the problems of reporting silos.
3. Google Looker Studio and Looker
Google’s analytic suite composed of Looker Studio and Looker provides the organizations that operate mostly in the cloud with the best conditions for operations. Looker provides for integrating data across different cloud warehouses, marketing platforms, and different operational databases into one governed semantic layer.
The ability to use Looker applications is critical for businesses centered on digital information, marketing analysis teams, and companies building their data environment on major cloud platforms. Looker makes it possible for all departments to base their work on the same data source by securing the fact that metrics are created in a centralized manner.
Using LookML for Controlled Semantic Modelling
What distinguishes Looker from other reporting platforms is the use of LookML (Looker Modelling Language) which is an accessible programming language that allows builders to create dimensions, calculations, and relations. Unlike standard BI tools which repeat calculations in each report, LookML centralizes business logic. Once the firm changes the data of net profit, this change will be applied to all downstream reports processing.
Looker Studio acts as a fast solution for easy creating dashboards for digital marketing and online analytics. Combined with modern data storage solutions, it becomes a cheap and highly adaptable reporting tool suitable for digital agencies, e-commerce managers and other teams willing to use such a fast solution without heavy investments into IT infrastructures.
4. Qlik Sense
Qlik Sense is unique in its use of an associative data model. Traditional querying systems are based on set hierarchical structures to analyze data, whereas the Qlik engine defines all possible relationships among data points in a given dataset. Whenever the user selects data or filters the dimension, the entire dashboard is immediately recalibrated.
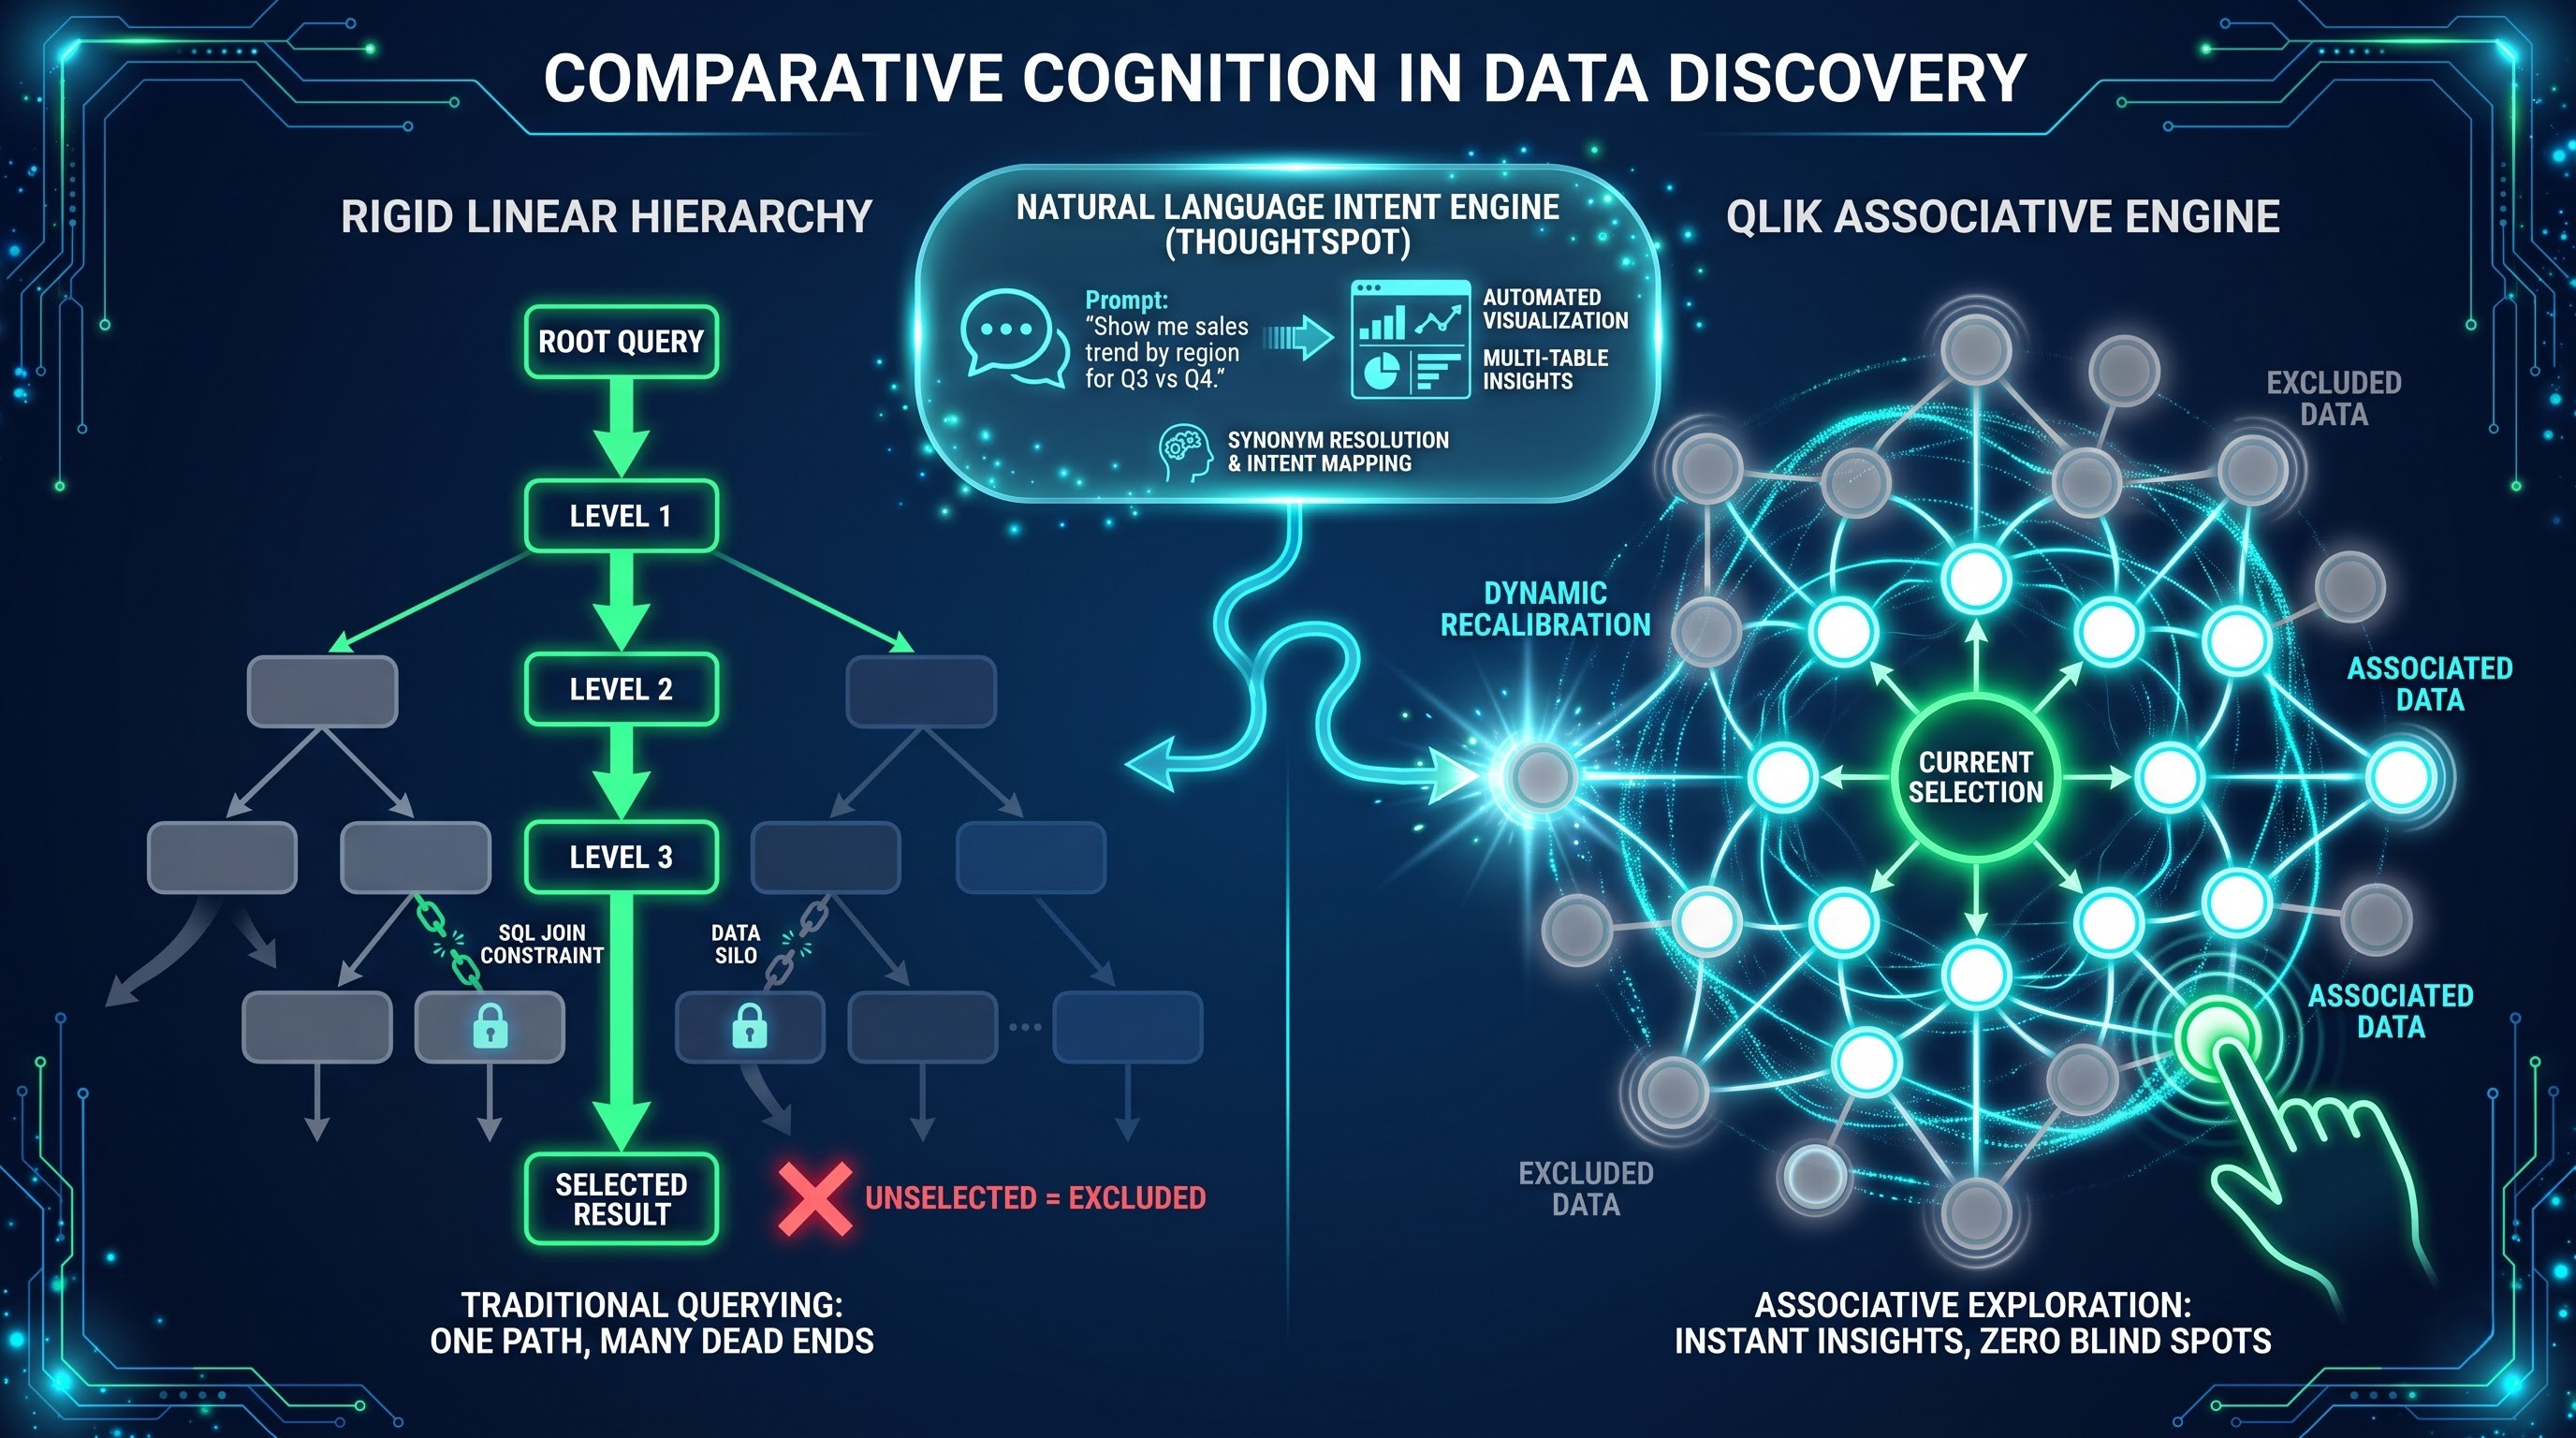
By learning Qlik Sense, an analyst learns a new way of thinking about data. The cognitive engine and AI-based insight advisor of Qlik Sense highlight the hidden patterns and relationships, which could be missed by linear dashboards. It is widely acknowledged that it is a great self-service analytics tool for end-users.
The Power of Associative Exploration and In-Memory Analytics
The associative engine of Qlik enables data to be compressed into RAM, providing speedy response time even for millions of rows in complex many-to-many relationships. This means that analysts need to learn the color-coding system in Qlik for identifying and understanding different values from selections to associations, as the system automatically signals these.
This ability of Qlik comes in handy especially in the situations occurring in supply chain or retail organizations. For example, when an analyst filters for delayed shipments in a certain area, Qlik shows which supplier types, transport ways and fulfillment locations are associated with these delays, thus helping the analyst identify the reasons that can be invisible in case of using only traditional SQL joins.
5. Alteryx
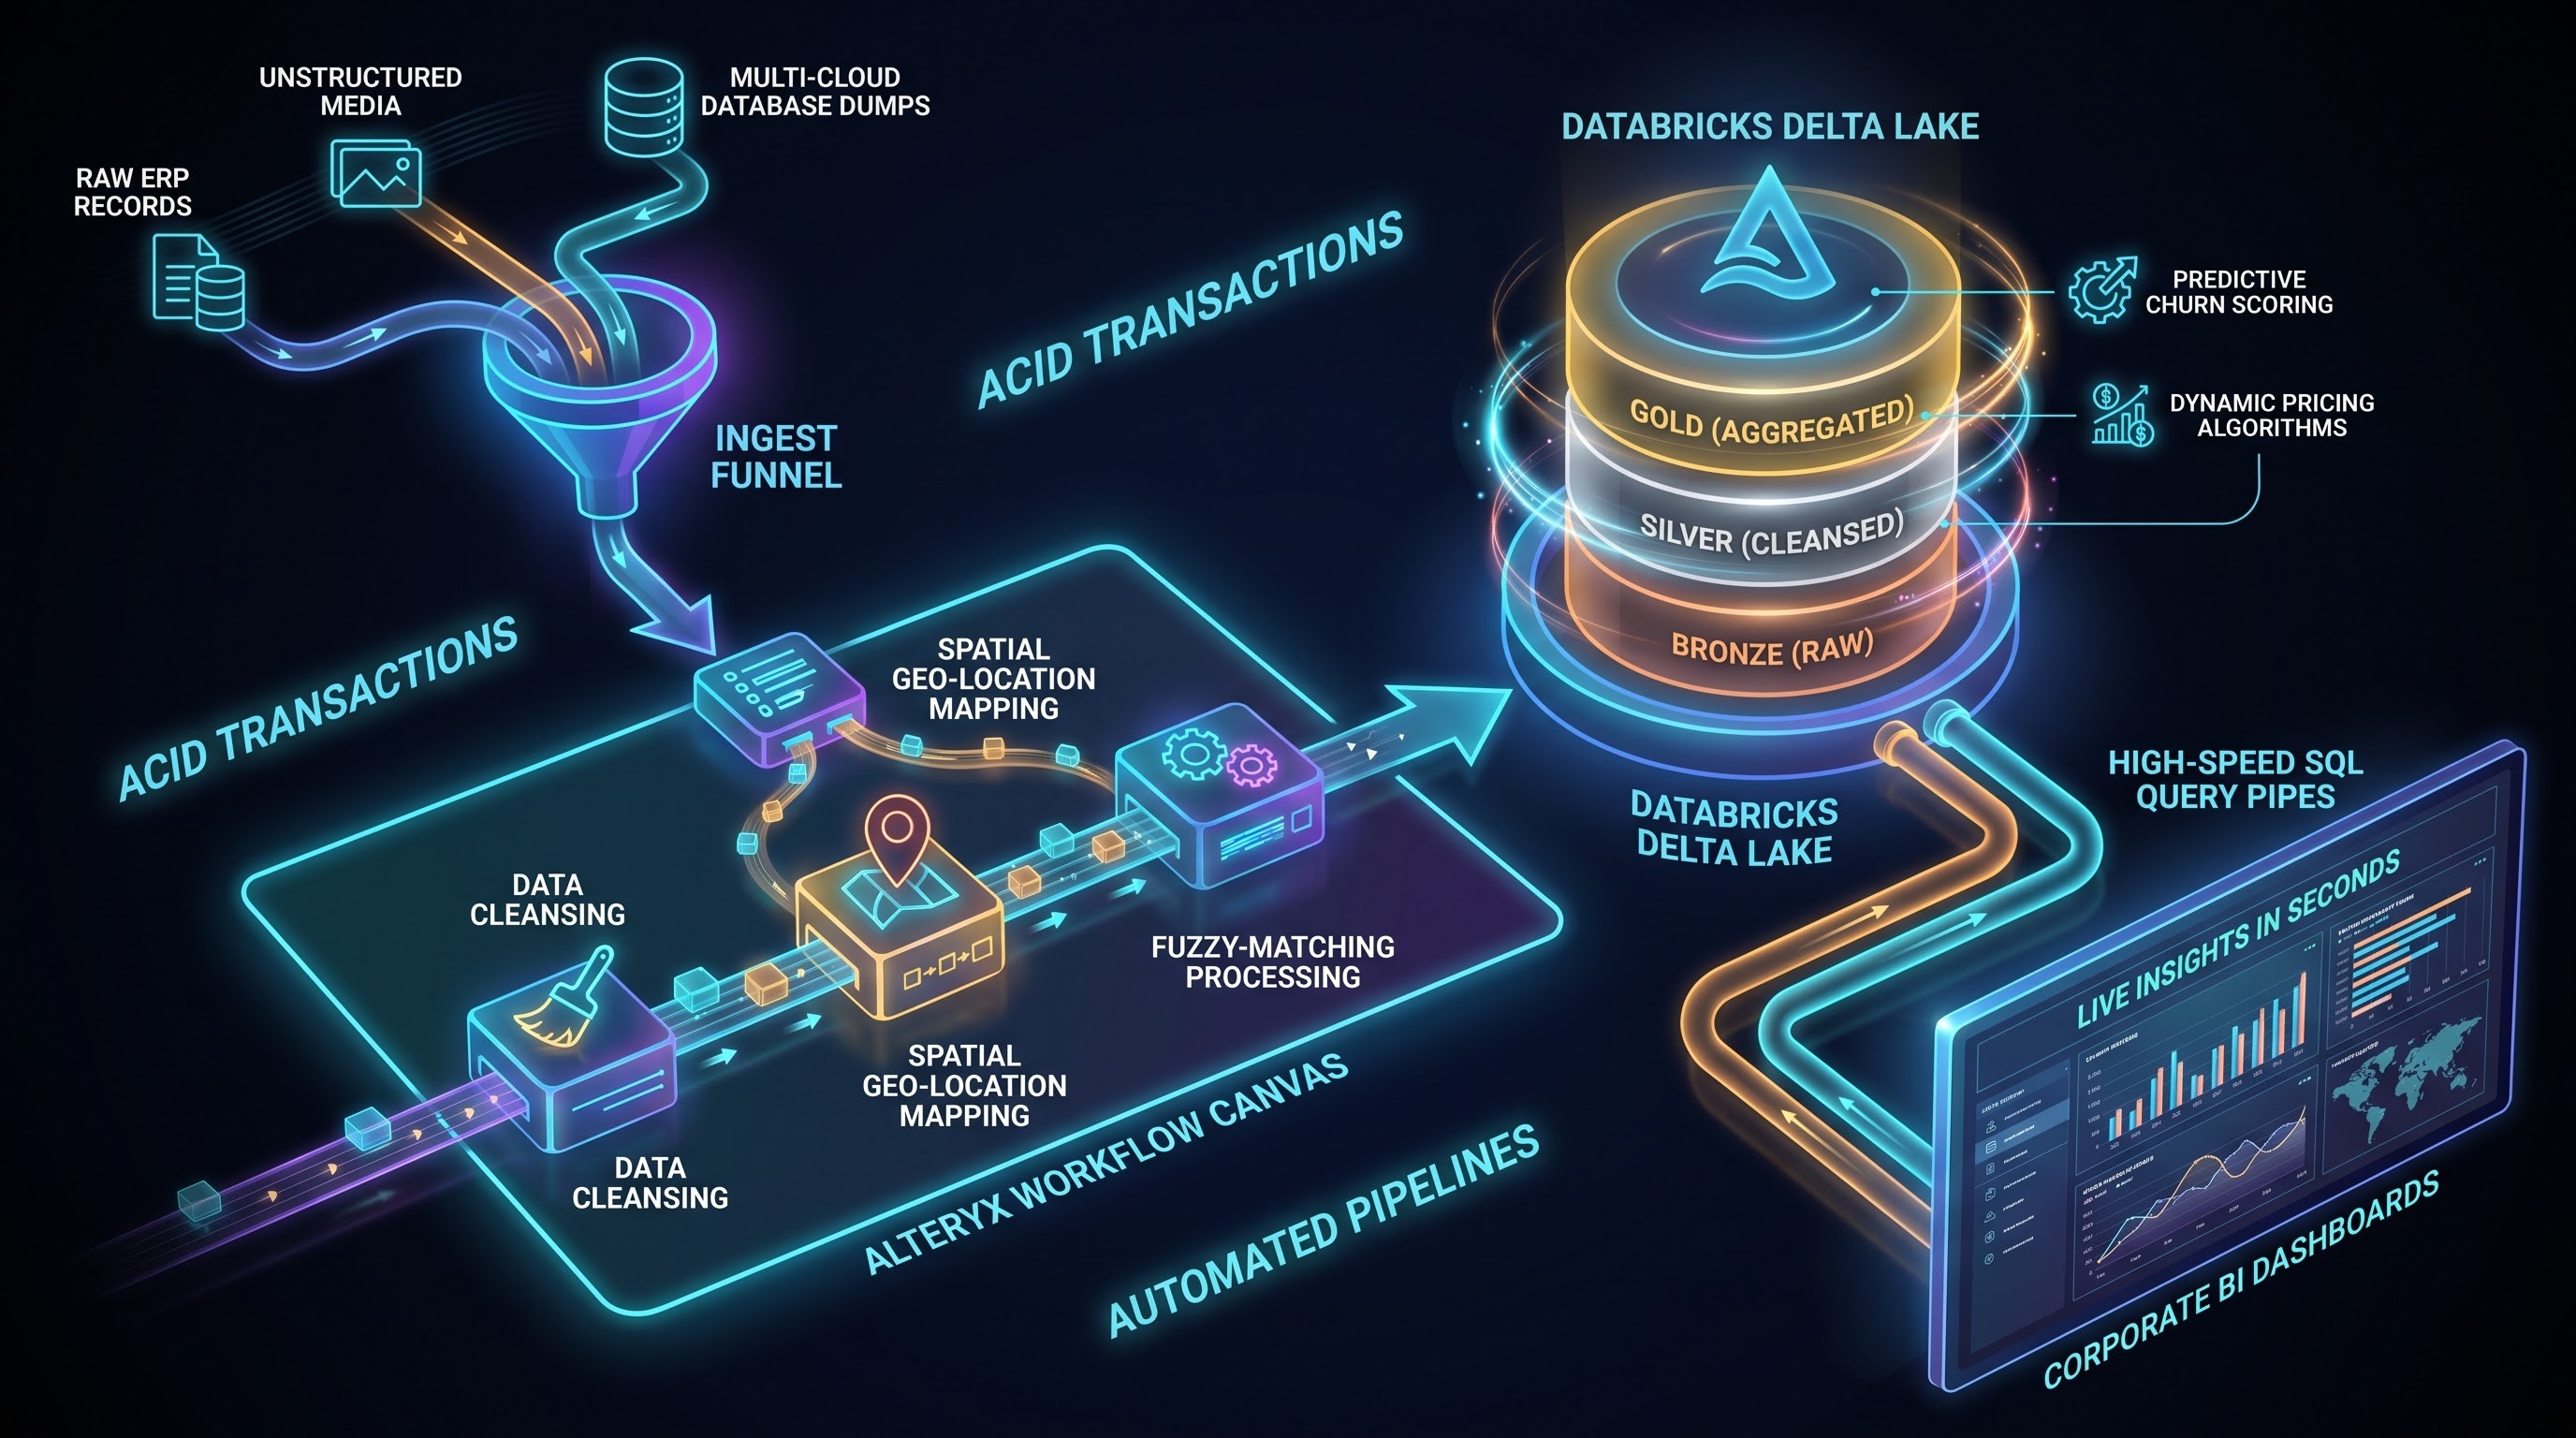
Alteryx has turned from a simple tool for combining data into a whole automation platform for analytics purposes. For business analysts, Alteryx becomes a perfect solution for the situation when they have to spend many hours cleaning, connecting and preparing unorganized data before the analysis is possible.
Utilizing Alteryx improves business operations tremendously. Instead of having to manage spreadsheets manually, analysts can work with repeatable workflow methods. They can, for instance, easily use and combine data derived from databases, cloud technologies, and location information sources. This process is facilitated by the AI capabilities of Alteryx.
Workflow Development and Data Analysis Using Alteryx
The Alteryx Designer is based on a workflow where databases, input, conversion, and output tasks can be arranged in order of need. By using Alteryx, analysts may process information coming from enterprise resources or unstructured media and process them easily, i.e. standardizing the way the input information will be presented and even matching client names in the process.
In addition to processing the data, Alteryx allows the users to optimize their operations and to develop predictive analytics. For instance, logistics managers can effectively use this tool to define the best warehouse locations and evaluate their delivery capabilities. Thus, the companies have managed to decrease operational costs thanks to the software.
6. Databricks (AI/BI and Lakehouse Analytics)
With the shift of modern businesses from traditional warehousing to lakehouse architecture, Databricks has become a significant platform for big data engineering, large-scale machine learning, and BI. Its integrated platform features data engineering tools, collaborative notebooks, and SQL analytics for businesses, which makes Databricks a complete solution.
Once business analysts learn to use Databrick, they will be able to work with enormous mass data sets on the level of petabytes, which cannot be processed using ordinary desktop.
Databricks: Integration of Data Science and Business Intelligence in Lakehouse
Databricks effectively combines data lakes and data warehouses through Delta Lake technology, which provides high-grade caching, ACID transactions, and data versioning. This way, Databrick solves the historical issue of interaction among business analysts, data scientists, and data engineers.
It is possible for individuals to utilize Databricks SQL and AI/BI natural language interfaces for querying petabyte-scale datasets directly by using standard SQL syntax or through conversational prompts. With this opportunity, organizations are capable of implementing machine learning inference pipelines, which include the customer churn prediction scores and dynamic pricing algorithms, and obtain results immediately in their executive dashboards.
7. Zoho Analytics
Zoho Analytics offers a solid combination of powerful enterprise intelligence and simplicity for small-to-medium-sized businesses. It presents comprehensive self-service options, letting the users obtain the data from several business applications, CRM solutions, and financial software applications and integrate them into one interface.
Learning how to use Zoho Analytics is especially useful in environments where speed and scalable costs matter. The software comes with efficient data preparation pipelines, automatic reports creation, and help provided by conversational AI tools allowing for typing plain questions to get instant answers in the form of charts.
Unified Business Operations and Conversational AI Integration
Zoho Analytics offers a seamless integration experience with a wide range of well-known business applications. Its in-built connectivity features require little or no data transformation for the users' data projects.
The conversational AI tool, Zia, allows users to access their data in common language without having to rely on technical resources. An operations person could ask about the trends in regional sales or how many tickets are in backlog and get an instant visual representation of their results, making information available for small businesses without having to rely on data specialists.
8. Domo
Domo positions itself as a one-stop cloud solution that offers instant access to business processes. Instead of only being based on stagnant reports, Domo creates a secured connection to users’ operations, starting from production and ending at supply chains in order to guarantee constant knowledge of the company situation.
Mastering Domo empowers professionals in making fully-integrated, mobile-first dashboards that can initiate actions based on live data records. There are numerous cloud connectors and data transformation tools that Domo holds to allow professionals to step away from looking back and start event monitoring and management.
Proactive event-driven monitoring and app development
Domo stands out from others because of integrating classic business intelligence with low-code app creation. Companies will be able to create customized data apps based on their analytical models.
Moreover, Domo has built an all-time-working alerting mechanism that helps control live data streams. If the stock level is below certain numbers or delivery is longer than expected, the system generates automated messages through webhooks or SMS, thus switching the organization from being reactive to proactive.
9. ThoughtSpot
ThoughtSpot has established itself as a leader in search-driven and AI-based analytics solutions. Built on the foundation of a consumer-friendly search engine, ThoughtSpot enables business users to perform complex searches by simply entering terms like "Provide me with regional sales variance by product line in the previous quarter" and generate real-time, interactive visual representations of the data.
Learning how to use ThoughtSpot changes an analyst's role from that of a reporting professional to that of a data facilitator. By concentrating on creating clean, properly governed semantic models, analysts give companies the capability to do data exploration on their own.
AI-Enabled Discoveries with Consumer-Friendly Search
The unique search engine provided by ThoughtSpot enables immediate interpretation of complicated search phrases in natural language against substantial relational databases, ensuring relevant visual representations of the generated data without making users go through complex reporting systems.
For analytics professionals, the process of using ThoughtSpot requires the creation of a true worksheet, the establishing of security settings, and the creation of a complete synonym file to make sure that users’ conversational terms match their database schemas. This way, the number of ad-hoc reporting requests sent to IT departments decreases, and the business units now can find answers to their operational queries quickly.
10. SAP Analytics Cloud
SAP Analytics Cloud takes advantage of business intelligence software, predictive planning, and business planning system, resulting in one unique SaaS technology solution. SAP Analytics Cloud is the right solution for corporate professionals who are involved in complicated multinational ERP systems since SAP Analytics Cloud is a solution for consolidation and strategic forecasting.
From Enterprise Business Planning to Financial Consolidation and Predictive Simulation
SAP Analytics Cloud combines the features of business intelligence reporting with powerful business planning and predictive simulation capabilities. Financial analysts rely on the functionality of the program's powerful planning engines to prepare simple budgets based on available data, accomplish top-down forecasting, and simulate complex currency conversion processes between subsidiaries around the world.
The predictive scenarios utilize the capabilities granted through machine learning to perform cash flow forecasting, identify cost deviations, and detect variance risks in advance of their reflection in quarterly financial statements. Its good connectivity with the enterprise resource planning systems guarantees the correctness of data used to carry out the financial closing and for executing the undertaking of strategic planning.
Conclusion: Instructional Materials
The technological evolution the business analytics sphere will undergo in 2026 shows the final departure from simple static reporting to advanced AI-based enterprise intelligence based on real-time technologies that can deliver deep insights to every required field, from international supply chains to financial institutions and flexibility of e-commerce to startups.
In order to prepare oneself for a successful career in the world of data, one must clearly understand the data life cycle. For those wanting to gain advanced skills quickly, taking specialized business analyst classes online is a good option.
The design of the learning path should be well defined and organized in intervals. The beginners can commence by getting hold of visualization tools such as Power BI or Tableau through a detailed ba analyst course that helps break down complicated data handling into small and achievable steps. The most important aspect of data reporting is the ability to deliver the results in a very clear and easy way, thus enabling people to make their reports interactive using such platforms as Power BI, Tableau, or other similar software. Once these primary requirements have been met, people can usually move on to learning special data automation tools that help them get rid of manual work and save time working with unorganized data.
As professionals reach higher positions or narrow their focus, their familiarity with the semantic layers of cloud computing and big data environments becomes pivotal. A knowledge of tools such as Google Looker, Qlik Sense, Domo, and SAP Analytics Cloud enables analysts to work with enormous sets of corporate data, meet tight row-level security requirements, and create predictive simulation models. Moreover, being able to stay up to date in today’s technological world means adopting AI-enabled natural language queries and automated anomaly detection, making it possible for the company to move from retrospective analysis to proactive event-based interventions.
In the end, the obvious sign of a first-class business analyst is that they combine sound technical expertise with a good sense of business. While technology provides computing power, it will have no effect without human insight, sharp questioning skills, and an understanding of the context.
At its core, what defines a great business analyst is their ability to marry relevant technical skills with business acumen. If you are determined to draw lessons from the data you collect in order to influence company policy, taking business analyst classes will help you acquire required practical skills for making a mark in the competitive business environment.