
What Happens When AI Becomes Your BI Analyst?
Last updated on Aug 11, 2026

From Dashboards and DAX to Copilot, Semantic Models, and Decision-Ready Insights
A regional sales VP opens her Monday morning dashboard. Total revenue in the Western division is down 14% month-over-month. The visual is clear: a dark red card highlights the variance, and a trending line chart slants downward.
She stares at the screen, clicks a drop-down slicer for product categories, filters by customer segment, and cross-highlights across two visuals. After ten minutes of manual navigation, she uncovers that the drop comes primarily from mid-market software renewals in the Pacific Northwest. But to understand why those specific renewals dropped—whether due to delayed contract approvals, competitive churn, or pricing tier changes—she opens her email and drafts a message to the senior business intelligence (BI) analyst:
“Can you pull the underlying data and run a breakdown on the Western renewal lag by sales rep?”
This scene plays out thousands of times every day across global enterprises. For over two decades, business intelligence has operated on a dashboard-first paradigm. Data teams ingest raw tables, build relationships, write DAX or SQL expressions, and design polished visual reports. Yet, when a decision-maker interacts with that dashboard, the visual usually answers only the first question: what happened? The subsequent questions—why did it happen, and what should we do next?—invariably send the user running back to a human analyst for custom investigation.
Now, generative AI and conversational agents are entering this workflow. Rather than clicking through static visual slicers, business users are typing plain-English prompts directly into conversational interfaces like Copilot in Power BI:
“Why did Western revenue drop last month, and which accounts caused the variance?”
This shift raises a fundamental question for data leaders, software architects, and career analytics professionals alike: What happens when AI becomes your BI analyst?
For professionals building their Power BI skills, even a power bi certification is becoming less about simply learning how to create dashboards and more about understanding the data models, calculations, and business logic that sit behind AI-assisted analysis.
Does AI render Power BI obsolete? Or does it fundamentally elevate the platform’s importance, transforming Power BI from a report-building tool into the semantic intelligence engine that makes conversational AI reliable?
The answer lies in understanding that AI does not replace BI—it depends on it.
The Dashboard Was Never the Final Destination
Traditional business intelligence was built around a specific visual delivery model:
This traditional workflow brought immense order to enterprise data. By consolidating disparate transactional databases into star schemas and centralized reporting layers, tools like Power BI enabled organizations to establish a single source of truth. However, visual dashboards harbor an inherent structural limitation: they are fixed responses to anticipated questions.
When an analyst designs a report, they must predict what the executive will need to see. They pick the bar charts, choose the filter panes, and program the cross-filtering behaviors. If the executive’s line of questioning strays outside those pre-built paths, the dashboard becomes a dead end. The executive takes a screenshot, pastes it into an email, and requests a custom ad-hoc query. The analyst’s time is then spent re-filtering data, exporting to spreadsheets, and building secondary slides
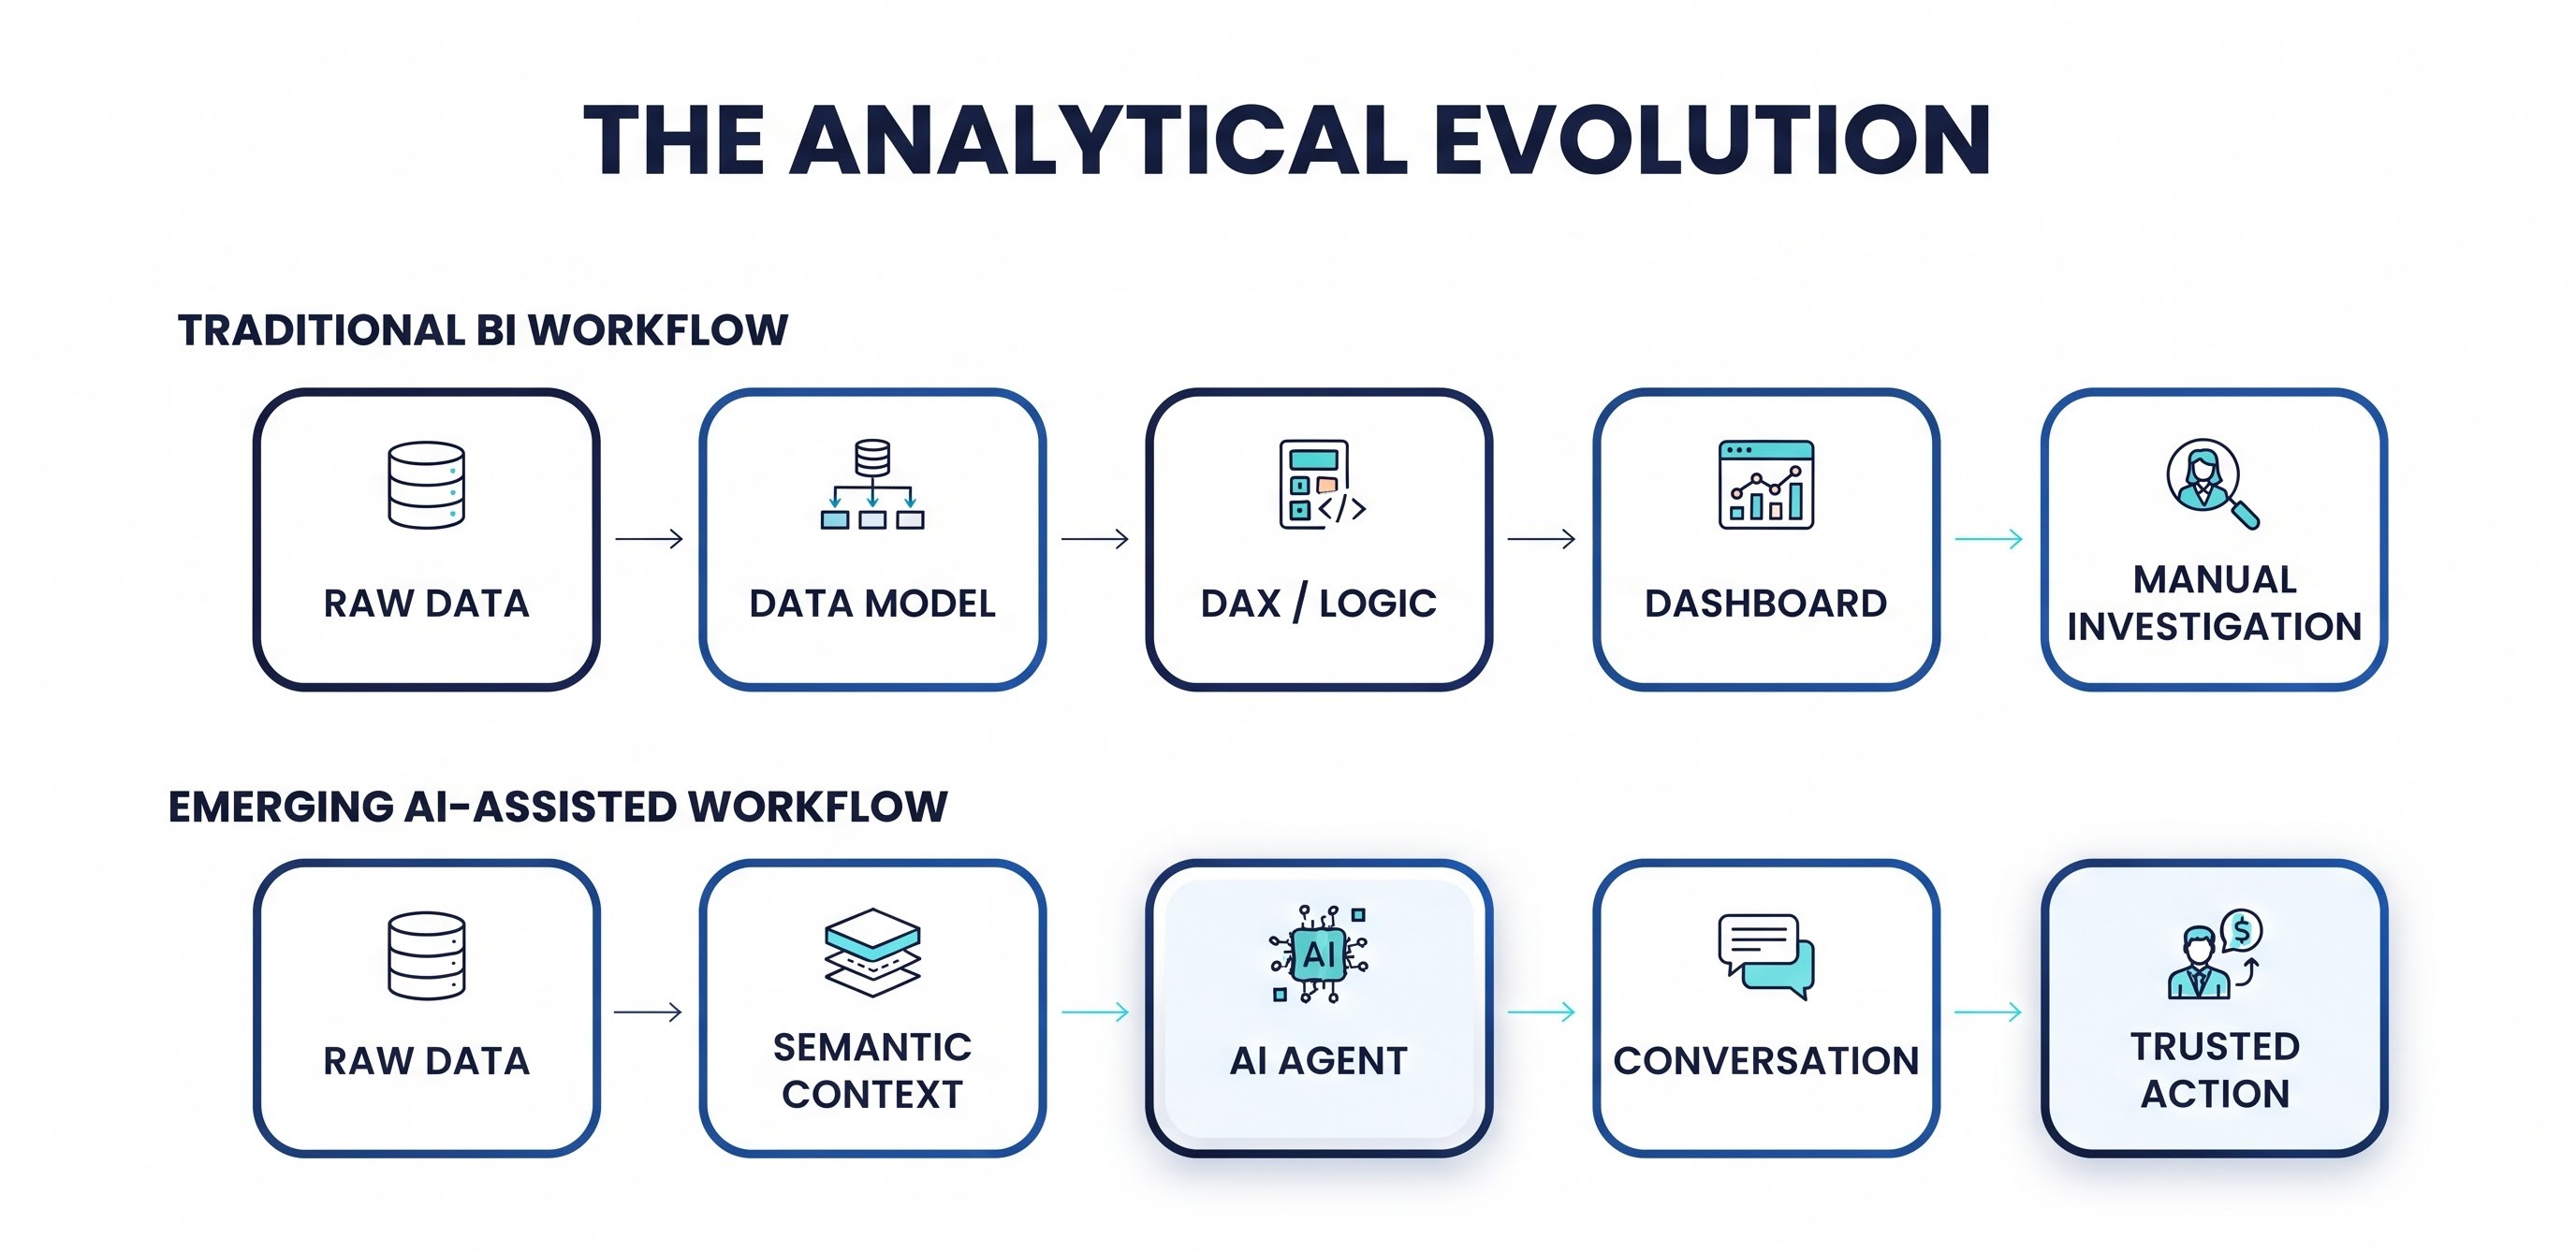
The emerging AI-assisted BI model changes where human effort is spent:
Crucially, this emerging workflow does not render the traditional data model obsolete. Instead, it exposes how vital that data model actually is. An AI model cannot intelligently analyze data it does not understand. Without precise semantic boundaries, business definitions, and explicit relationships, a conversational agent attempting to answer a business question is merely guessing.
The Semantic Foundation: Why AI Hallucinates Without BI
To understand why Microsoft Power BI is becoming more central—not less—in an
AI-driven environment, one must understand how Large Language Models (LLMs) interact with enterprise data.
An LLM is exceptionally skilled at understanding human language, sentiment, and context. However, an LLM possesses zero inherent knowledge of your company’s specific business logic. It does not know whether your fiscal year starts in January or April. It does not know if "revenue" means gross booked ARR, net collected cash, or recognized revenue under ASC 606 standards. Consider a deceptively simple question posed by a CFO to a conversational AI:
“What was our profit margin in Q2?”
To a human who hasn't worked in the company's finance department, this sounds straightforward. To a database, it is an ambiguous puzzle requiring dozens of structural decisions:
Which table holds authoritative sales figures vs. preliminary invoices?
Does "profit" refer to Gross Profit, Operating Margin, or EBITDA?
Are returned goods and operational discounts subtracted at the row level or calculated as an end-of-quarter adjustment?
Does "Q2" refer to the calendar quarter ending in June or the corporate fiscal quarter ending in August?
Which currency exchange rate table applies to overseas transactions?
If you pass raw, unmodeled database tables directly to an AI agent, it will fabricate an answer. It might write a SQL query that sums a column named amount from an unverified table, picking up test records, cancelled orders, and intra-company transfers. The answer will be delivered instantly, with absolute conversational confidence and it will be wrong.
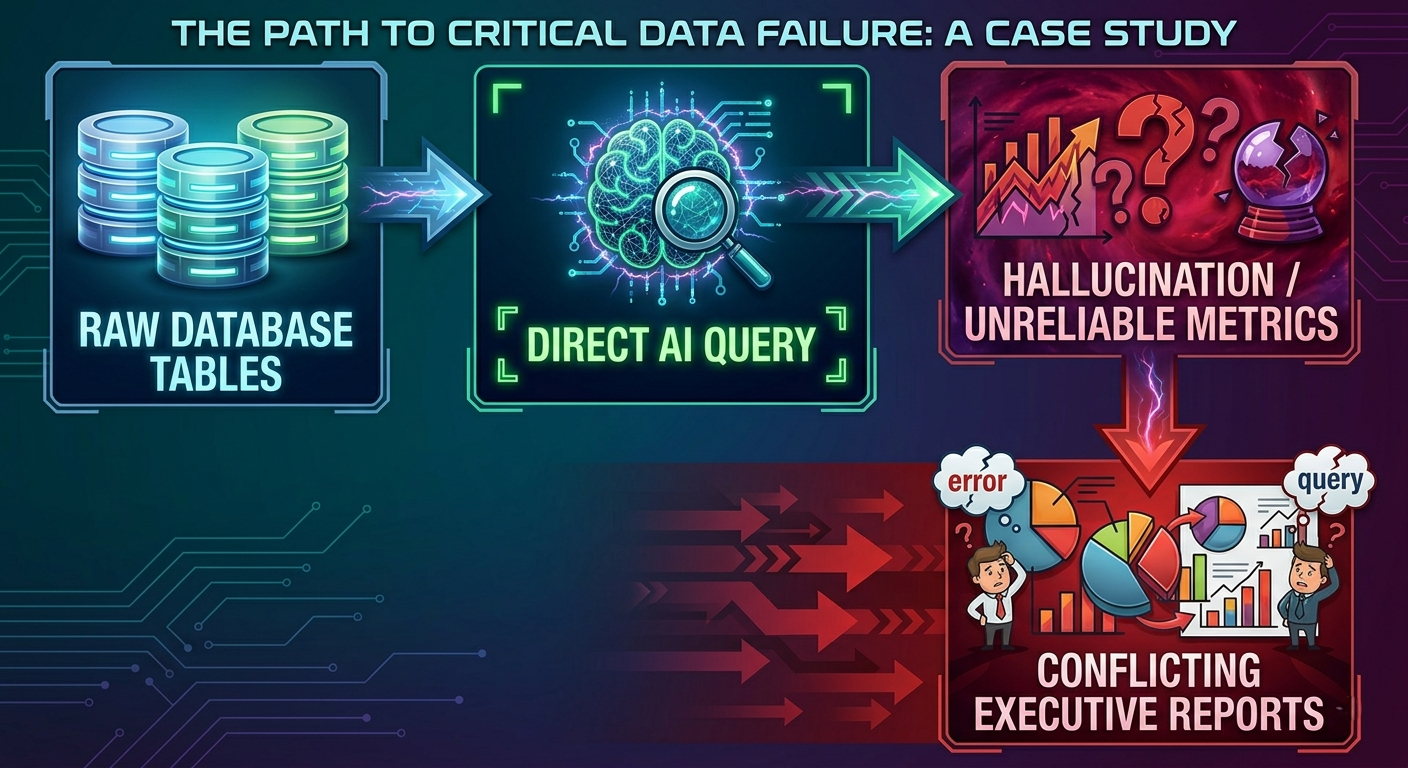
This is where the Power BI semantic model becomes the ultimate safeguard.
A semantic model is much more than a collection of tables. It is an enterprise translation layer. It contains defined star-schema relationships, explicit DAX measures, explicit date tables, field descriptions, synonyms, and hierarchical security rules. When Copilot or a Microsoft Fabric data agent answers a natural-language prompt, it does not query raw database storage directly. It queries the semantic model. The AI relies on the DAX logic written by human data professionals to guarantee that "Profit Margin" always uses the exact, enterprise-approved formula.
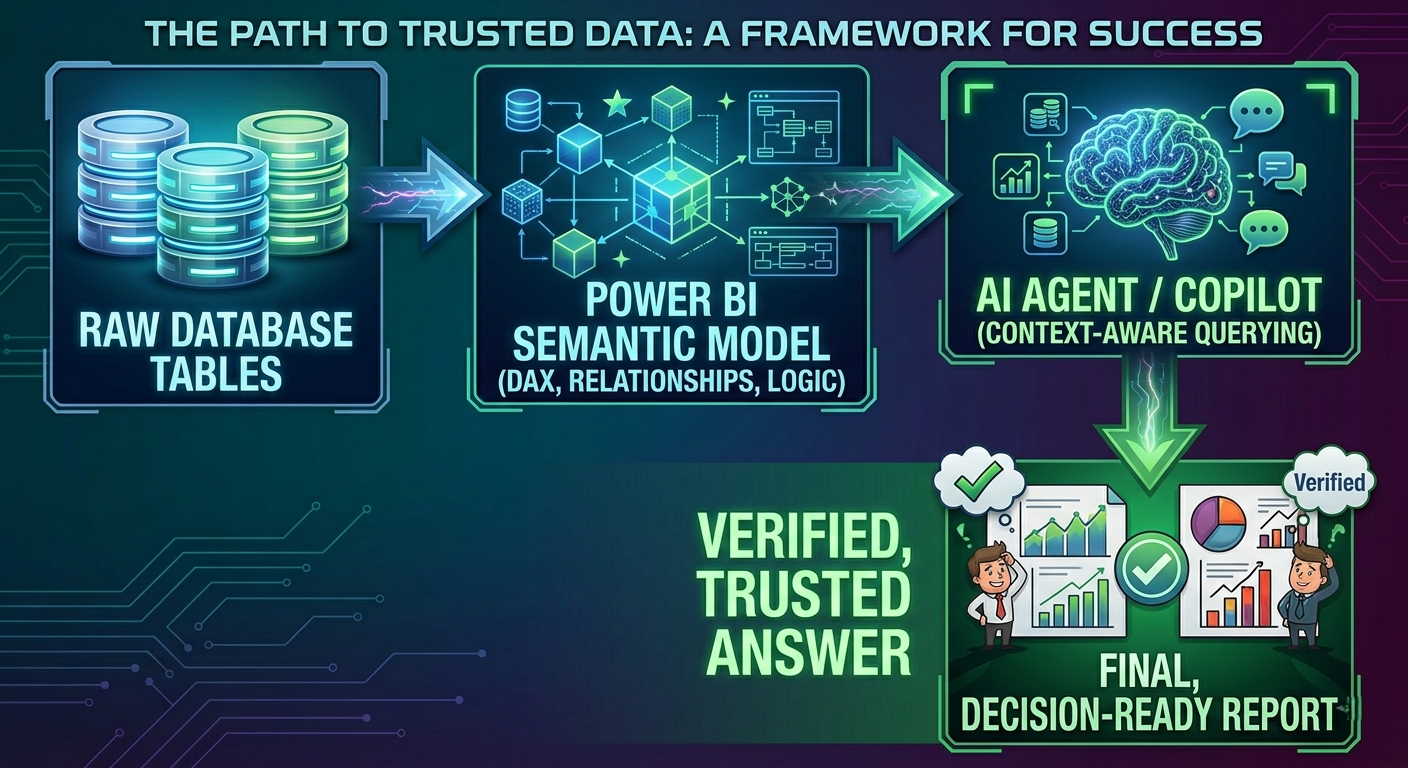
The fundamental equation of modern analytics is clear: The quality of an AI’s insights is directly capped by the quality of the underlying semantic model.
If your data modeling is messy, your AI analytics will be untrustworthy. If your semantic definitions are rigorous, your AI analytics become an extraordinary force multiplier for decision-making.
What Copilot in Power BI Actually Does
Rather than treating AI as a vague future promise, it helps to examine how Microsoft has integrated Copilot and
conversational analytics into the current Power BI ecosystem.Within current Power BI Desktop and Service
environments, Copilot serves distinct authoring and consumption roles:
Conversational Exploration: Business users can use conversational chat panes directly inside reports or on mobile devices to ask back-and-forth analytical questions. Instead of relying on rigid slicers, users can type prompts such as "Compare operating expenses between EU and NA divisions for products released after 2024," and Copilot will query the model to produce dynamic text summaries and generated visual elements.
Automated Report Generation: Report authors can instruct Copilot to draft entire report pages based on specific topics in the semantic model. A prompt like "Create an executive overview page focused on customer churn drivers" yields a pre-formatted layout with KPI cards, trend lines, and decomposition trees.
DAX and Metadata Assistance: Model authors can use Copilot to generate measures, draft descriptions for complex calculations, or optimize model structures.
Prep for AI (AI Data Schemas and Instructions): Microsoft introduced dedicated modeling tooling—such as "Prep data for AI"—allowing authors to explicitly curate which measures, tables, and synonyms are exposed to AI tools, preventing internal helper measures or intermediate tables from confusing the language model.
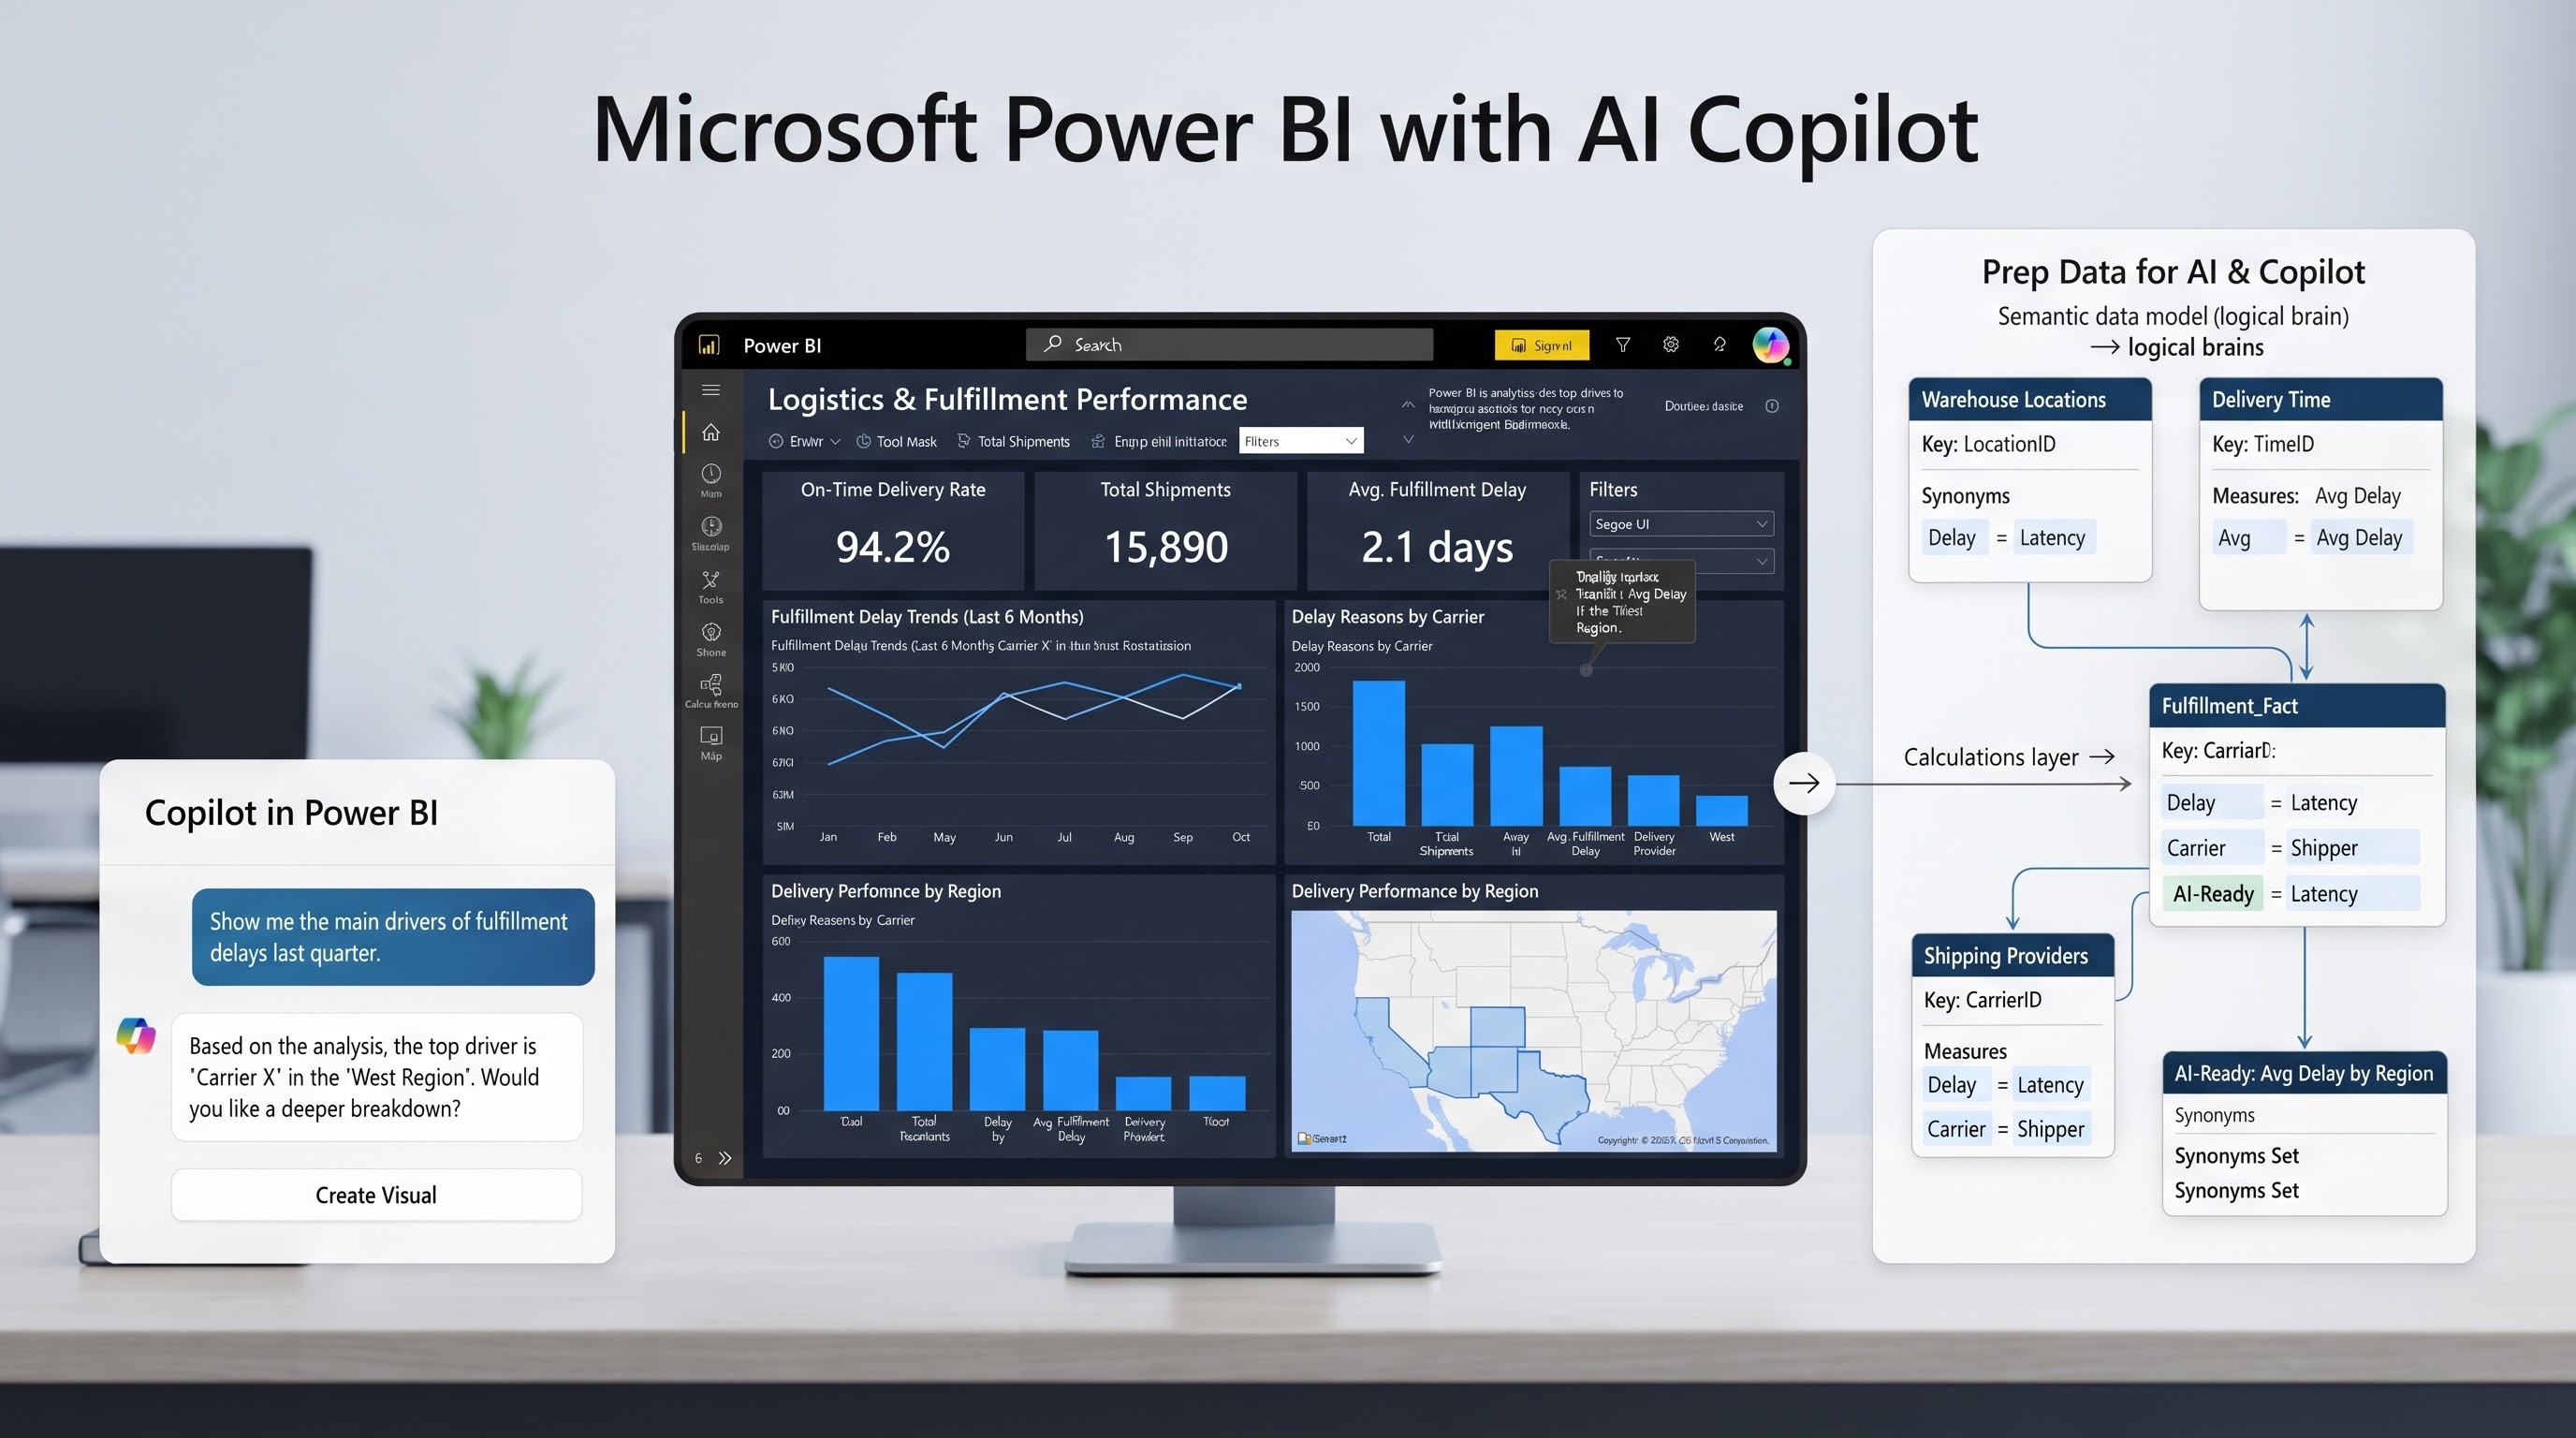
For professionals learning Power BI, understanding these AI-assisted workflows requires more than knowing how to build a basic report. A course on power bi can help build a foundation in DAX, semantic models, data relationships, and report development, giving learners a clearer understanding of what happens behind the conversational experience. In an AI-assisted workflow using Power BI and Copilot, the interaction resembles a targeted conversation:
User: "What was our average order-to-delivery time across all distribution centers last month?"
Copilot: "Average order-to-delivery time was 4.2 days in July, an increase from 3.1 days in June."
User: "Which fulfillment center had the largest increase, and what product category was most affected?"
Copilot: "The Memphis logistics hub experienced the largest increase (+1.8 days). The apparel category accounted for 62% of the total delay volume due to inventory stockouts."
Notice what happened in this interaction. The user did not need to know which page of a multi-tab report contained fulfillment metrics. She did not need to check if the shipping status filter applied to both parcel and freight orders.The system evaluated her questions against the governed semantic model, ran the underlying DAX calculations, and presented a conversational explanation alongside targeted data points.
However, this smooth interaction depends entirely on guardrails. If the developer had not mapped the term "distribution centers" to the Warehouse Location table, or if "delivery time" had not been established as a calculated DAX measure, Copilot would have failed to fulfill the request. The AI is the voice; the Power BI model is the brain.
Beyond Reports: Fabric Data Agents and Enterprise Scope
To appreciate where Microsoft is steering this architecture, one must look beyond individual Power BI report files. pbix and view Power BI inside the broader Microsoft Fabric ecosystem. Historically, Power BI reports operated in relative silos. You published a dataset and a report to a workspace, and users interacted with that specific artifact. If an analyst needed to combine CRM sales data from Power BI with real-time telemetry from an IoT event hub or raw enterprise data stored in a delta lake, they had to build complex ETL pipelines to move the data into a single model.
With Microsoft Fabric, data architectures are converging around OneLake—a unified enterprise data lake house infrastructure. Within this unified framework, Microsoft introduced Fabric data agents.
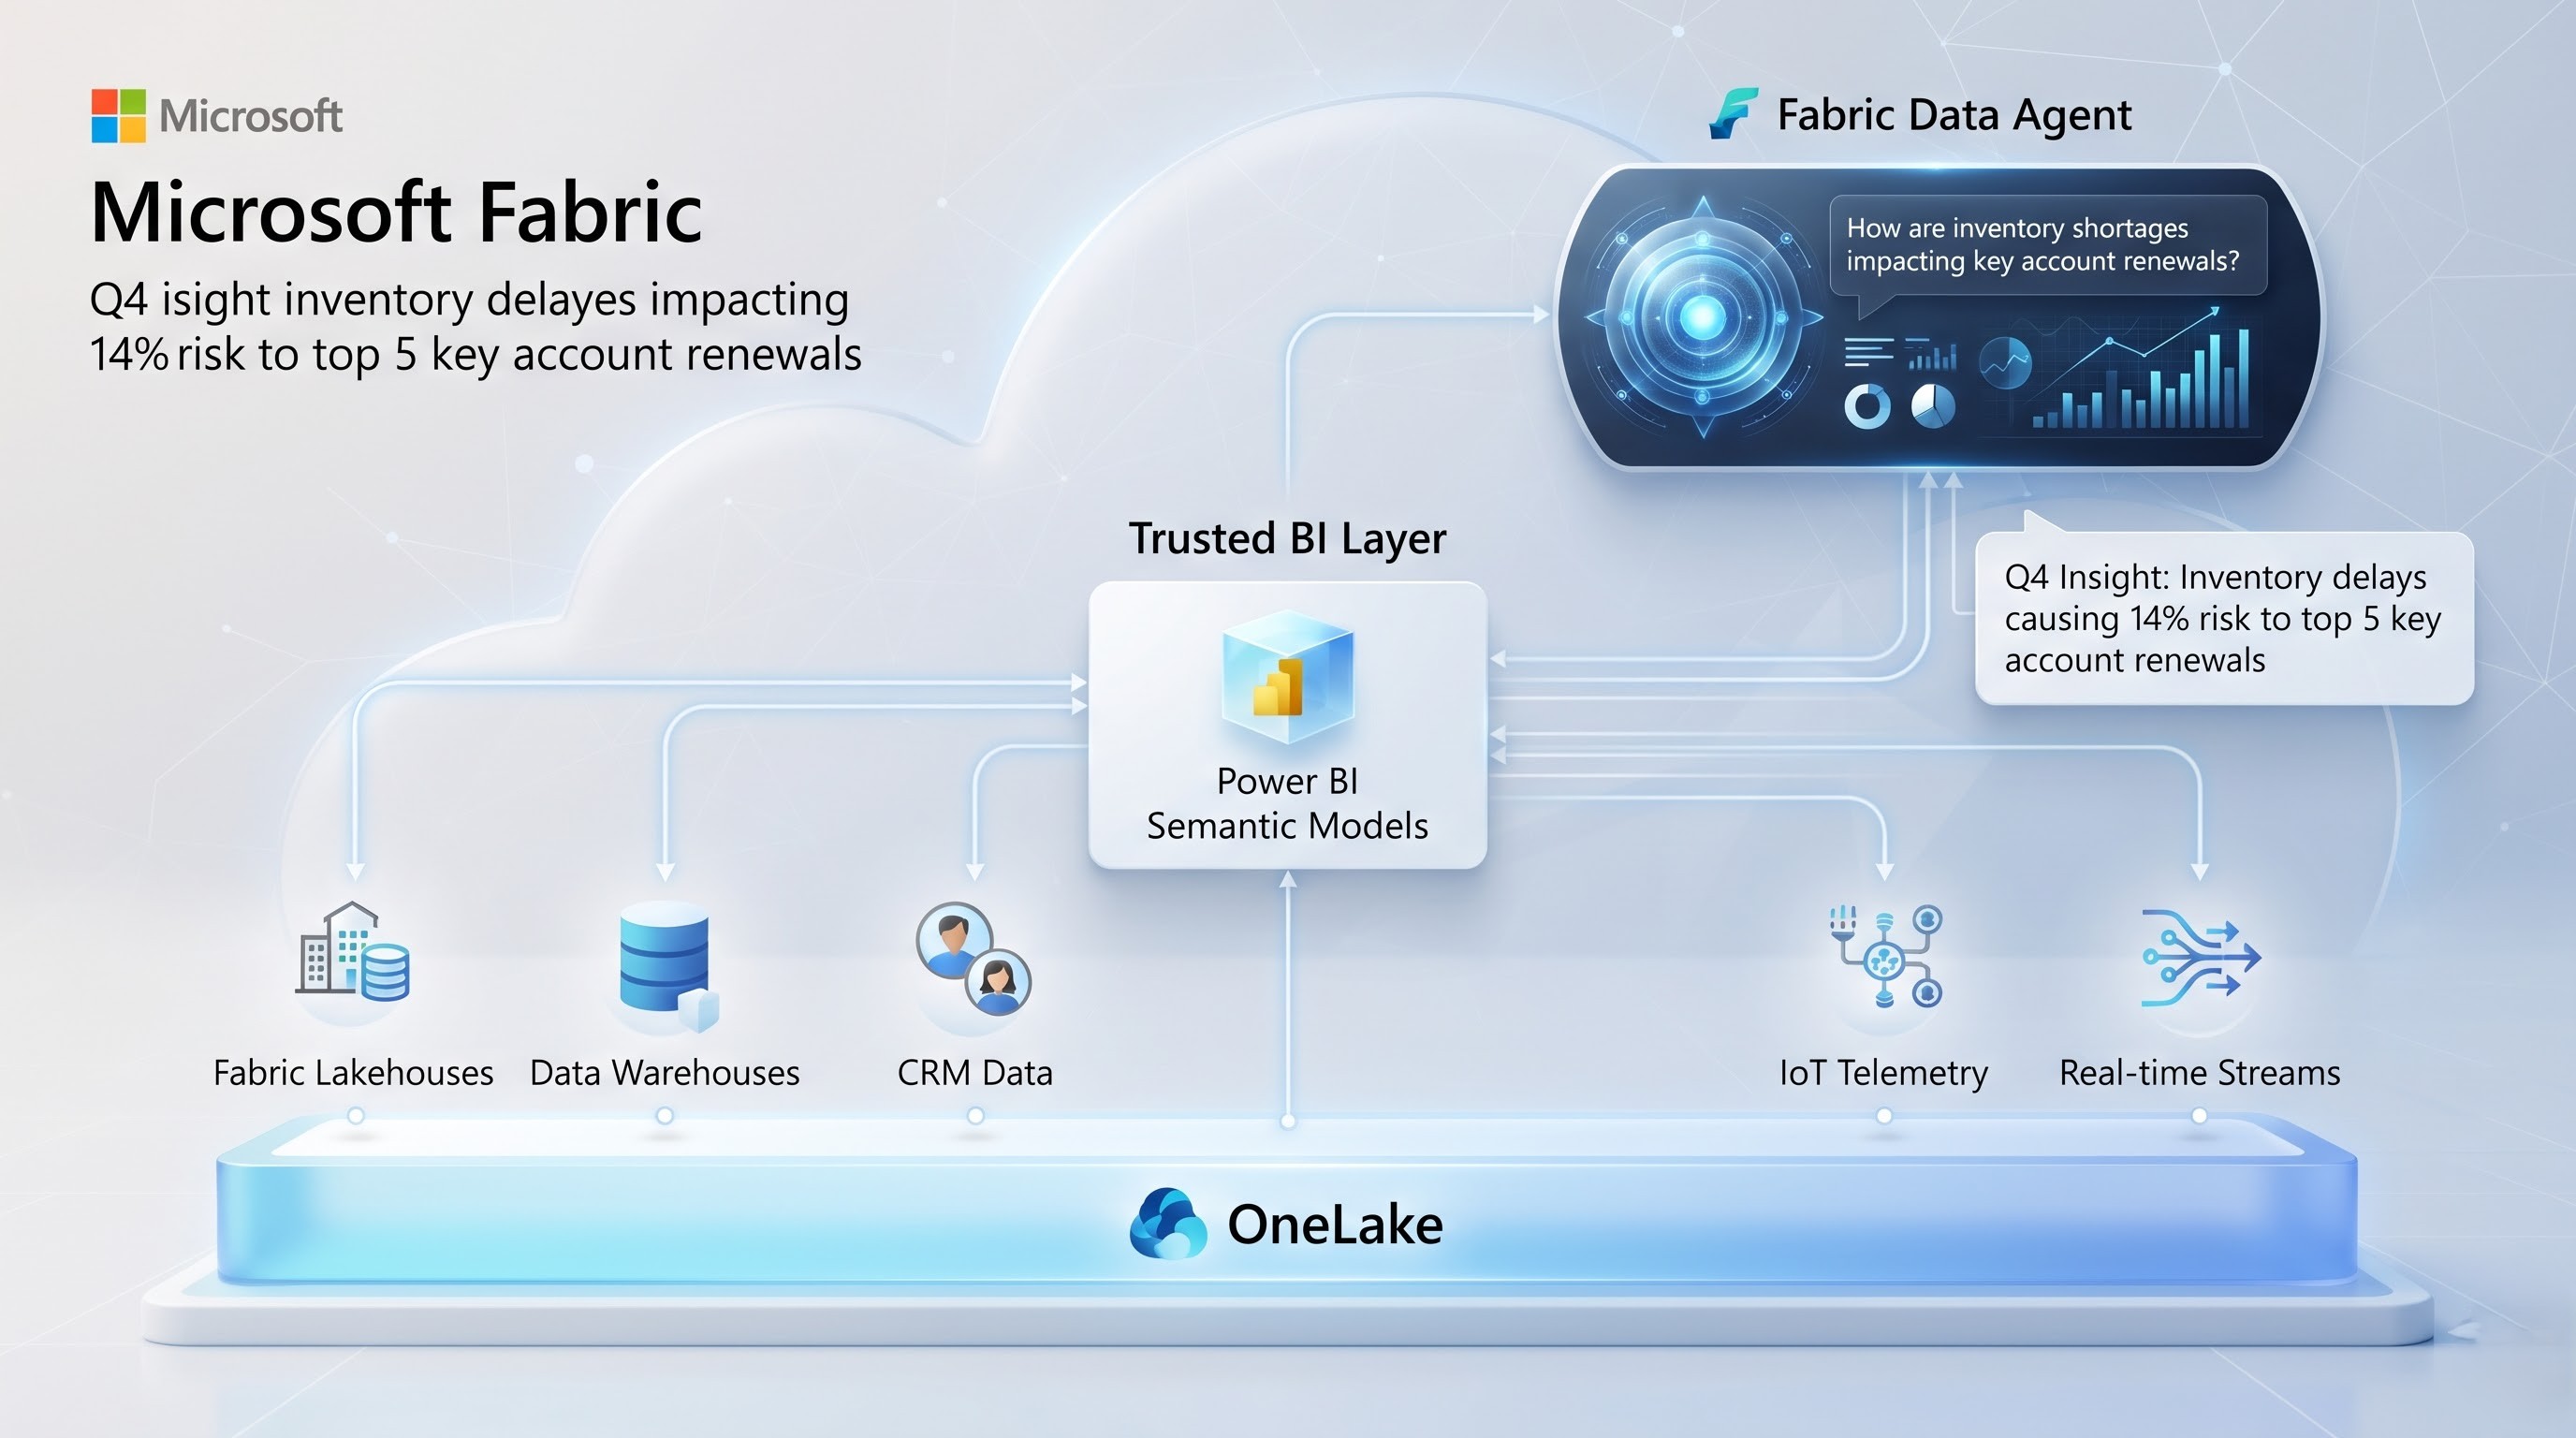
A Fabric data agent acts as a conversational controller across your enterprise data estate. Instead of constraining conversational queries to a single Power BI dataset, a Fabric data agent can simultaneously interface with:
Power BI semantic models (for curated, DAX-calculated business KPIs)
Fabric Lakehouses and Warehouses (for raw transactional history)
Real-Time Intelligence / KQL Databases (for streaming operational logs)
Enterprise Ontologies and Microsoft Graph (for organizational context)
When a user asks a complex enterprise question—such as "How are current inventory shortages in our Chicago warehouse impacting key account contract renewals across our CRM?"—the Fabric data agent handles the orchestration. It queries the Power BI semantic model to pull accurate fulfillment KPIs, queries the CRM data warehouse to evaluate account value at risk, combines the insights through Azure OpenAI services, and delivers an enterprise-level synthesis.
This architectural transition shifts the nature of business intelligence from "find the right dashboard tab" to "ask the enterprise a business question". Power BI semantic models do not disappear in this multi-agent world; they become the primary source of truth for financial, operational, and performance calculations that agents draw from.
DAX is Changing, Not Disappearing
Whenever AI capability makes a leap, technical communities worry that specialized code will become obsolete.
In the Power BI domain, that concern centers on DAX (Data Analysis Expressions).
DAX is notoriously demanding. Unlike standard SQL, which operates on straightforward tables, DAX relies heavily on row context, filter context, context transition, and complex evaluation trees. Writing efficient, bug-free DAX for calculated measures like time-intelligence metrics or dynamic inventory balances requires years of specialized practice.
So, does generative AI render DAX knowledge irrelevant? The short answer is no. AI accelerates DAX writing,
but it increases the requirement for human validation.
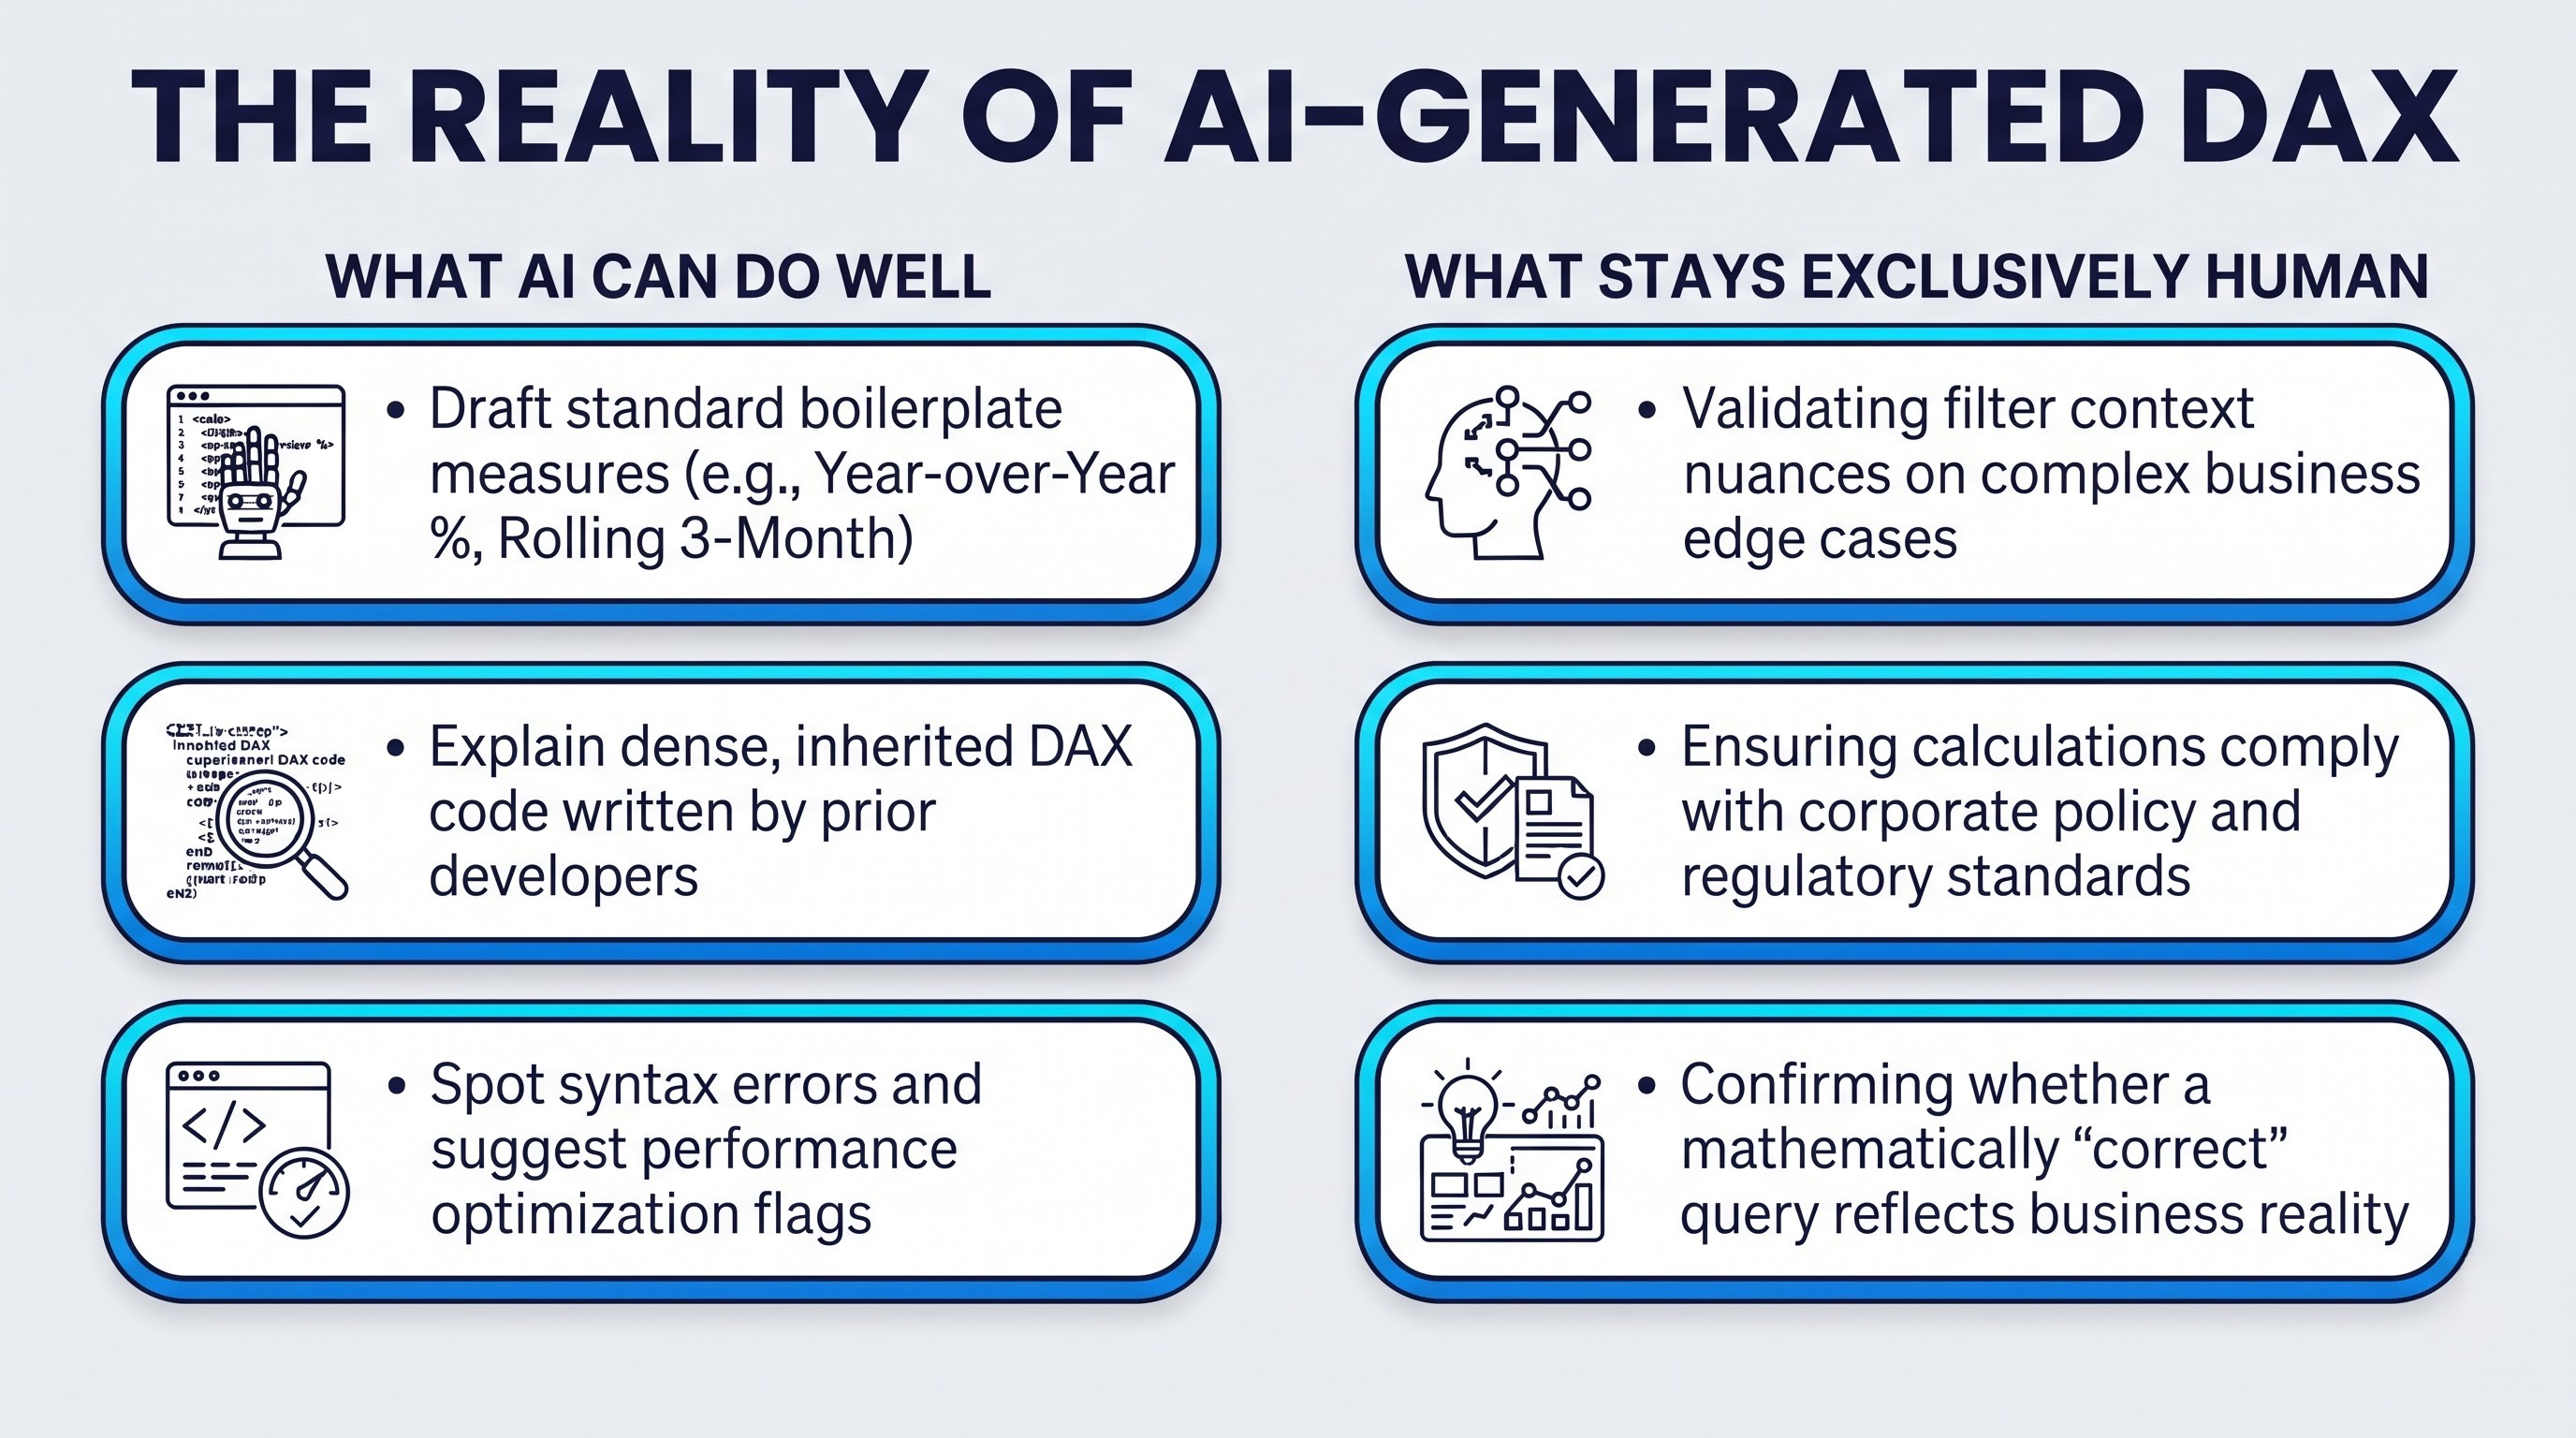
Generative AI excels at drafting boilerplate DAX. If you ask Copilot to write a measure calculating a rolling 12-month sales average while ignoring external filter context on product colors, it will generate syntactically correct code in seconds. However, generating syntax is fundamentally different from verifying business correctness.
Consider a scenario where an AI generates a DAX measure intended to compute Customer Lifetime Value (LTV). The AI writes a measure that calculates and modifies the filter context using ALL(Sales). Syntactically, the DAX compiles without errors. The visual renders beautifully. However, because the AI used ALL(Sales) instead of ALLEXCEPT(Sales, Customer[CustomerKey]), the measure accidentally ignores customer segment boundaries, silently outputting the total average sales for the entire enterprise for every individual customer row.
A non-technical manager looking at the report won't see an error code. They will simply see numbers that look plausible enough to act on. If no human BI professional understands filter context and context transition, that erroneous calculation might drive budget allocations for months before anyone notices the flaw.
AI can write code, but AI cannot accept accountability for the correctness of a decision. The role of the DAX developer is evolving from manual syntax coder to logic architect and auditor. You may spend less time typing function syntax manually, but you will spend more time reviewing, testing, and verifying that AI-generated expressions accurately reflect complex corporate policies.
Business Context: The Unbridgeable Human Gap
Data models, DAX, and AI prompts are technical artifacts. But business intelligence exists to serve human organizations, where metrics are bounded by real-world context. A classic mistake made by novice data teams is assuming that data speaks for itself. It rarely does. Data speaks only in the context of business objectives, operational constraints, and departmental politics. Consider how the exact same metric—Sales Volume—is interpreted across different departments within the same company:
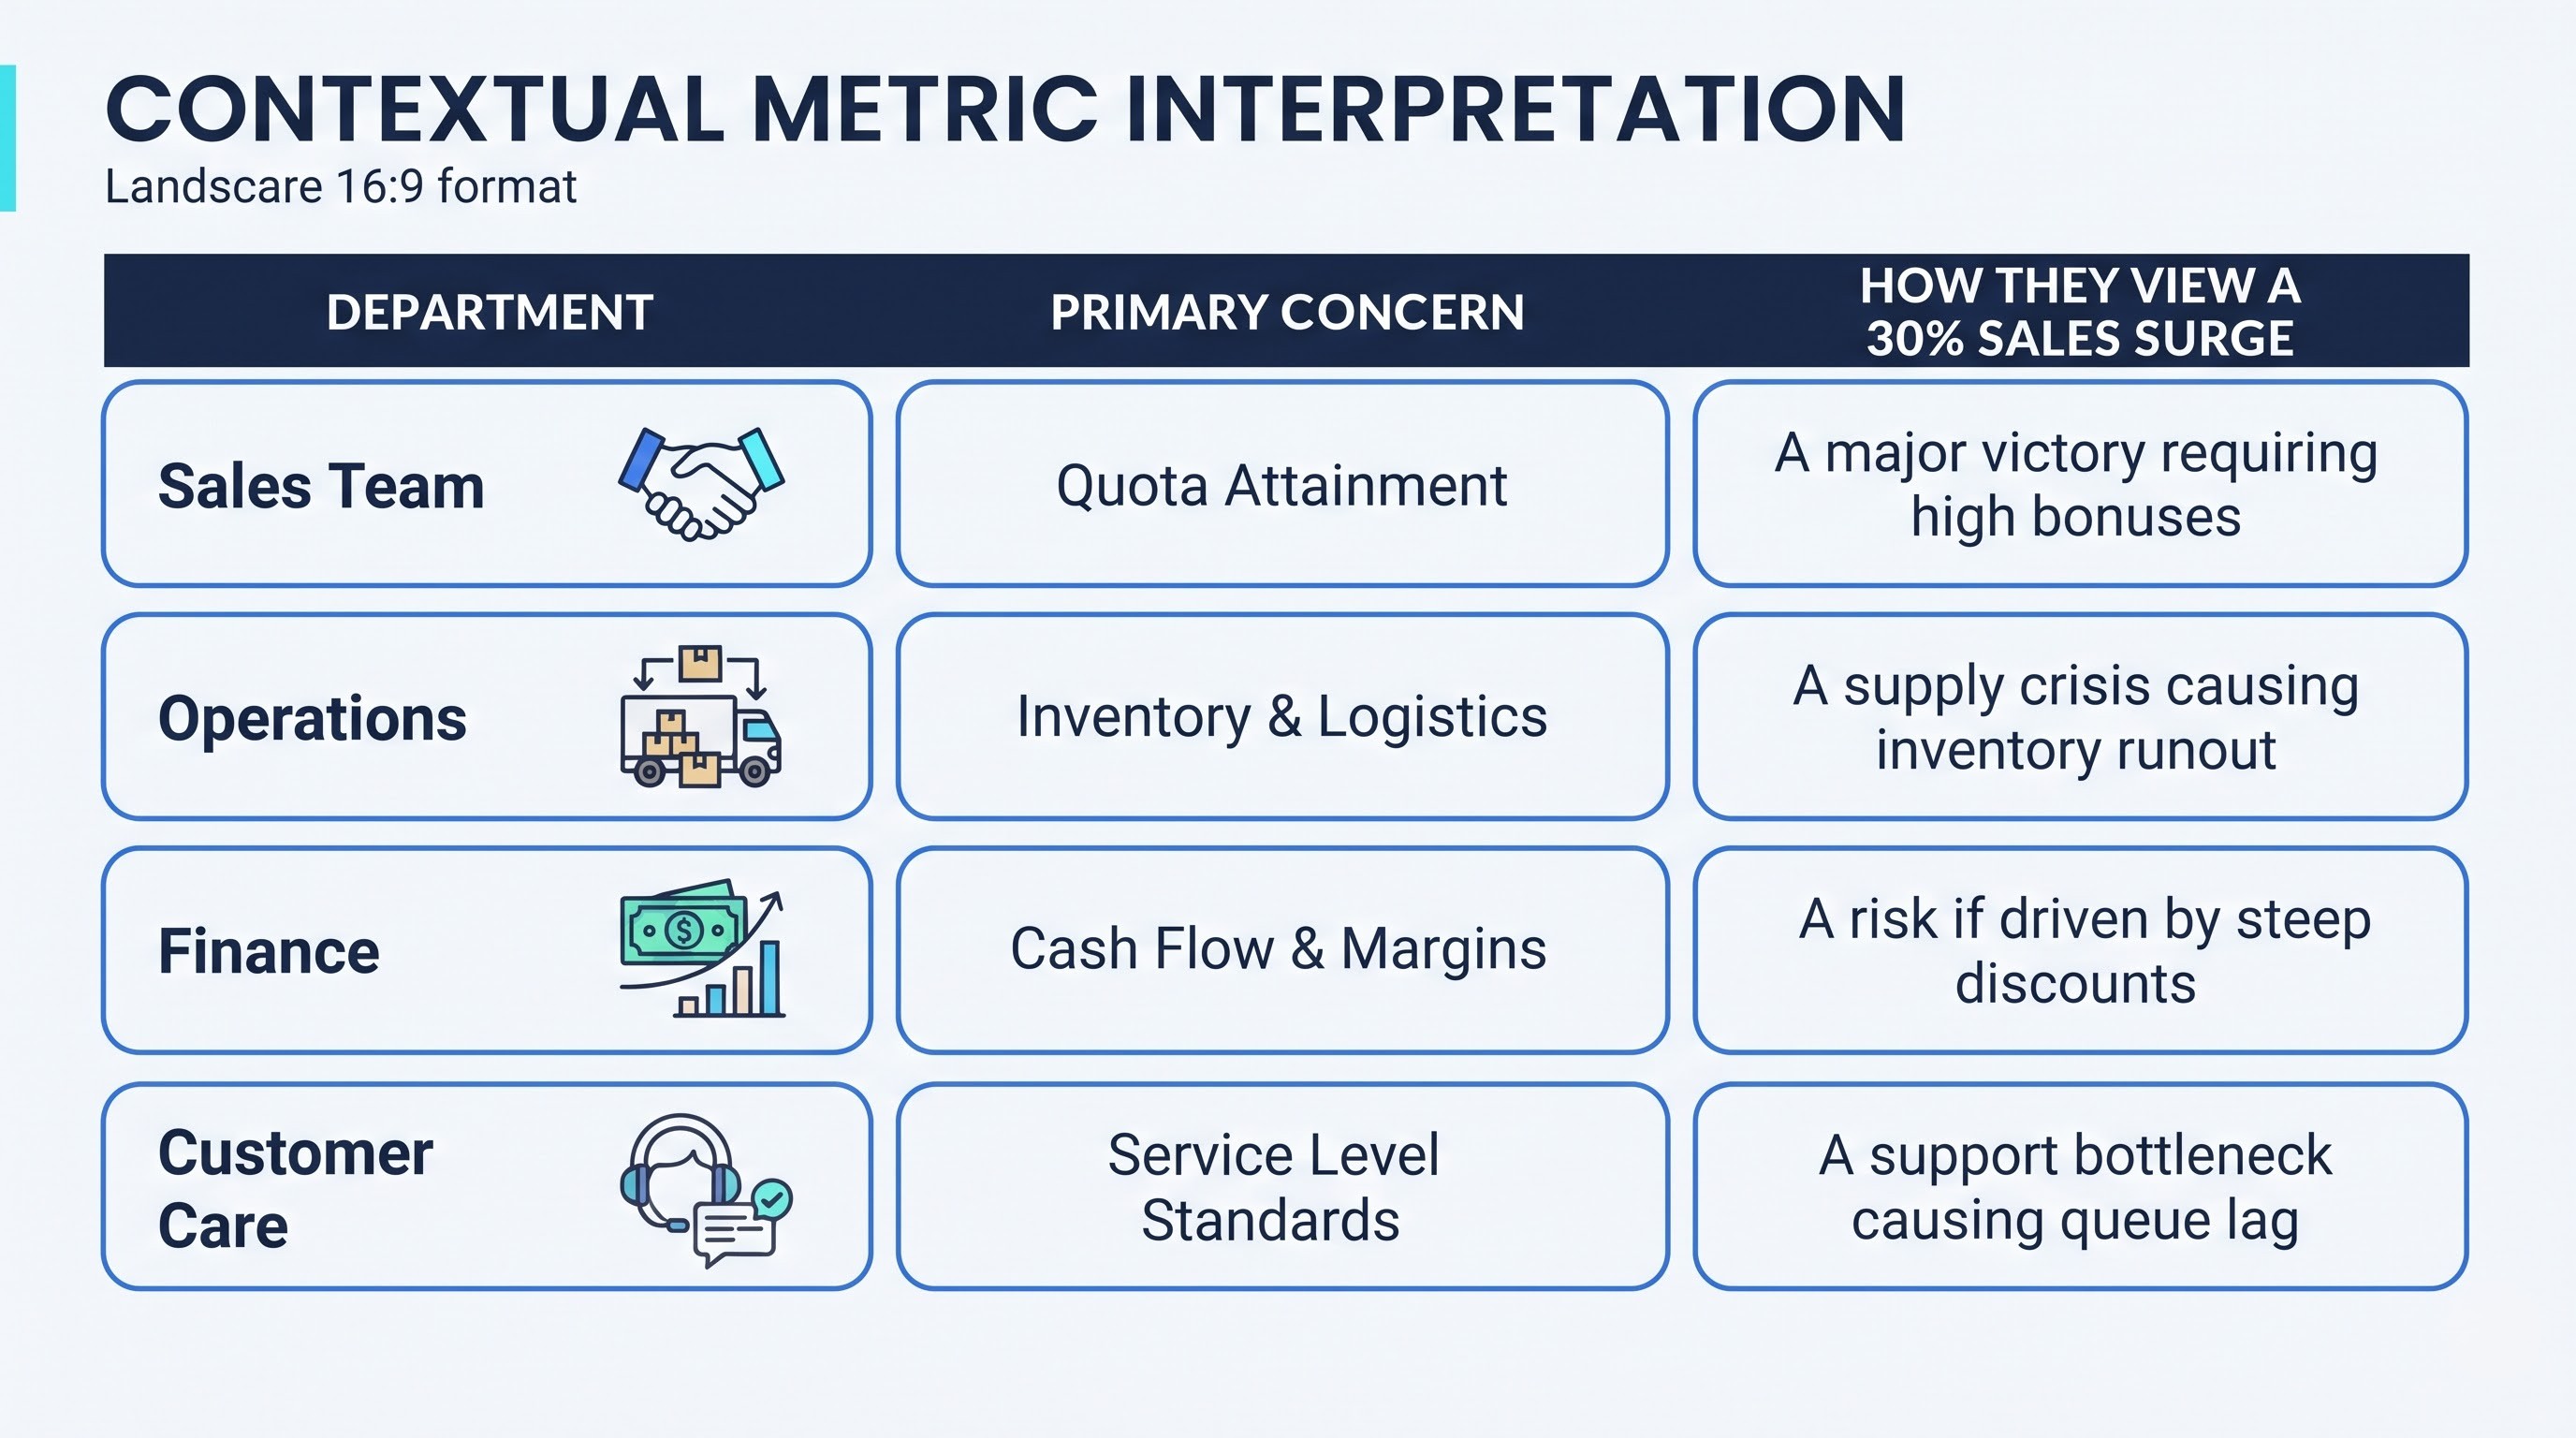
An AI agent processing raw sales tables does not implicitly understand these departmental perspectives unless a human analyst structures the analytics ecosystem to account for them.When a sales executive asks Copilot, "How did our new product launch perform?", a naive AI might answer: "Product X sold 50,000 units, exceeding sales targets by 20%."
A seasoned BI professional, understanding the broader business context, designs the semantic model and report structures to reveal the deeper story:
"Product X sold 50,000 units, but 40% of those sales were cannibalized from high-margin legacy products, and expediting freight to meet demand reduced overall product line profitability by 12%."
Bridging this gap requires deep human immersion in the business. It requires spending time with supply chain managers, interviewing finance directors, listening to sales calls, and understanding the strategic priorities of executive leadership. AI can process data at speeds no human can match, but humans remain responsible for defining what actually matters to the business.
The Emerging Skill Stack for Power BI Professionals
As the analytics paradigm evolves from manual report authoring to AI-ready semantic engineering, the core skills required for a successful career in business intelligence are shifting. Building simple drag-and-drop dashboards is no longer a durable career moat. That aspect of BI is increasingly automated by Copilot and natural-language authoring tools.
However, the demand for professionals who can build resilient, governed, AI-ready analytical ecosystems is growing rapidly.
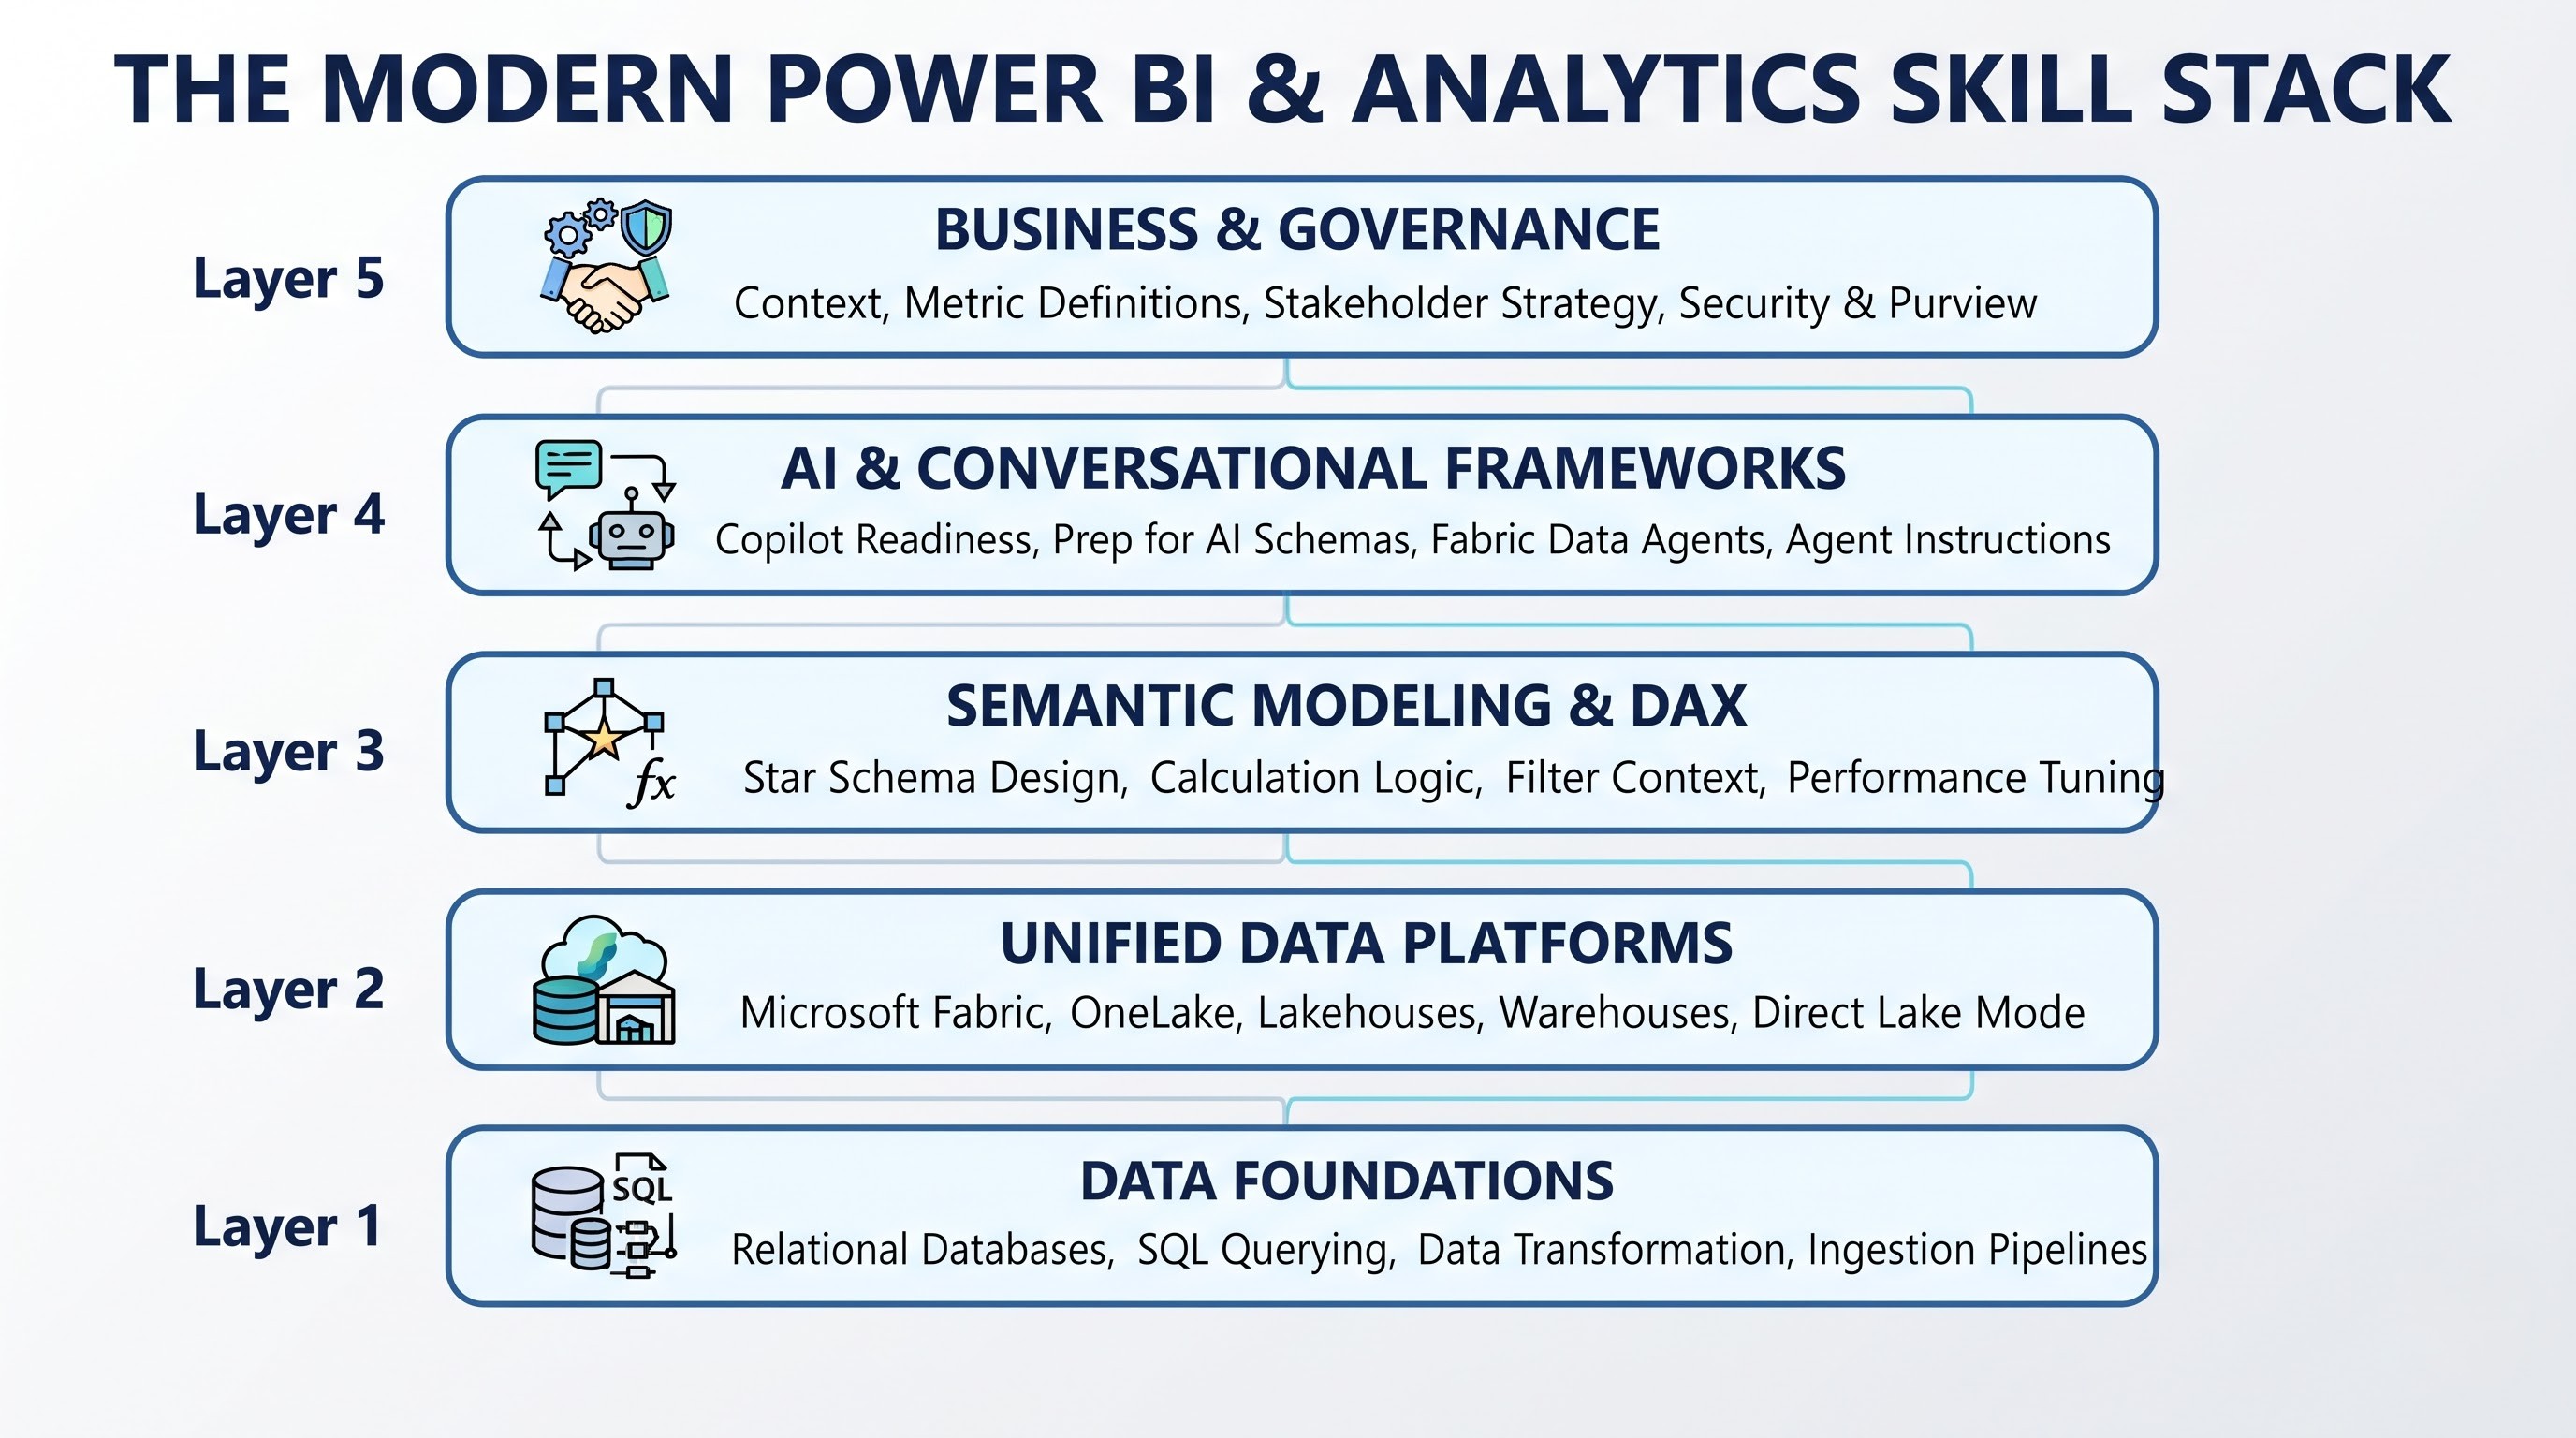
If you are planning a career in modern data analytics or upgrading your current skill set, structure your learning journey in a logical, compounding progression:
1. Data Foundations & SQL
Before you can build high-performing semantic models, you must understand data structures. Learning structured query language (SQL) teaches you how tables join, how aggregations work, and how data transformation occurs at the storage layer.
2. Star Schema & Semantic Data Modeling
This is the core foundation of modern BI. Understanding how to separate numerical events (fact tables) from descriptive business context (dimension tables) is essential. A clean star schema optimizes query performance in Power BI and provides the clear logical structure AI tools need to navigate data without confusion.
3. Core DAX & Advanced Calculations
While AI can help draft code, you must understand filter context, row context, time intelligence, and calculation performance. Without strong DAX comprehension, you cannot audit AI-generated calculations or build complex business rules.
4. Enterprise Architecture & Microsoft Fabric
Modern Power BI does not live in isolation. Learning how Power BI connects to Microsoft Fabric, OneLake, lakehouses, warehouses, and Direct Lake mode ensures you can architect scalable solutions for vast enterprise datasets.
5. AI Enablement & Semantic Governance
Learn how to configure Copilot readiness, author AI schemas via "Prep for AI," set field descriptions, establish synonyms, write instructions for Fabric data agents, and configure security frameworks like Row-Level Security (RLS).
6. Business Translation & Analytical Strategy
The ultimate layer is the ability to sit down with non-technical business leaders, translate ambiguous strategic problems into precise mathematical models, and turn data into clear business choices.
For professionals looking to build a structured foundation in data modeling, DAX, and enterprise architecture, exploring formal learning tracks—such as a dedicated power bi course can help bridge the gap between basic report generation and enterprise data engineering.
What Happens to the Power BI Professional?
Will AI replace the Power BI developer? The short, realistic answer is: AI will not replace Power BI professionals, but Power BI professionals who use AI will replace those who do not.
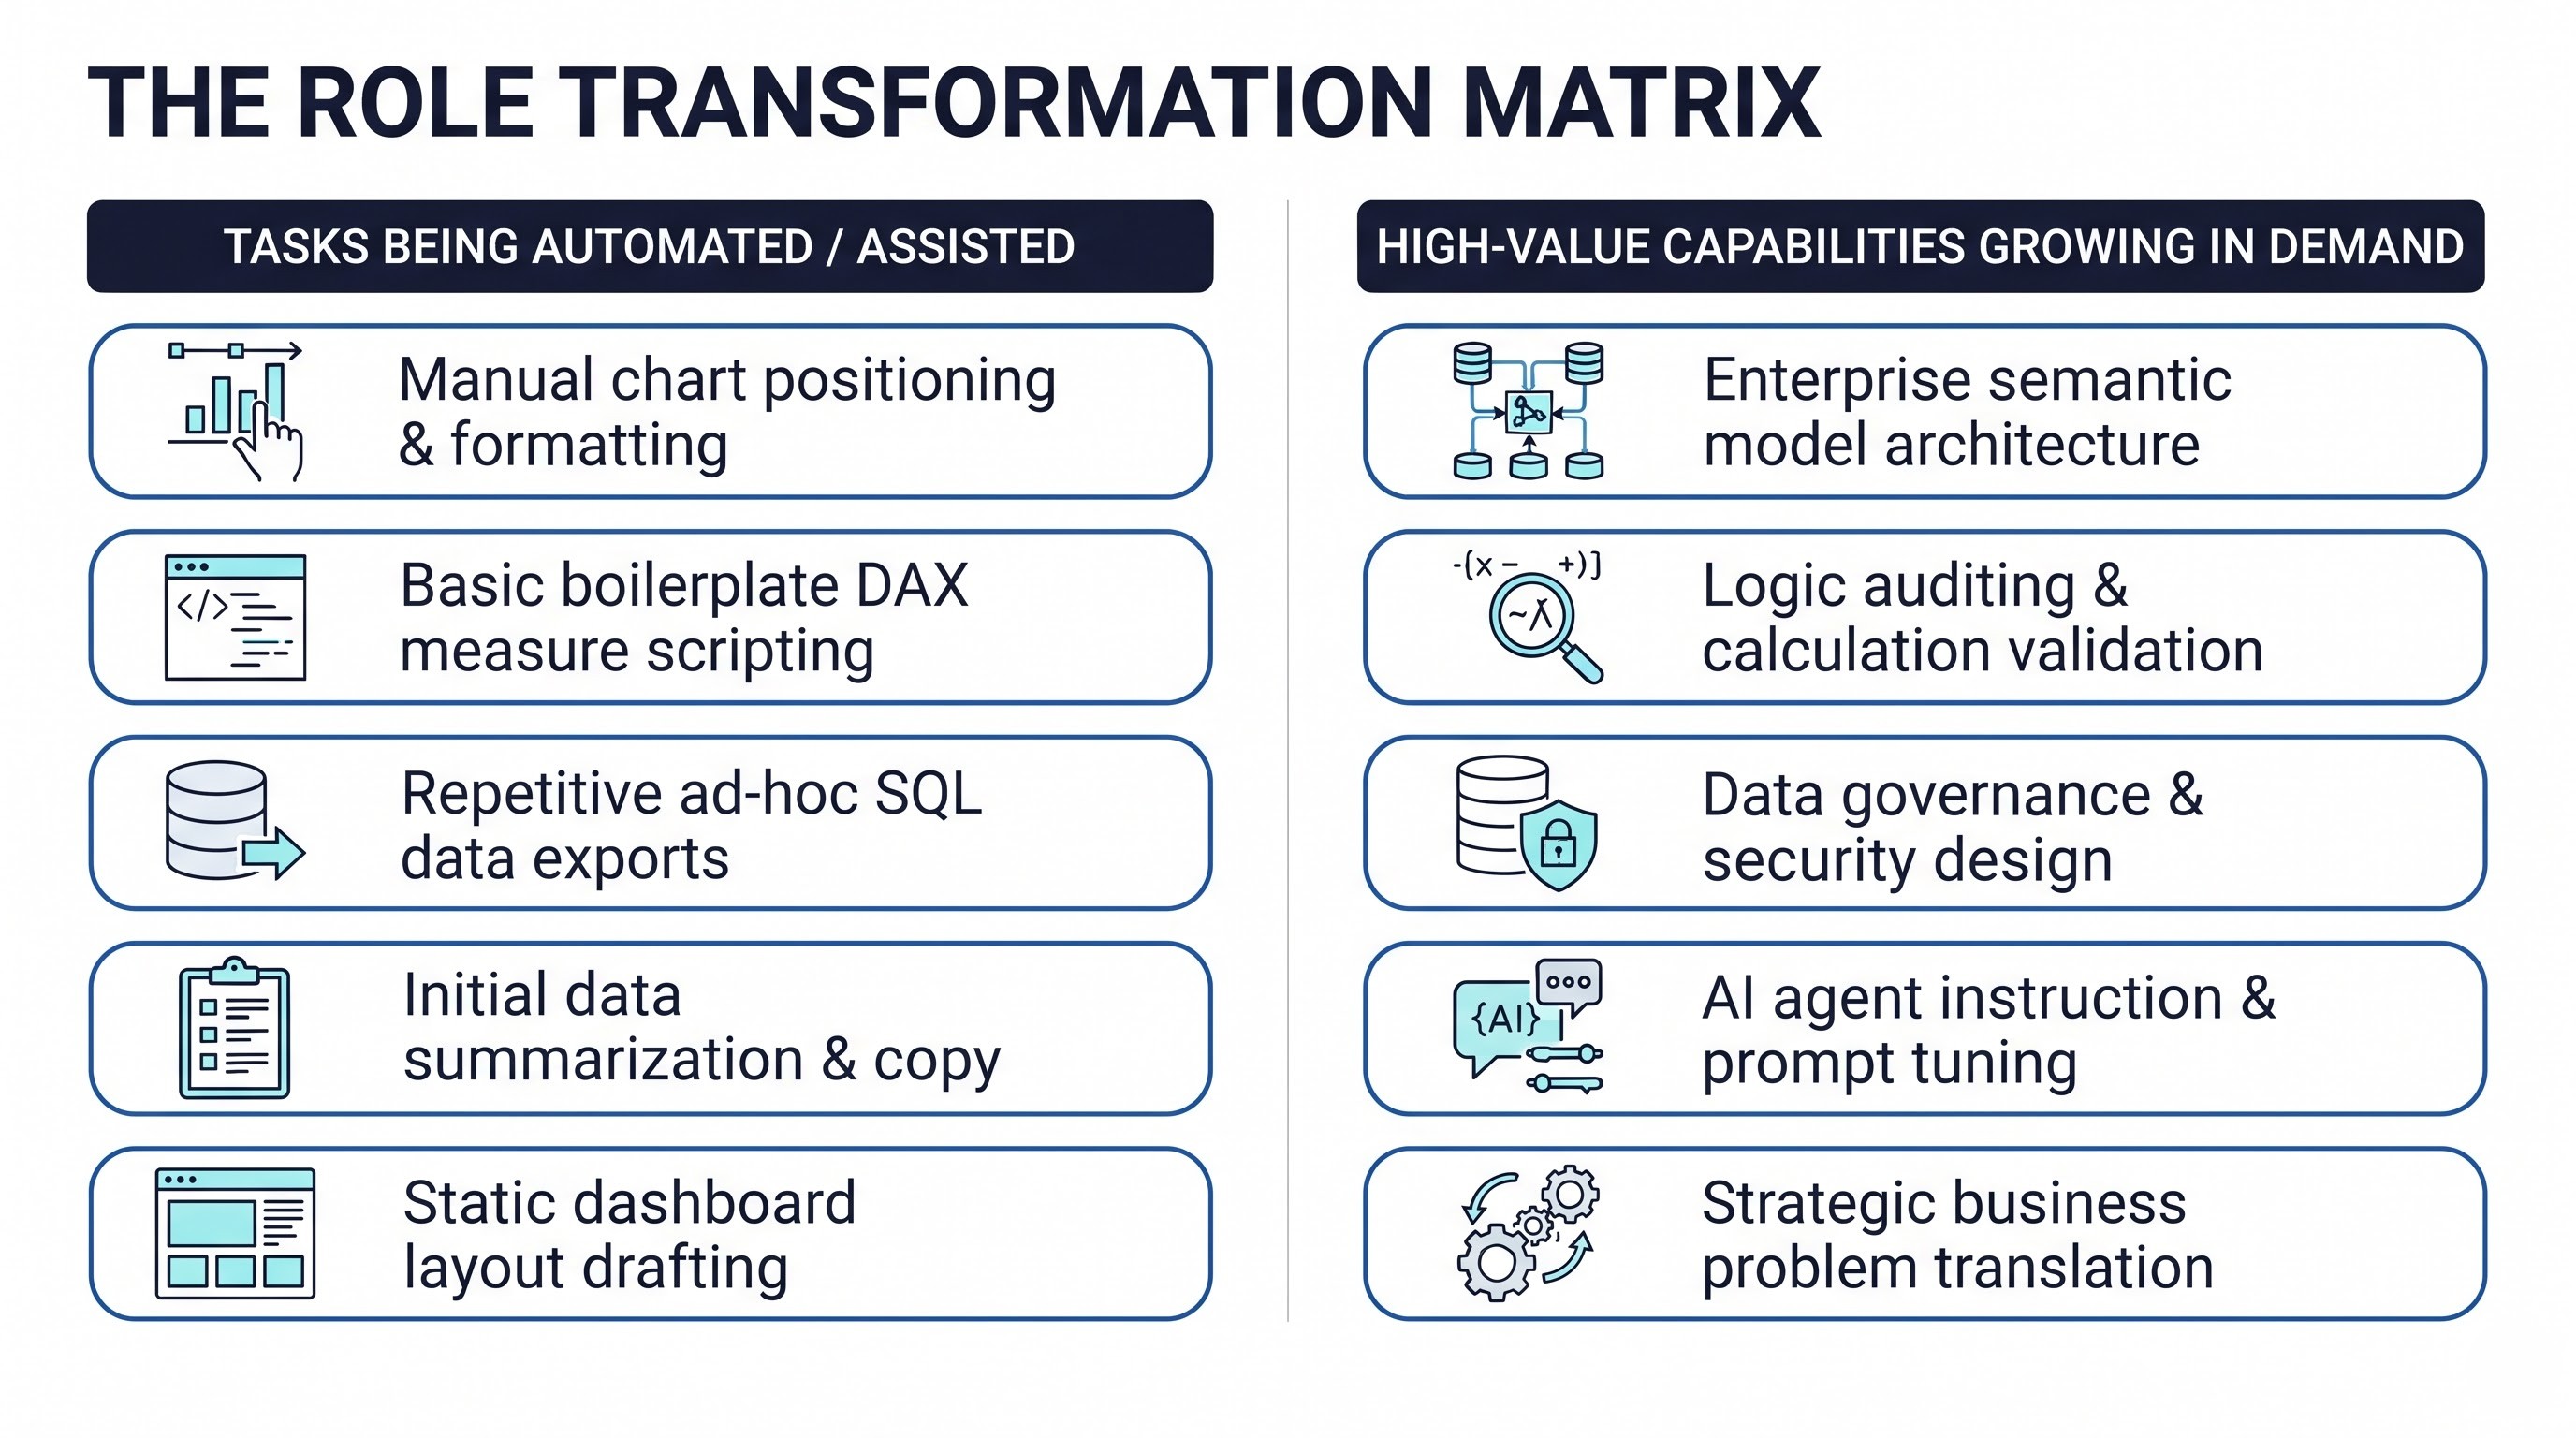
The day-to-day work of BI professionals is undergoing a dramatic shift in focus:
The Old Model: The Dashboard Factory
In the traditional model, a BI team functioned like an assembly line. Business teams submitted ticket requests: "Build me a sales chart by region." The analyst spent 80% of their time cleaning messy spreadsheets, arranging visual containers, setting up color palettes, and writing repetitive measures. Only 20% of their time was spent interpreting insights or advising management.
The New Model: The Intelligence Architect
In the AI-assisted model, repetitive visual construction and basic exploratory querying are handled via natural language interactions.
The BI professional spends 80% of their time on high-value tasks: architecting robust semantic models, implementing strict data governance, establishing data quality pipelines, configuring Fabric data agents, and validating complex analytical logic.
Instead of being treated as a service desk that exports spreadsheets on demand, the modern BI professional becomes a trusted strategic partner. They design the digital twin of the business—the semantic framework—that allows executives and AI agents to converse safely with company data.
What the Next Generation of BI Looks Like
As we look toward the future of analytics, business intelligence is shifting away from static
visual artifacts and moving toward dynamic, conversational decision systems.
Here is what the next era of BI will look like in practice:
1. Headless & Embedded Analytics ("Push" over "Pull")
Users will no longer log into a separate reporting portal to check numbers. Metrics will find the user where they already work—delivered directly into Microsoft Teams channels, Slack threads, Outlook digests, or mobile conversational interfaces via tools like Tableau Pulse and Power BI Copilot integrations.
2. Multi-Agent Data Ecosystems
Multiple specialized AI agents will collaborate across enterprise data estates. A finance data agent, a supply chain data agent, and a customer support agent will query their respective Power BI semantic models and lakehouses, synthesizing multi-department answers to complex corporate questions automatically.
3. Continuous Semantic Governance
Data models will continuously monitor how users and AI agents query data. System logs will identify ambiguous business terms, untracked metric variations, or missing dimension tables, automatically alerting model authors to refine definitions before mistakes happen.
4. Action-Oriented Decision Engines
Analytics will complete the bridge from insight to action. Instead of merely displaying a chart showing that inventory is low in a key warehouse, conversational BI systems will notify the user, summarize the business impact, draft a reorder request, and ask for human approval to execute the transactional ERP update.
Conclusion: Trusted Context is the Real Power
So, what actually happens when AI becomes your BI analyst? The interface to data changes. The speed at which questions are answered accelerates exponentially. The friction between a business user having a thought and seeing a data-backed response drops to near zero.
But the foundational requirement for truth, context, and structure remains entirely unchanged. AI without business intelligence is just a fast way to generate plausible-sounding miscalculations. It takes raw numbers and presents them with conversational flair, but without a governed semantic model, it lacks the context to ensure those numbers are correct.
Power BI is not being eclipsed by AI. It is serving as the semantic anchor that makes AI safe, accurate, and actionable for the modern enterprise. For data professionals, this transformation represents an extraordinary opportunity. The goal is no longer to spend hours manually aligning visual boxes on a grid or writing boilerplate code. The goal is to build the semantic engine that teaches AI how your business operates—transforming scattered enterprise data into trusted, decision-ready intelligence.