
Why Tableau Course Are in High Demand: Career Opportunities and Salary Expectations
Last updated on Jul 28, 2026

Every day, the world digital economy generates 2.5 quintillion bytes of data. However, for many businesses raw data is still a huge pile of unprocessed information. A large data repository stored in SQL, AWS Redshift or Snowflake has huge possibilities but until the management extracts the patterns, finds anomalies and monitors operational efficiency, this data remains.
This is where Tableau comes in—the decisive Business Intelligence and data visualization tool.
Following the acquisition of Tableau by Salesforce for the sum of $15.7 billion, the platform transformed from a desktop program for graphing into the heart of modern corporate analytics. More than 90% of Fortune 500 companies use Tableau to represent complex datasets as user-friendly interactive dashboards.
As companies increase their pace of digital transformation and turn to AI for decision-making, there is a growing gap in the market—the amount of data is much higher than the number of qualified specialists able to handle it.
In this complete guide, we cover the reasons for the increased demand for Tableau specialists, examine the career lines available, look at global pay rates and offer you a step-by-step process to start and prosper in this lucrative profession.
This guide navigates the reasons behind the high demand in Tableau specialists, evaluates various career paths available, scans the global pay trends, and provides you with a complete guide to beginning a successful career in this up-and-coming tableau course online.
The Dominance of Tableau in Analytics
To comprehend why salaries for those skilled in Tableau are quite high, one needs to understand the reasons why global corporations prefer it to its competitors, such as Power BI, Looker, or Qlik.
A. No-Code/Low-Code Visual Mechanism
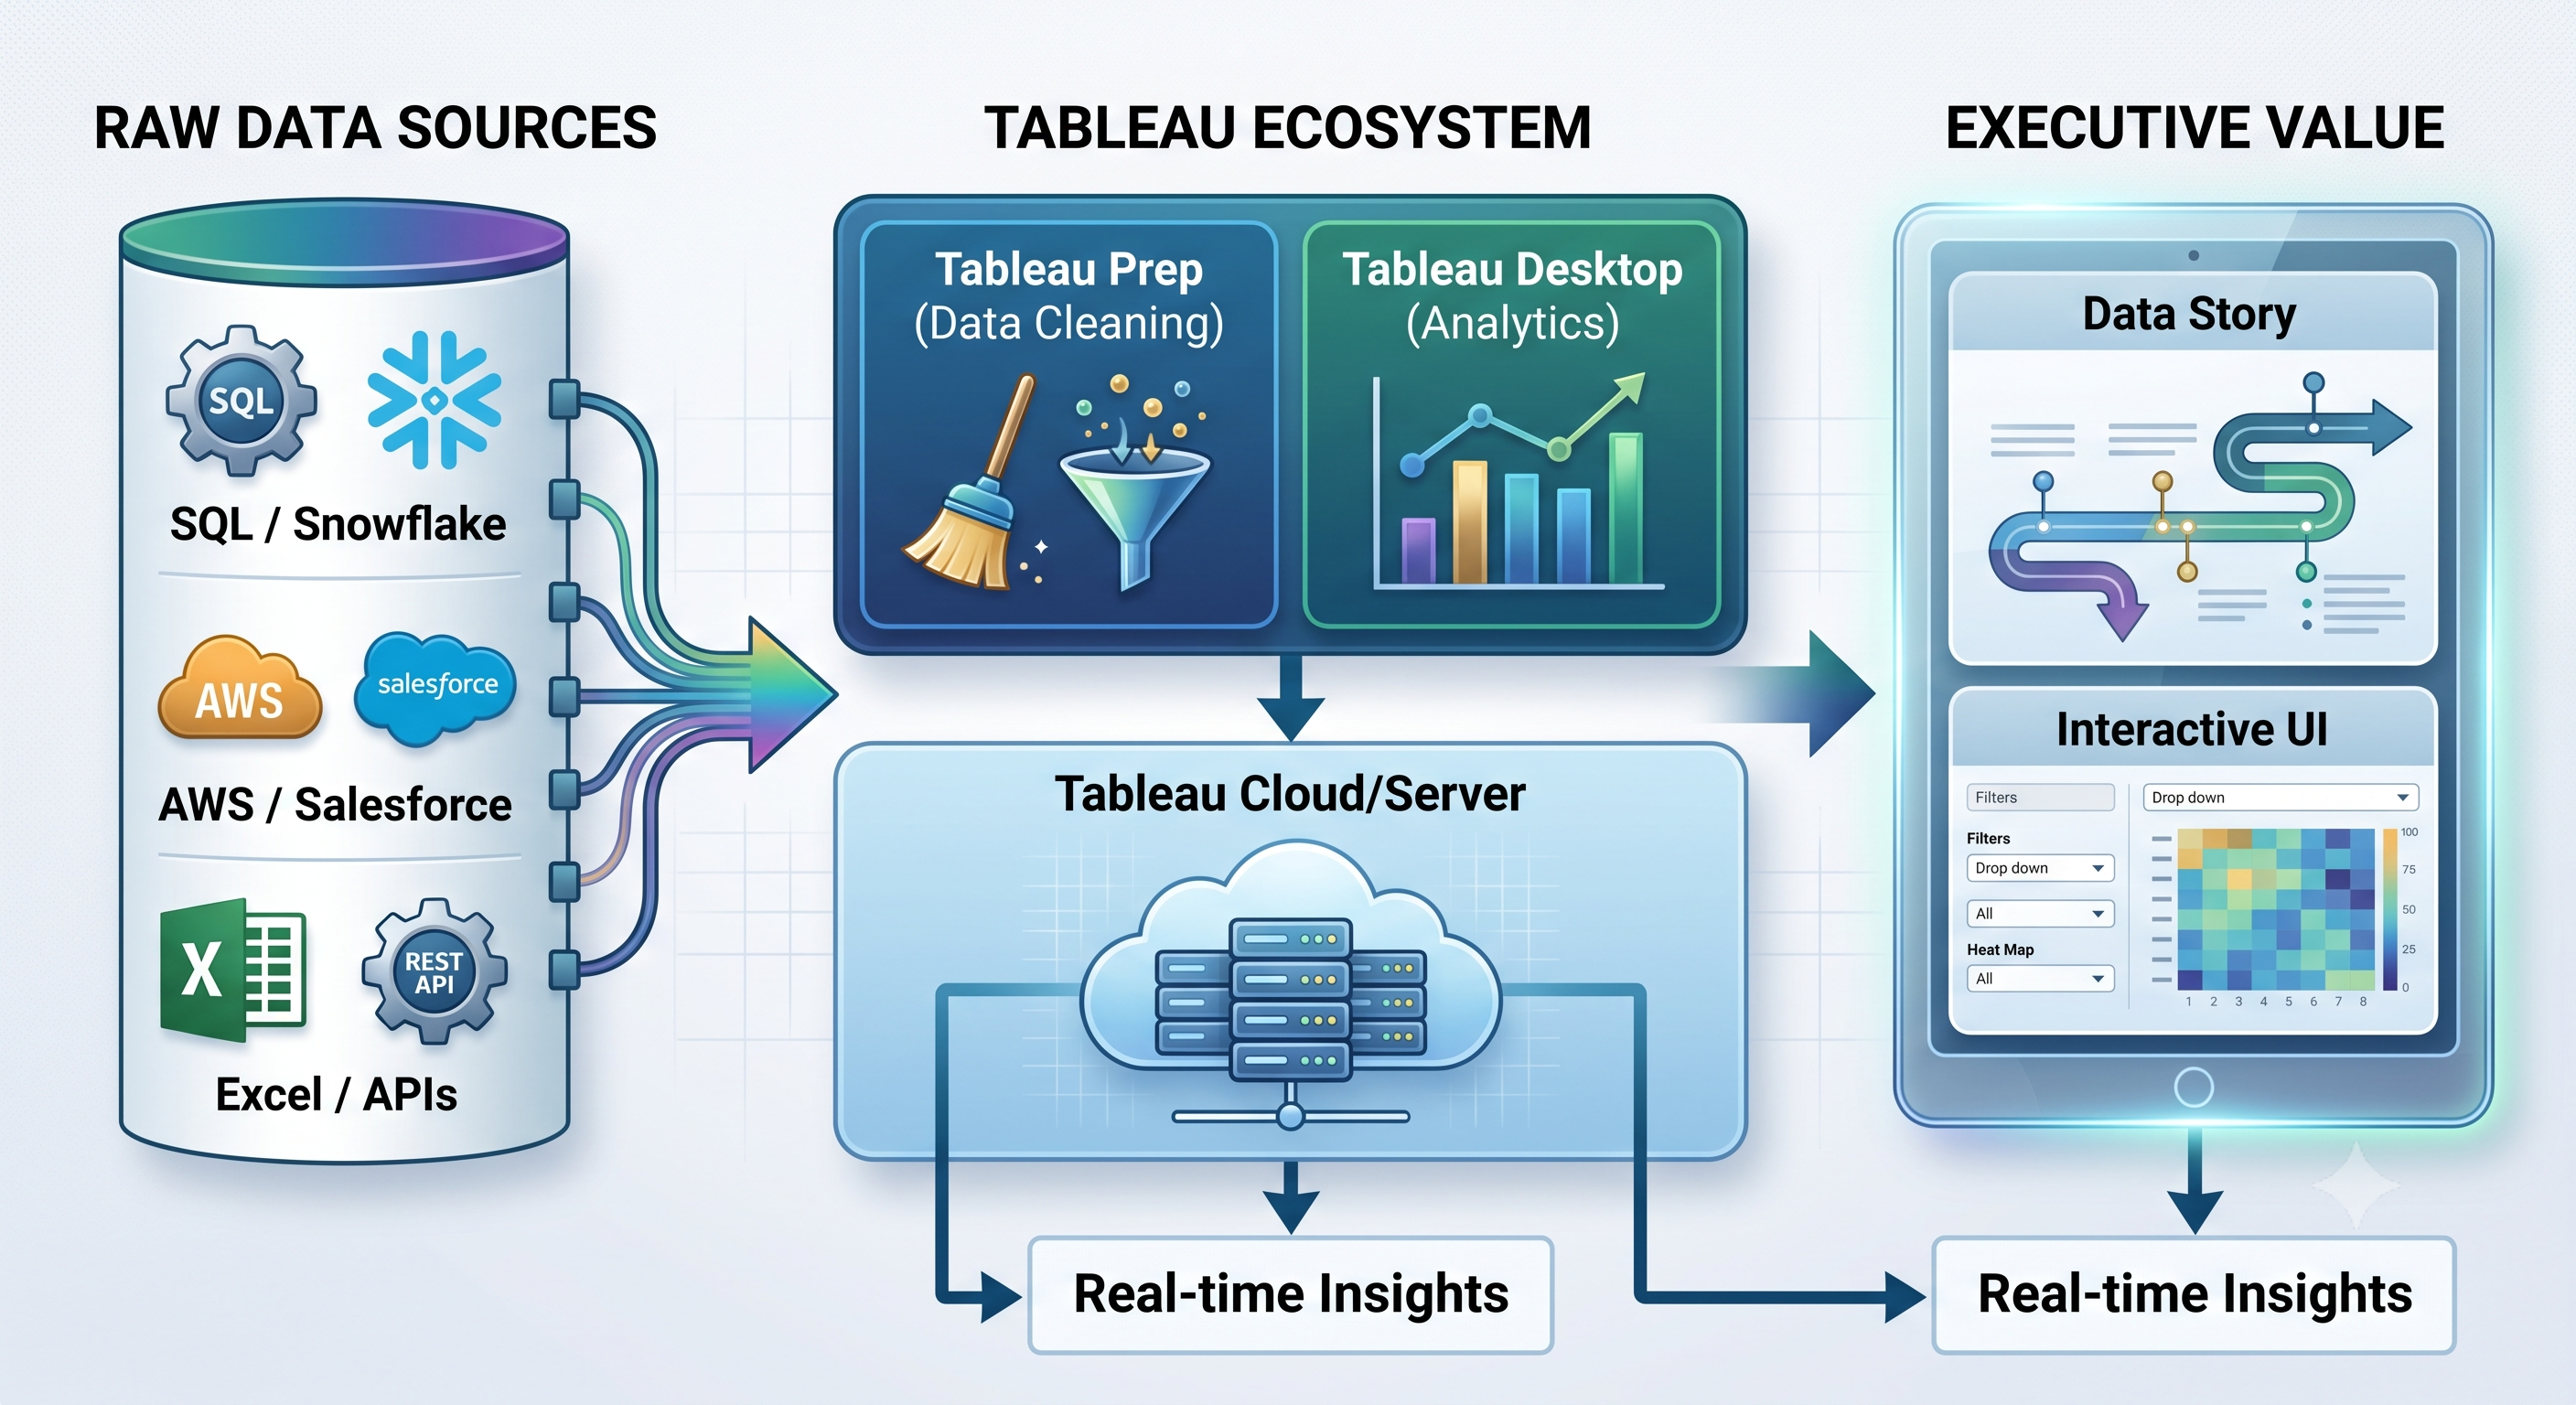
The main system behind Tableau is VizQL (Visual Query Language). This special technology allows users to translate their drag-and-drop actions into efficient visual database interrogations. This makes it easy to go from creating data to visualizing it. One does not need to spend hours composing intricate SQL statements in order to create a grouped bar chart or a multi-axis geographical heat map as Tableau does the complicated query creation itself while a user is working.
B. High-Speed In-memory Analysis Technology
Working with huge amounts of data may cause the failure of older analytical programs. Terrain uses its very powerful Hyper Data Engine for this. This technology makes it possible to execute complex queries with the help of the memory and the column-oriented indexing of the database.
C. Continuous Integration with Salesforce and AI
After being integrated with Salesforce, Tableau has become a part of the Salesforce CRM family, as well as Einstein AI and Data Cloud. The arrival of Tableau Pulse and Agentic AI makes it possible to feed ready-made insights to managers. It means that they do not need to check their calculations as automated.
D. Security and Expansion Prospects for Businesses
Governmental agencies as well as institutions operating in finance, medicine, and military choose the Tableau Cloud or the Tableau Server because of the capabilities related to governance. Row-level security (RLS), encryption at the field level, role-based access control (RBAC), and integration of SAML/Active Directory help users to secure their data.
Sector-specific Uses of Tableau
Tableau can be applied in any industry.
E-Commerce and Retail
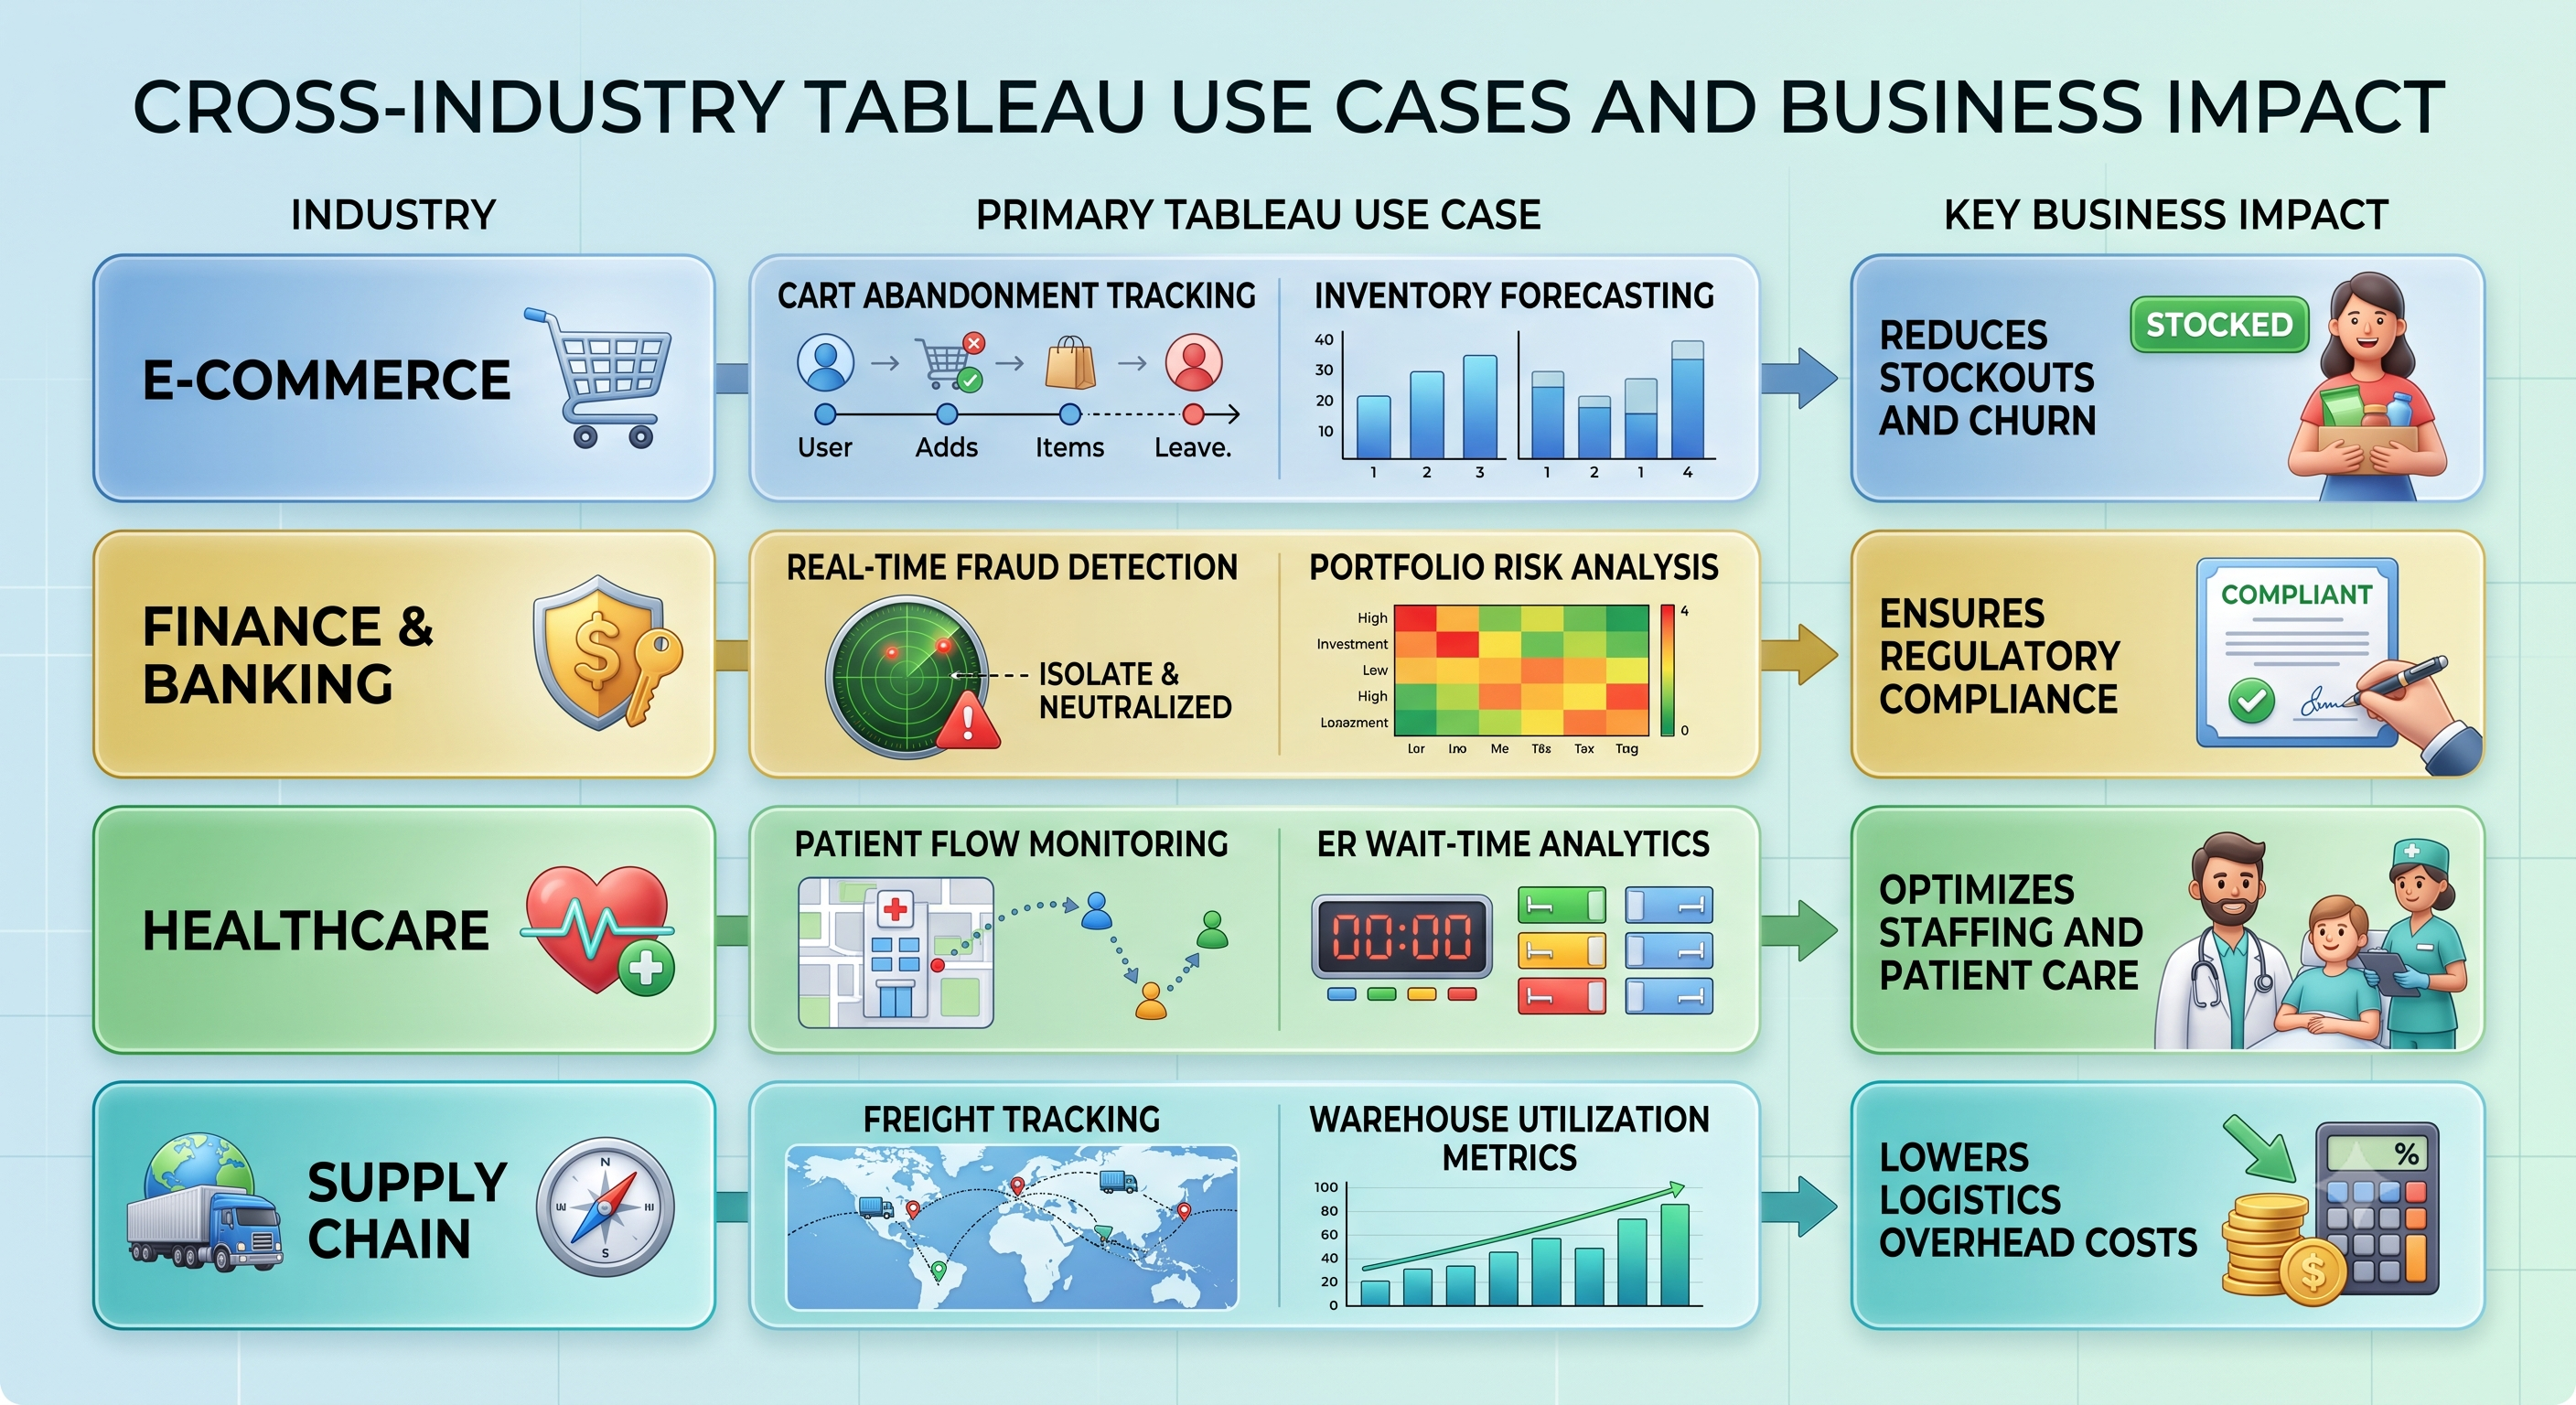
Retail entities utilize Tableau to integrate client interactions. Connecting Shopify order files, Google Analytics, and inventory management data, retail units create dashboards that track Customer Lifetime Value (CLV), Return Rates, and Inventory Turnovers continuously.
Healthcare and Pharmacovigilance
Healthcare institutions utilize Tableau to optimize patient intake, medical effectiveness, and resource allocation. In peak activity periods, healthcare organizations use real-time occupancy dashboards to redistribute doctors and nurses, thus improving medical response speed and outcome quality.
Banking and Finance
Investment entities utilize Tableau to create real-time risk models and track investment portfolios in different world locations. Compliance workers use automatic dashboards to keep watch on suspicious activity logs and comply with the regulation requirements without human errors.
Career Options in Tableau Course
The knowledge of Tableau can be useful for various career pathways, depending on the area of expertise.
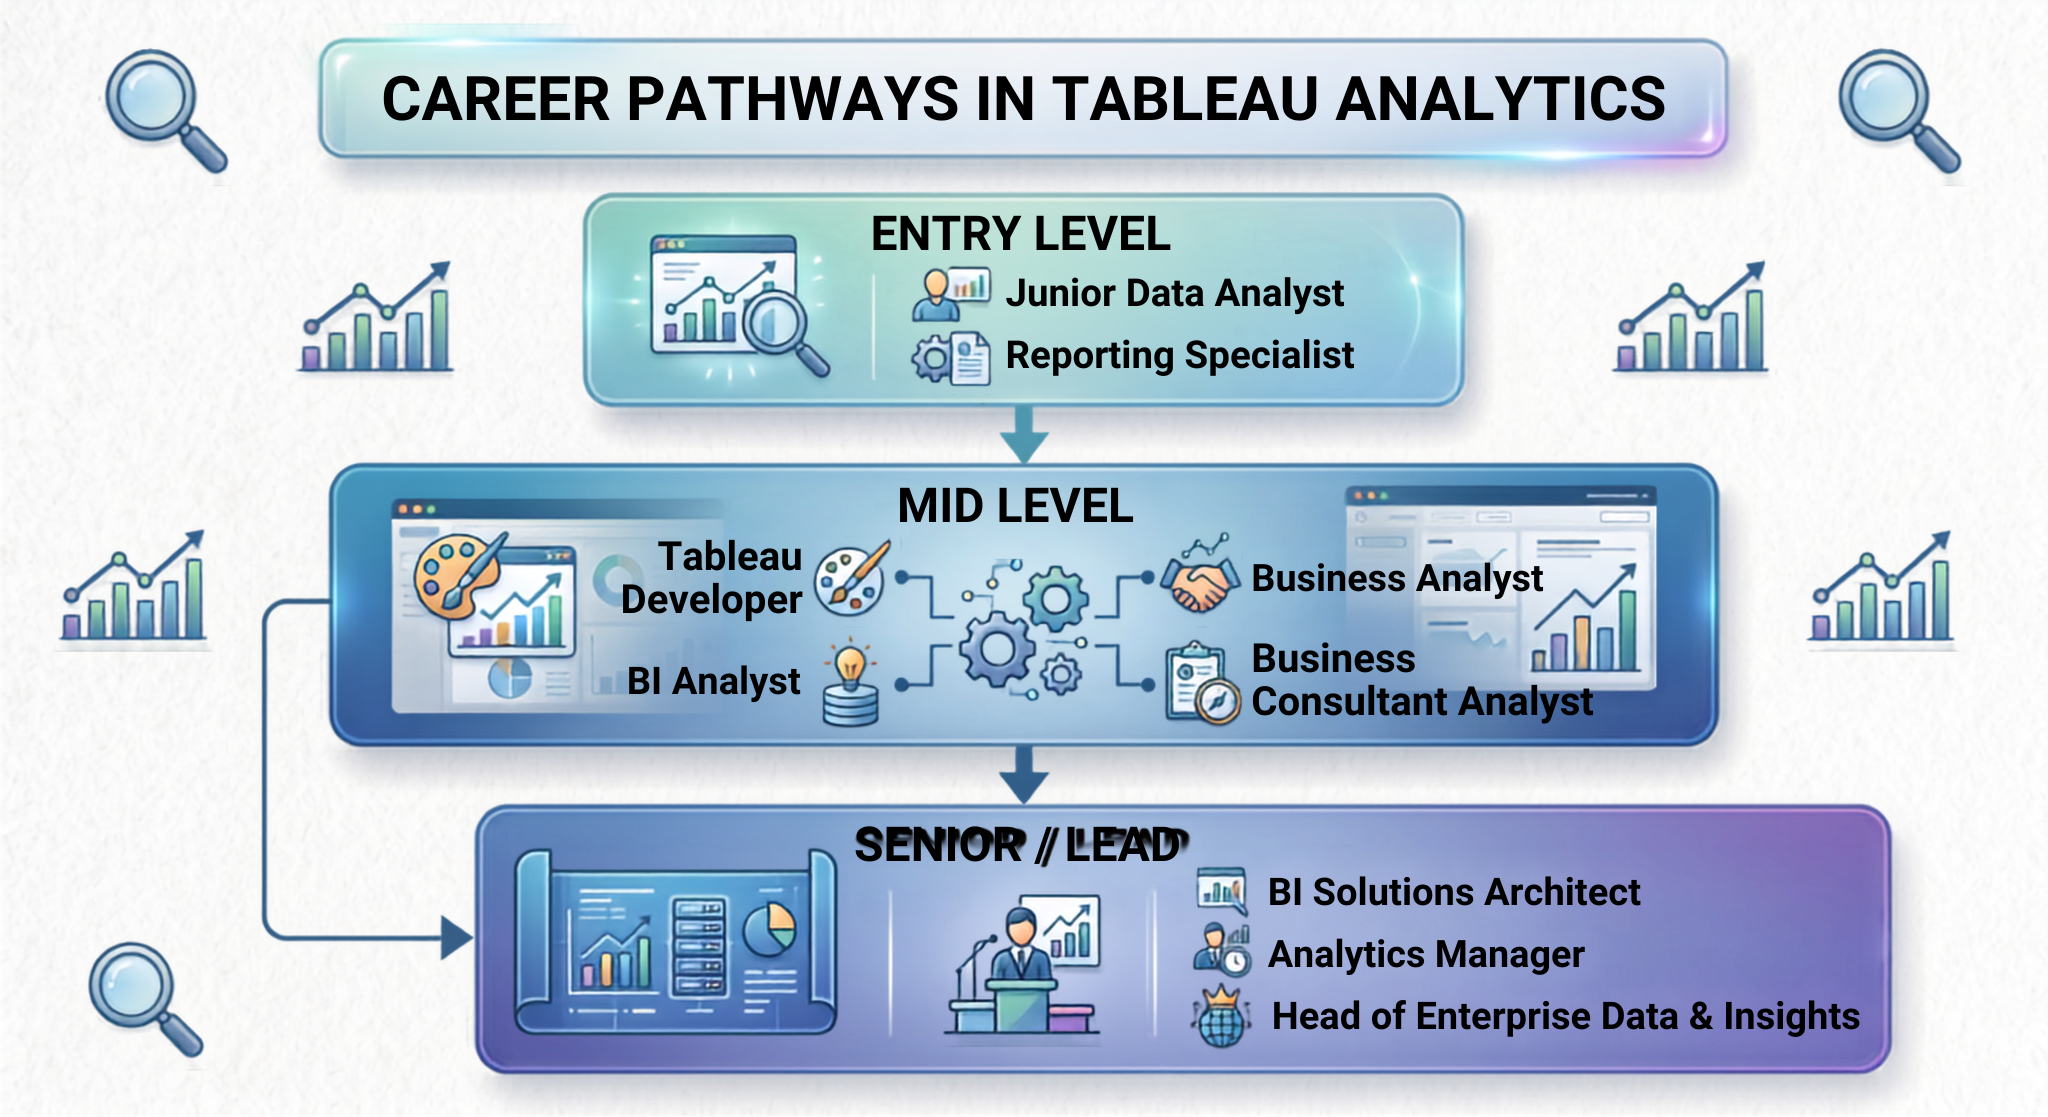
Path 1: Tableau Developer
1. Focus: Technical implementation of data pipeline and dashboard building
2. Key Accountabilities:
Establish very sophisticated expressions using level of detail (LOD) such as FIXED, INCLUDE, and EXCLUDE.
Enhance the performance of dashboards by reducing the time required to execute queries and preparing extracts.
Join Tableau with companies’ data warehouses including BigQuery, Snowflake, and AWS Redshift.
Support permissions of users and responsibilities for the site administration on Tableau Server and Tableau Cloud.
Path 2: Business Intelligence (BI) and Data Analyst
1. Focus on the data story and insights for that particular domain and support for the people making the decisions.
2. Key job responsibilities:
Interpret management business inquiries into measurable indicators
Conduct data investigation with Tableau and SQL
Write reports on operational data for finance, transportation, sales and marketing departments.
Path 3: BI Architect
1.Core: Corporate Information Systems, Data Modeling etc.
2. Key Responsibilities
Design data pipelines from raw transaction data to dashboards.
Establishing data governance, frameworks for security of data, and analysis of performance.
Managing Tableau Cloud deployment for thousands of concurrent users.
Integrating embedding applications of Tableau using REST APIs and Tableau embedding API.
Salary Expectations: General Analysis of Compensation
Since skills of Tableau specialists are directly connected to increasing profits of the company, salaries of Tableau specialists are in top levels of the technology and analytics sector.
Compensation note: Salaries can vary in accordance with the location of employees, level of experience, and technical knowledge.
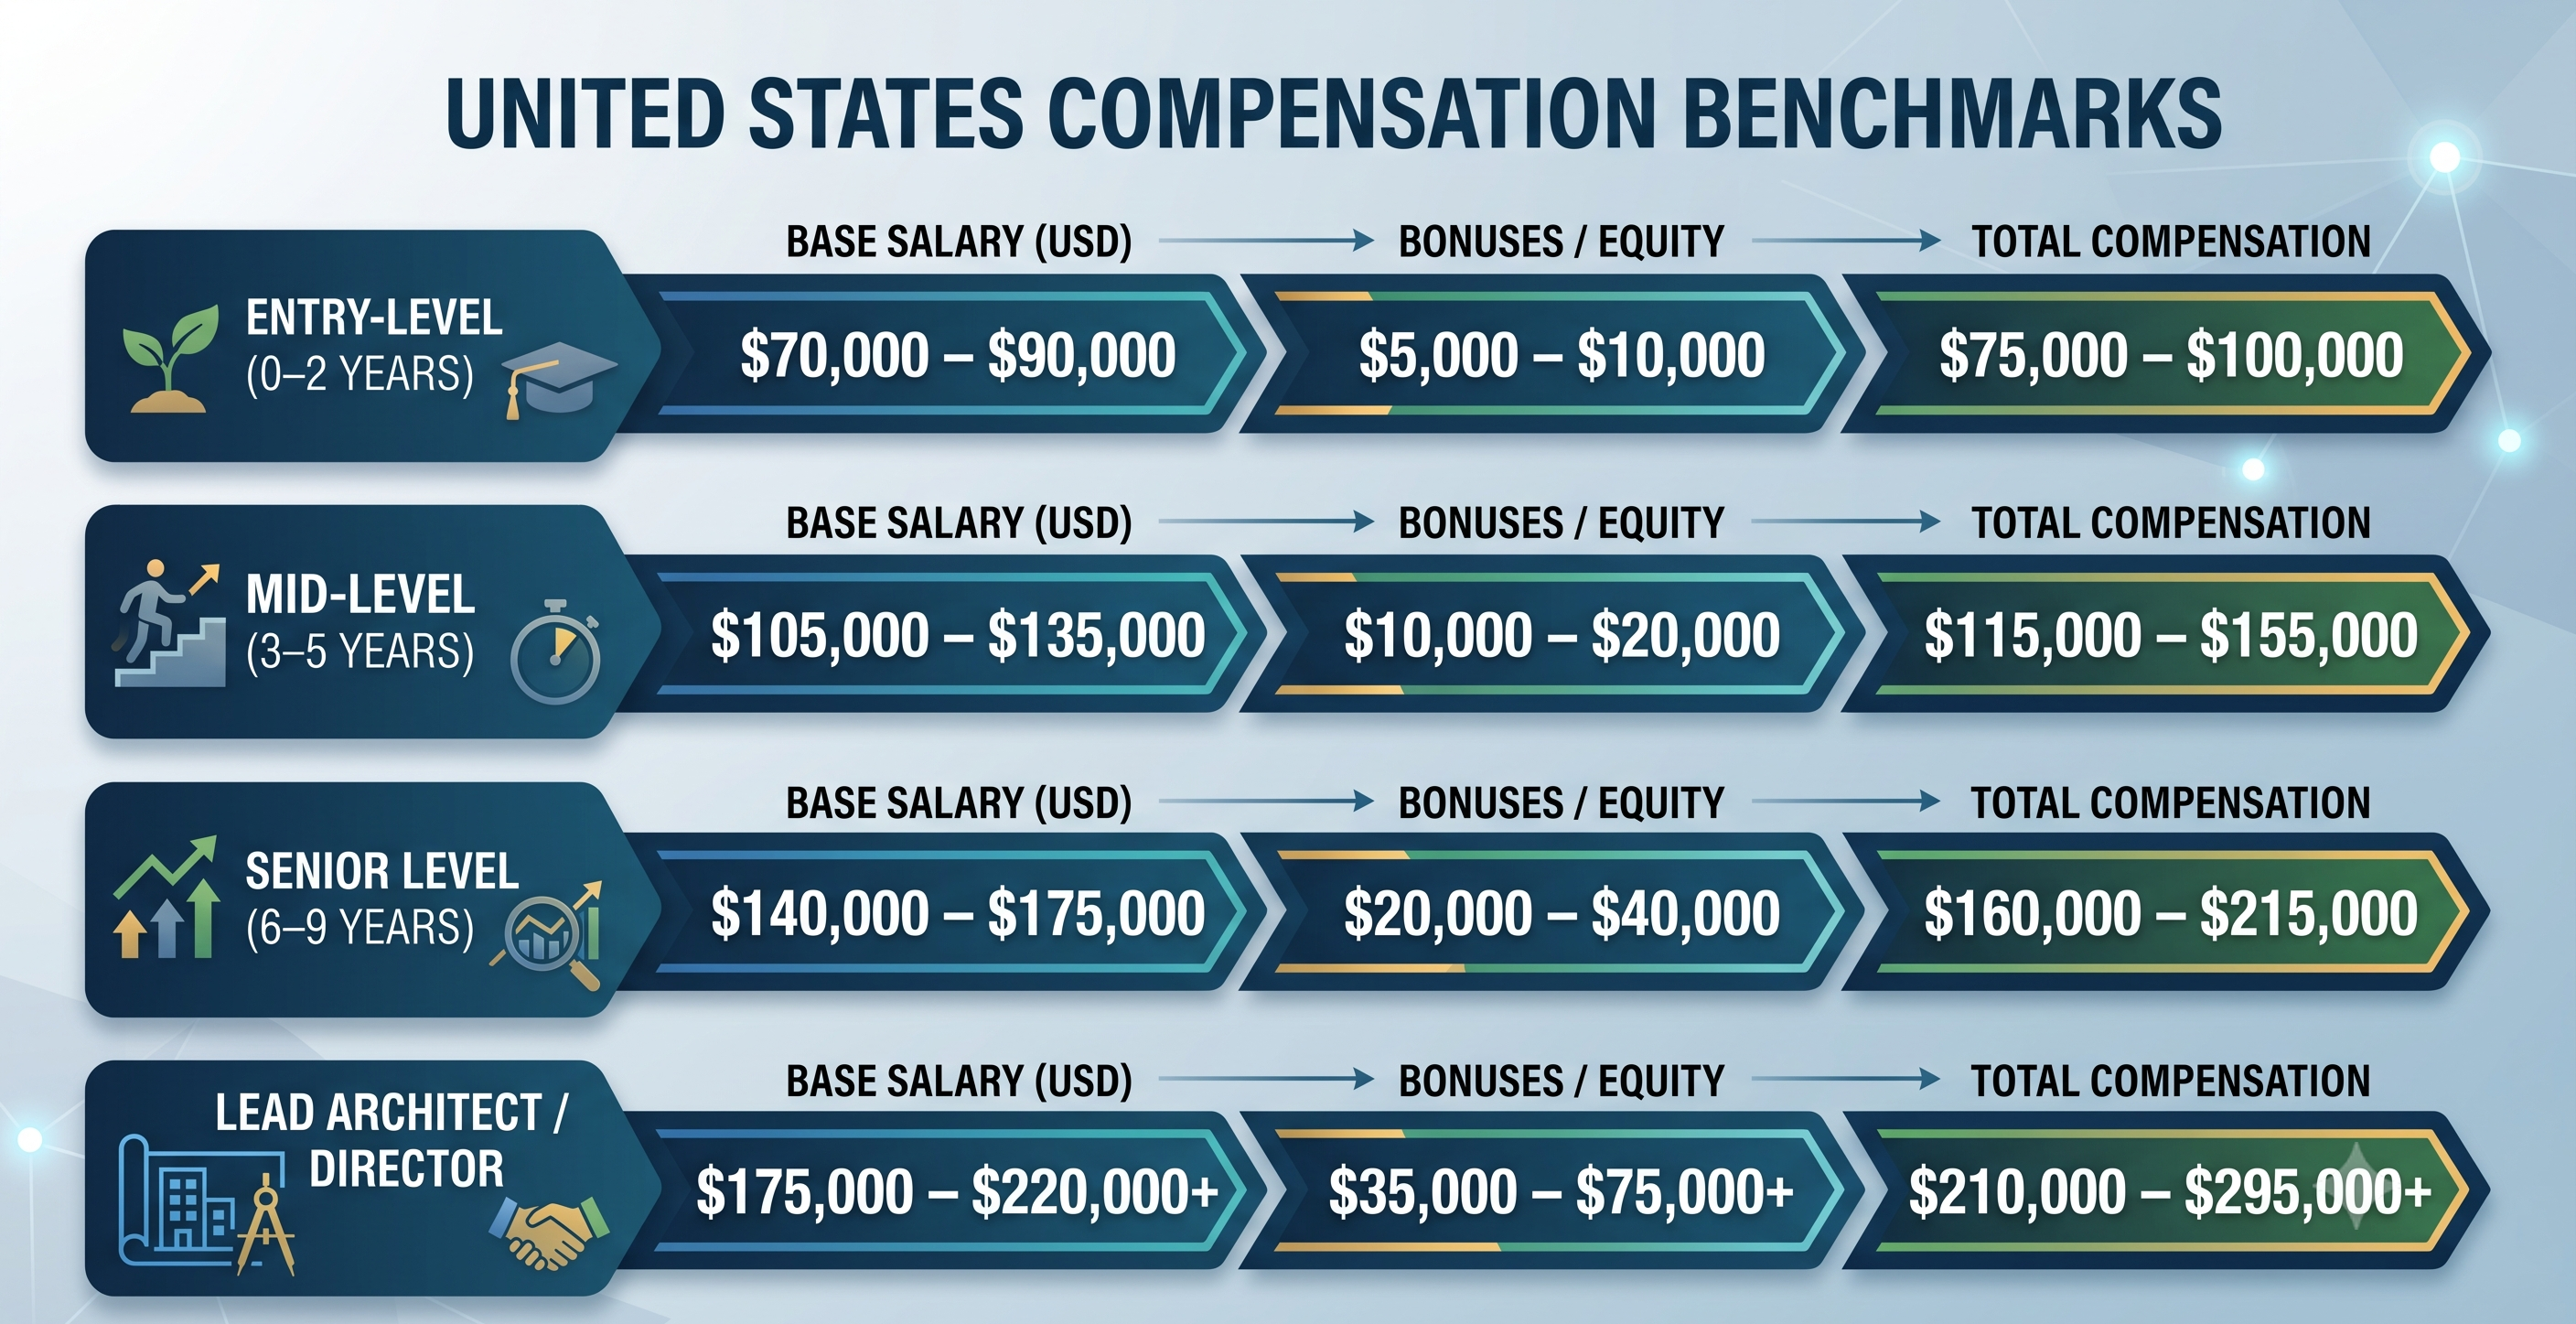
Expensive Tech Centers (San Francisco, New York, and Seattle): Senior Tableau Developers and BI Architects commonly receive total salaries between $180,000 and $240,000.
Remote / Mid-Priced Areas: Remote positions at the mid-senior level usually get paid a salary from $110,000 to $150,000.
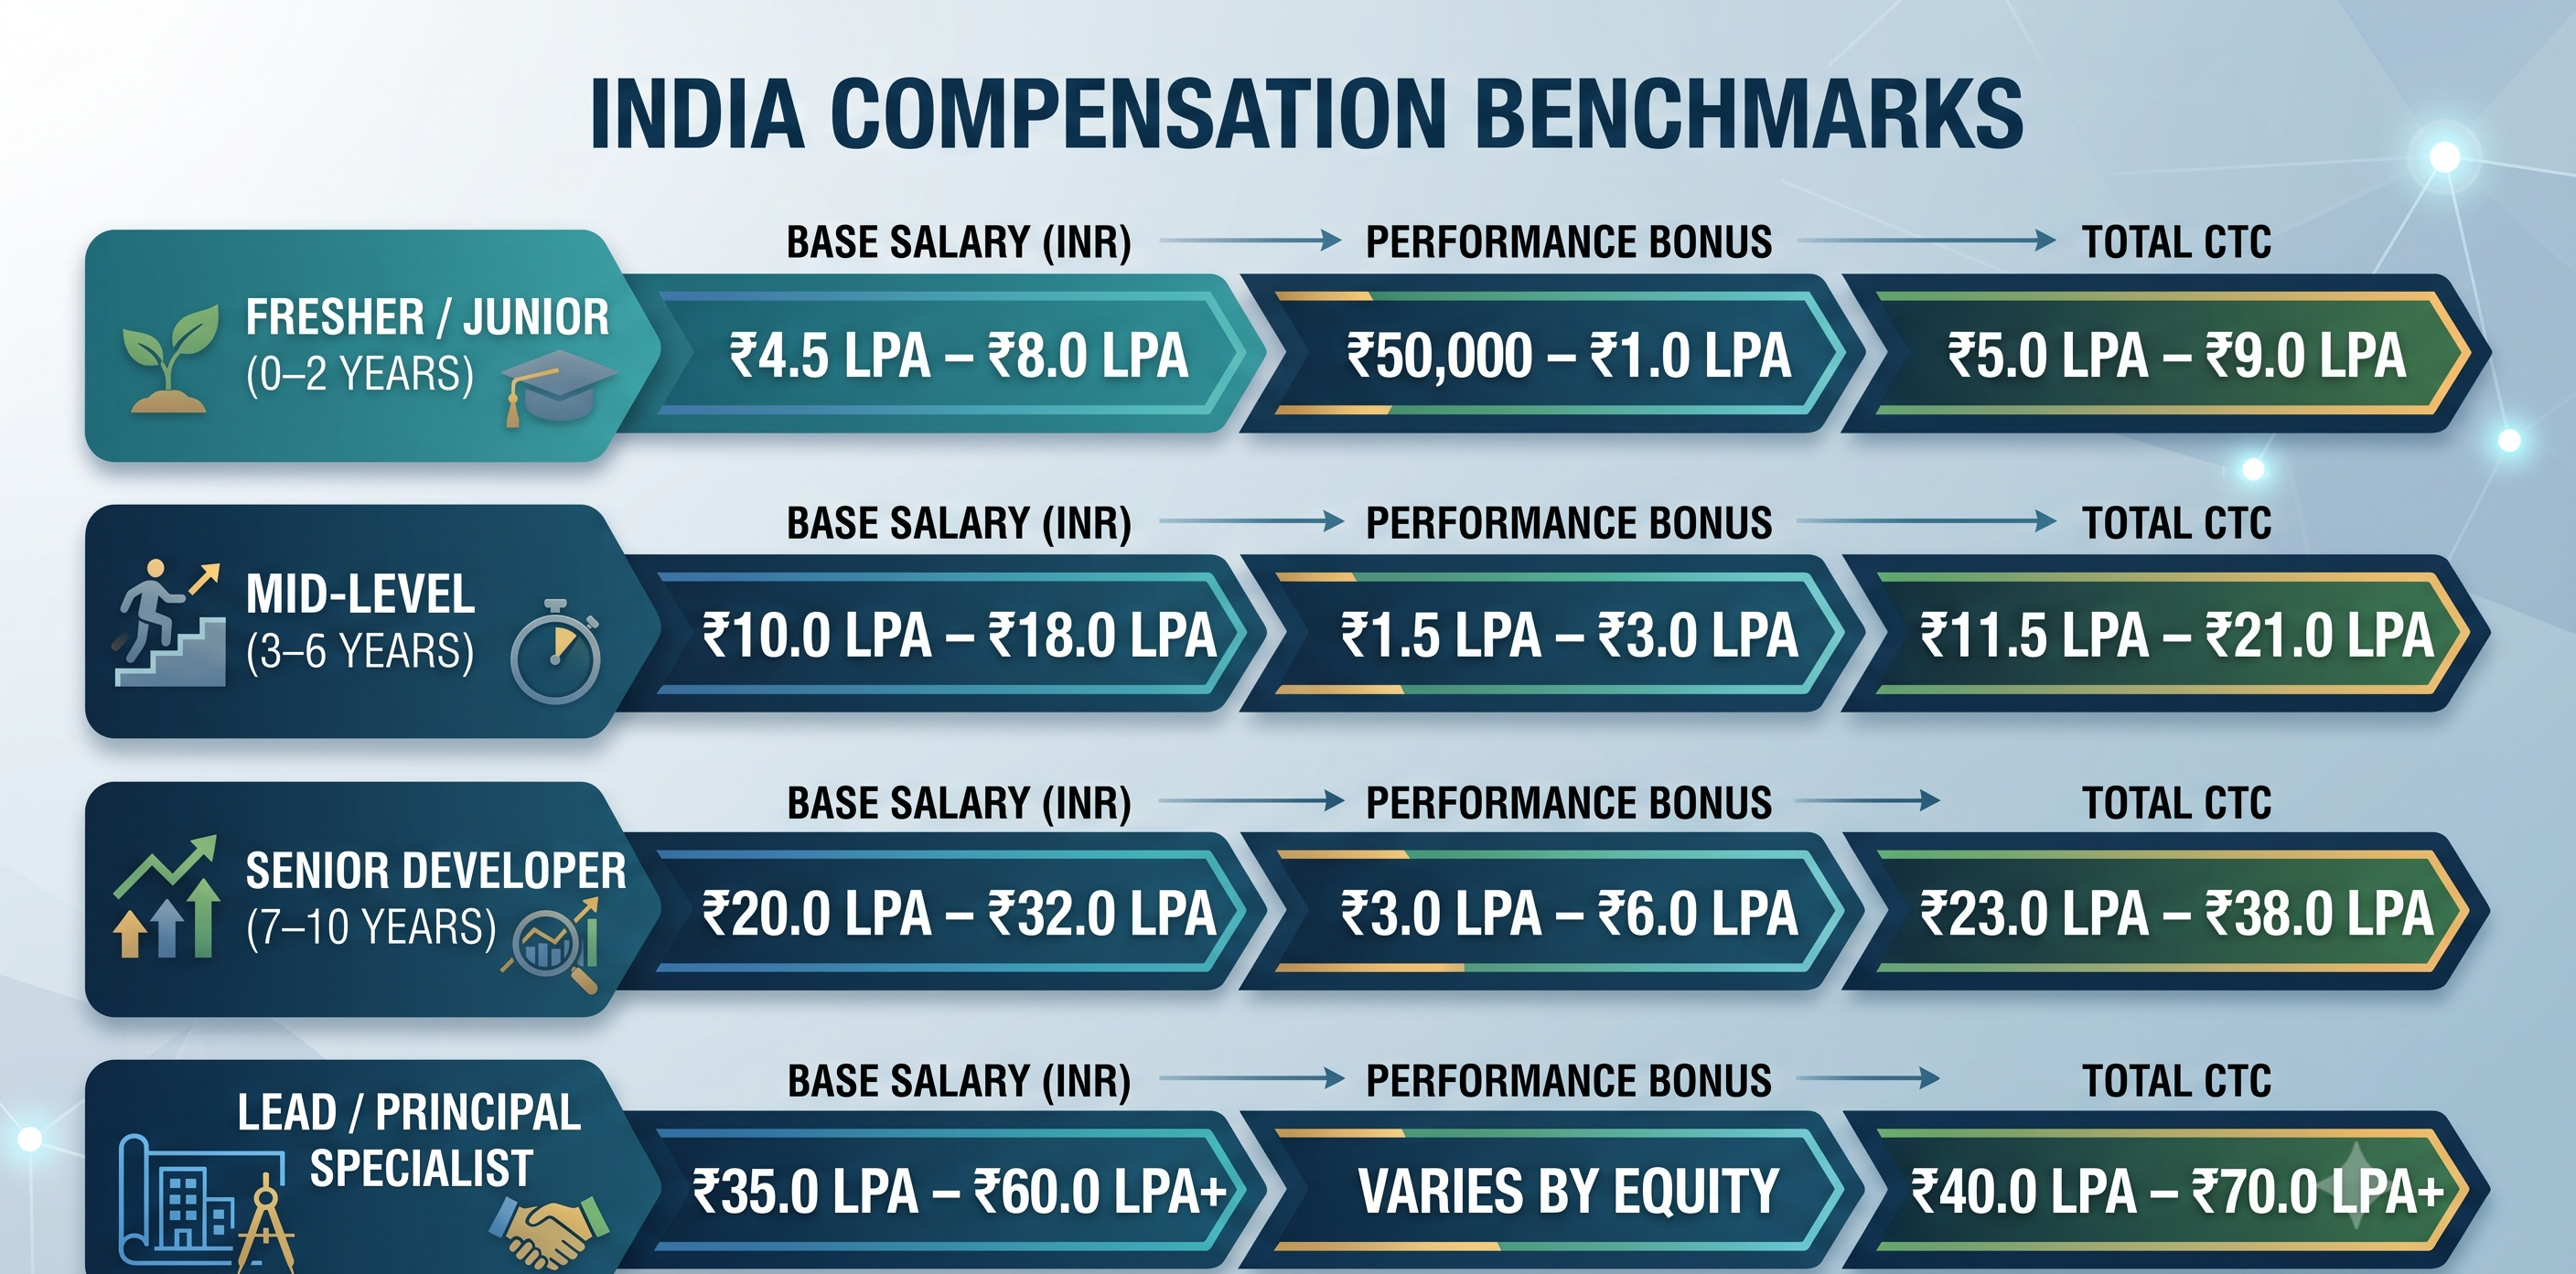
Main Tech Hubs (Bengaluru, Hyderabad, Gurgaon, Pune): Experienced professionals working in Global Capability Centers (GCCs), business (product) companies, or multinational firms (Deloitte, Accenture, McKinsey) have earning limits between ₹30 LPA to ₹50+ LPA.
European and UK Wage Benchmarks
United Kingdom: Salaries range between £45,000 to £65,000 for developers with mid-level experience, and Senior Architects can get between £75,000 to £100,000+ levels of salary in London.
Germany/ Netherlands: Salary range between €60,000 to €85,000 for mid-level data experts, and senior-level BI professionals can receive between €90,000 to €115,000+ salary levels.
Top Skills Needed to Get Well Paid
The ability to generate some basic graphs and pie diagrams is not enough to find a well-paying job. The specialists who know how to combine technical expertise with industry knowledge are well paid.
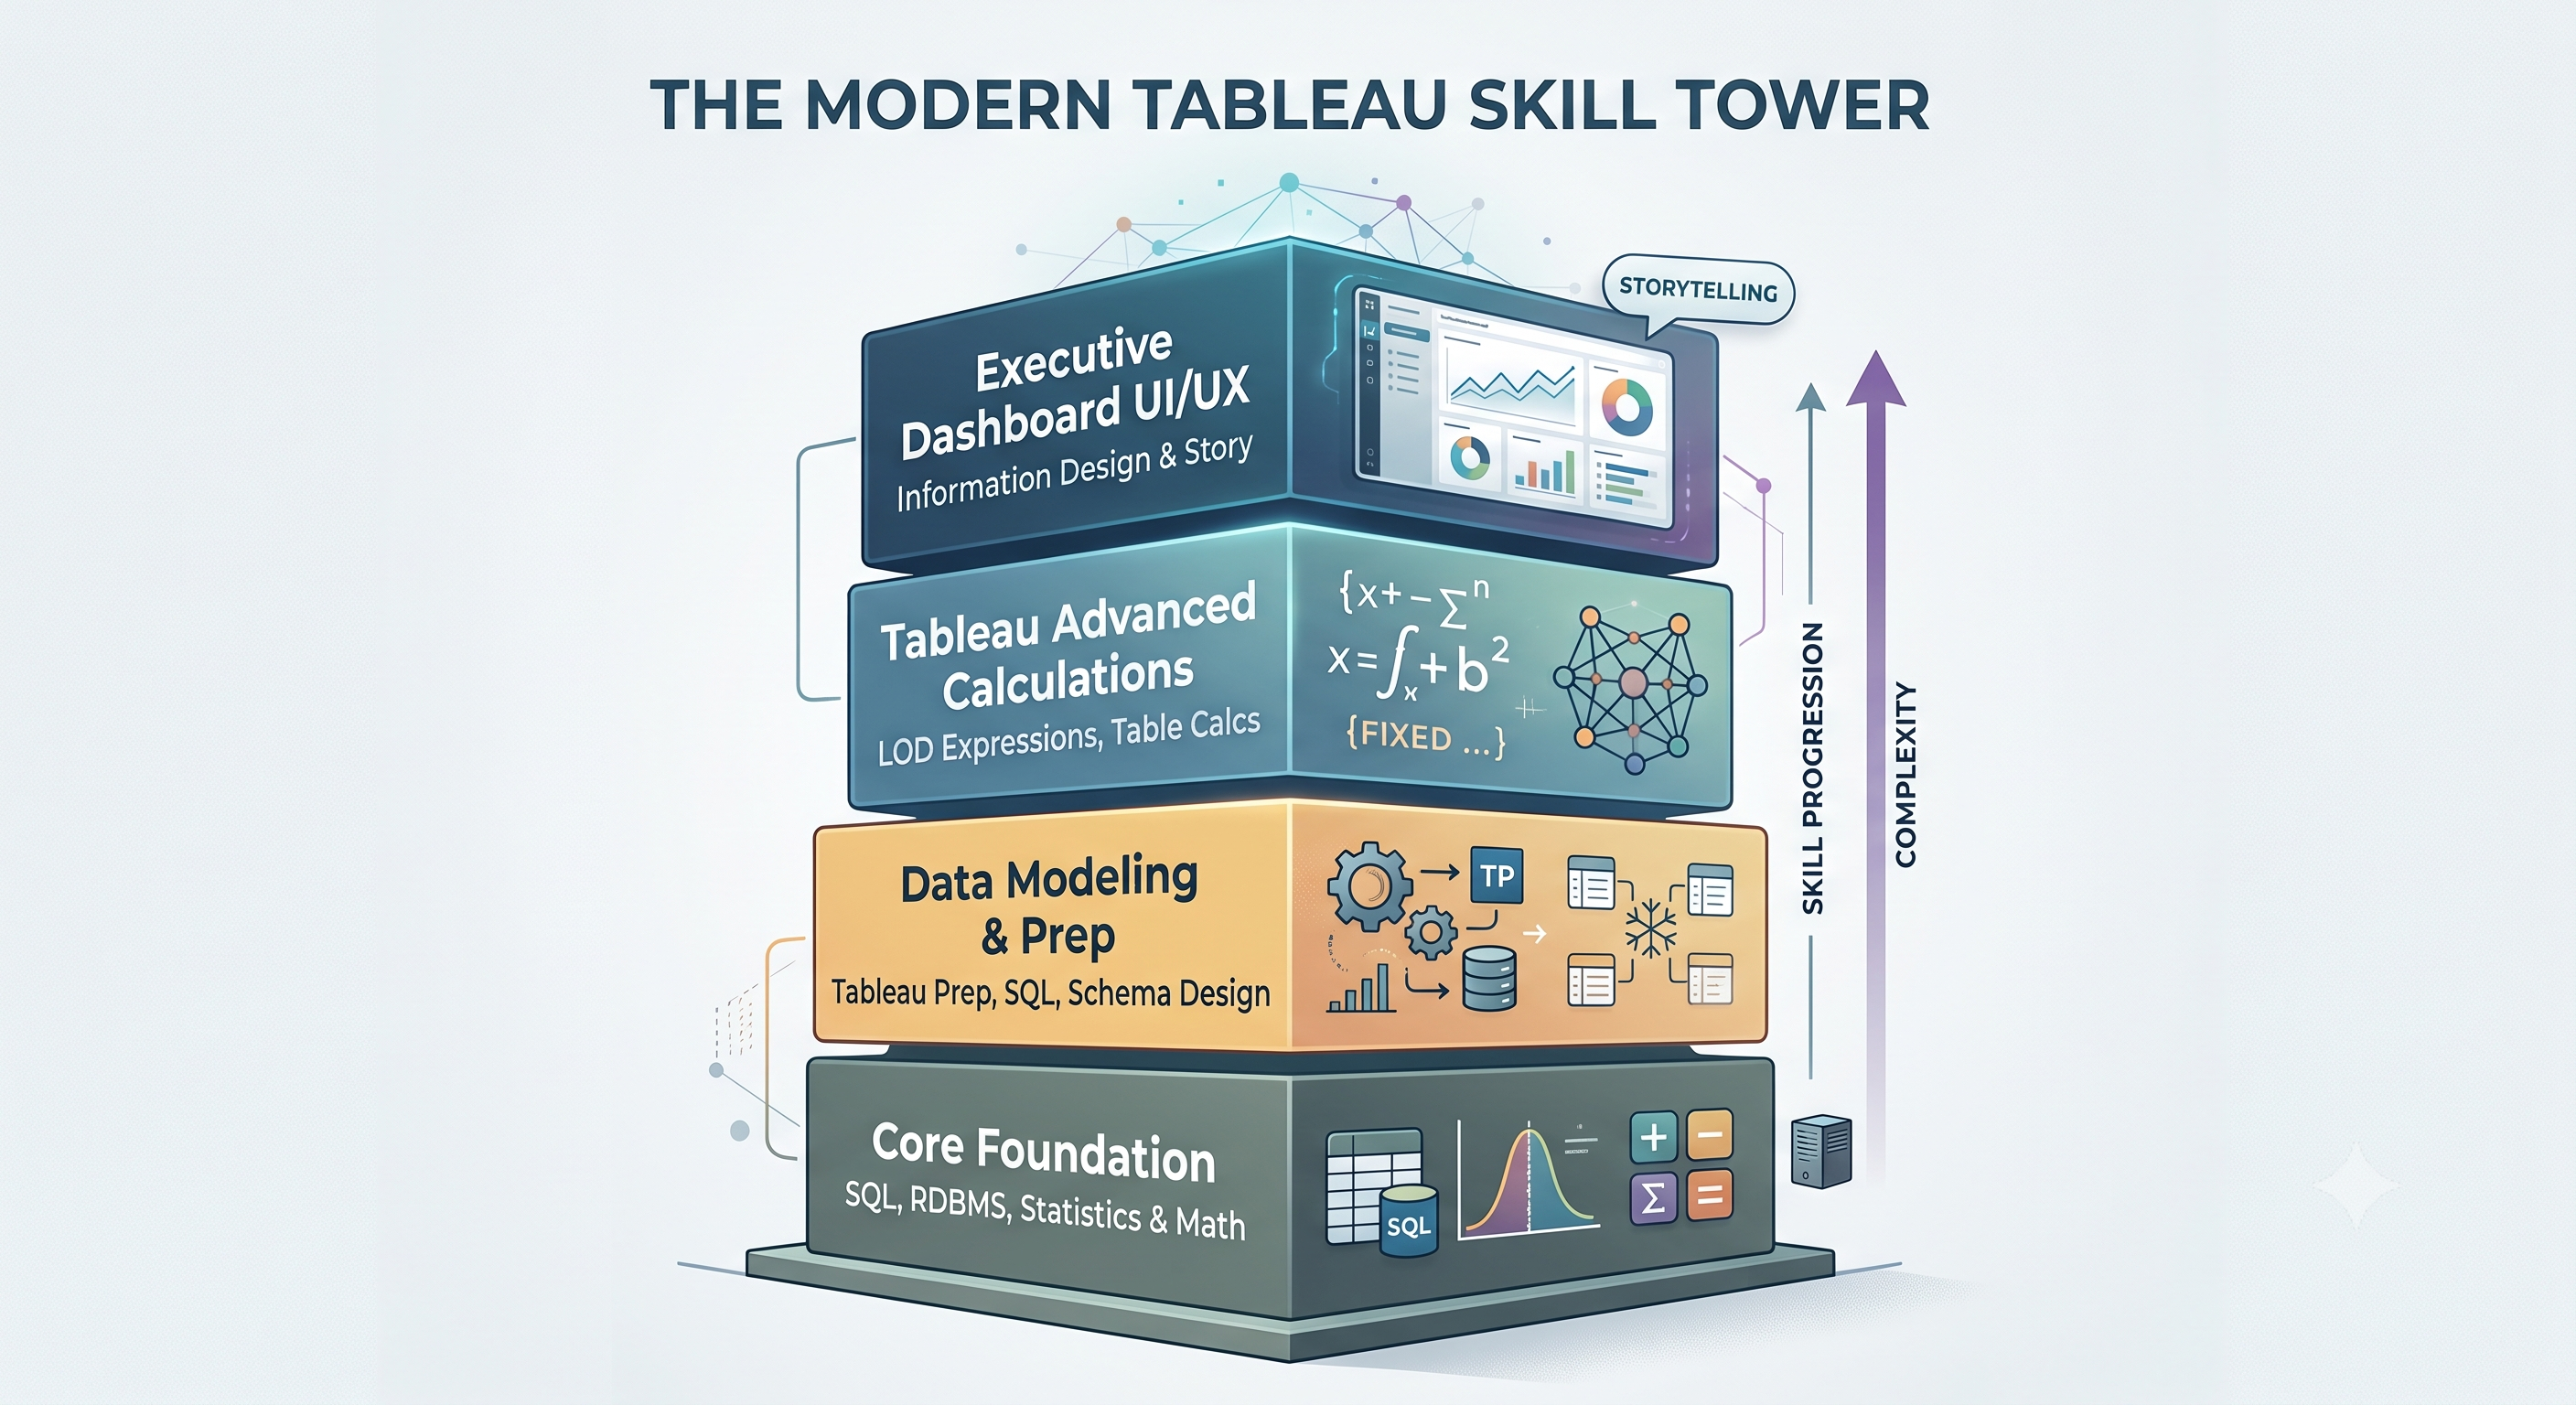
A. Tableau competencies
Level of Detail (LOD) Expressions: Knowledge of FIXED, INCLUDE and EXCLUDE calculations to summarize data differently than how it is displayed on the dashboard.
Table Calculations and Window Functions: Capability to understand address, partitioning, index, lookup, and running calculation types.
Dynamic Parameters and Set Actions: Ability to create dynamic interfaces that help end users to control visualization mechanisms without changing the way the dashboards look.
Performance Optimization: Indexing sources of data, optimization of extraction requests, limitation of contextual filters, and analysis of execution trees using Tableau Performance Recording logs.
B. Key Skills to Have
In order to enter the highest salary range in Tableau field, one has to combine Tableau skills with this technical knowledge:
SQL (Structured Query Language): The most important companion skill. Ability to write complex SQL links, Common Table Expressions (CTEs), subqueries, and window functions so that you could structure the data for Tableau.
Data Modeling (Star and Snowflake Schemes): Knowledge of fact tables, dimension tables, denormalization, and cardinalities (1:1, 1:N, N:M).
Data Preparation Solutions: The knowledge of the Tableau Prep Builder, Alteryx, or the use of dbt.
Cloud Data Warehouses: experience of using cloud storage systems, for example, Snowflake, Google BigQuery, AWS Redshift or Databricks.
Some knowledge of Python/R: Ability to write code in Python/R to create template models or for scraping web data.
Tableau vs. Power BI: Market Position and Cooperation
It is very frequently asked by students: "What is better to learn: Tableau or Power BI?
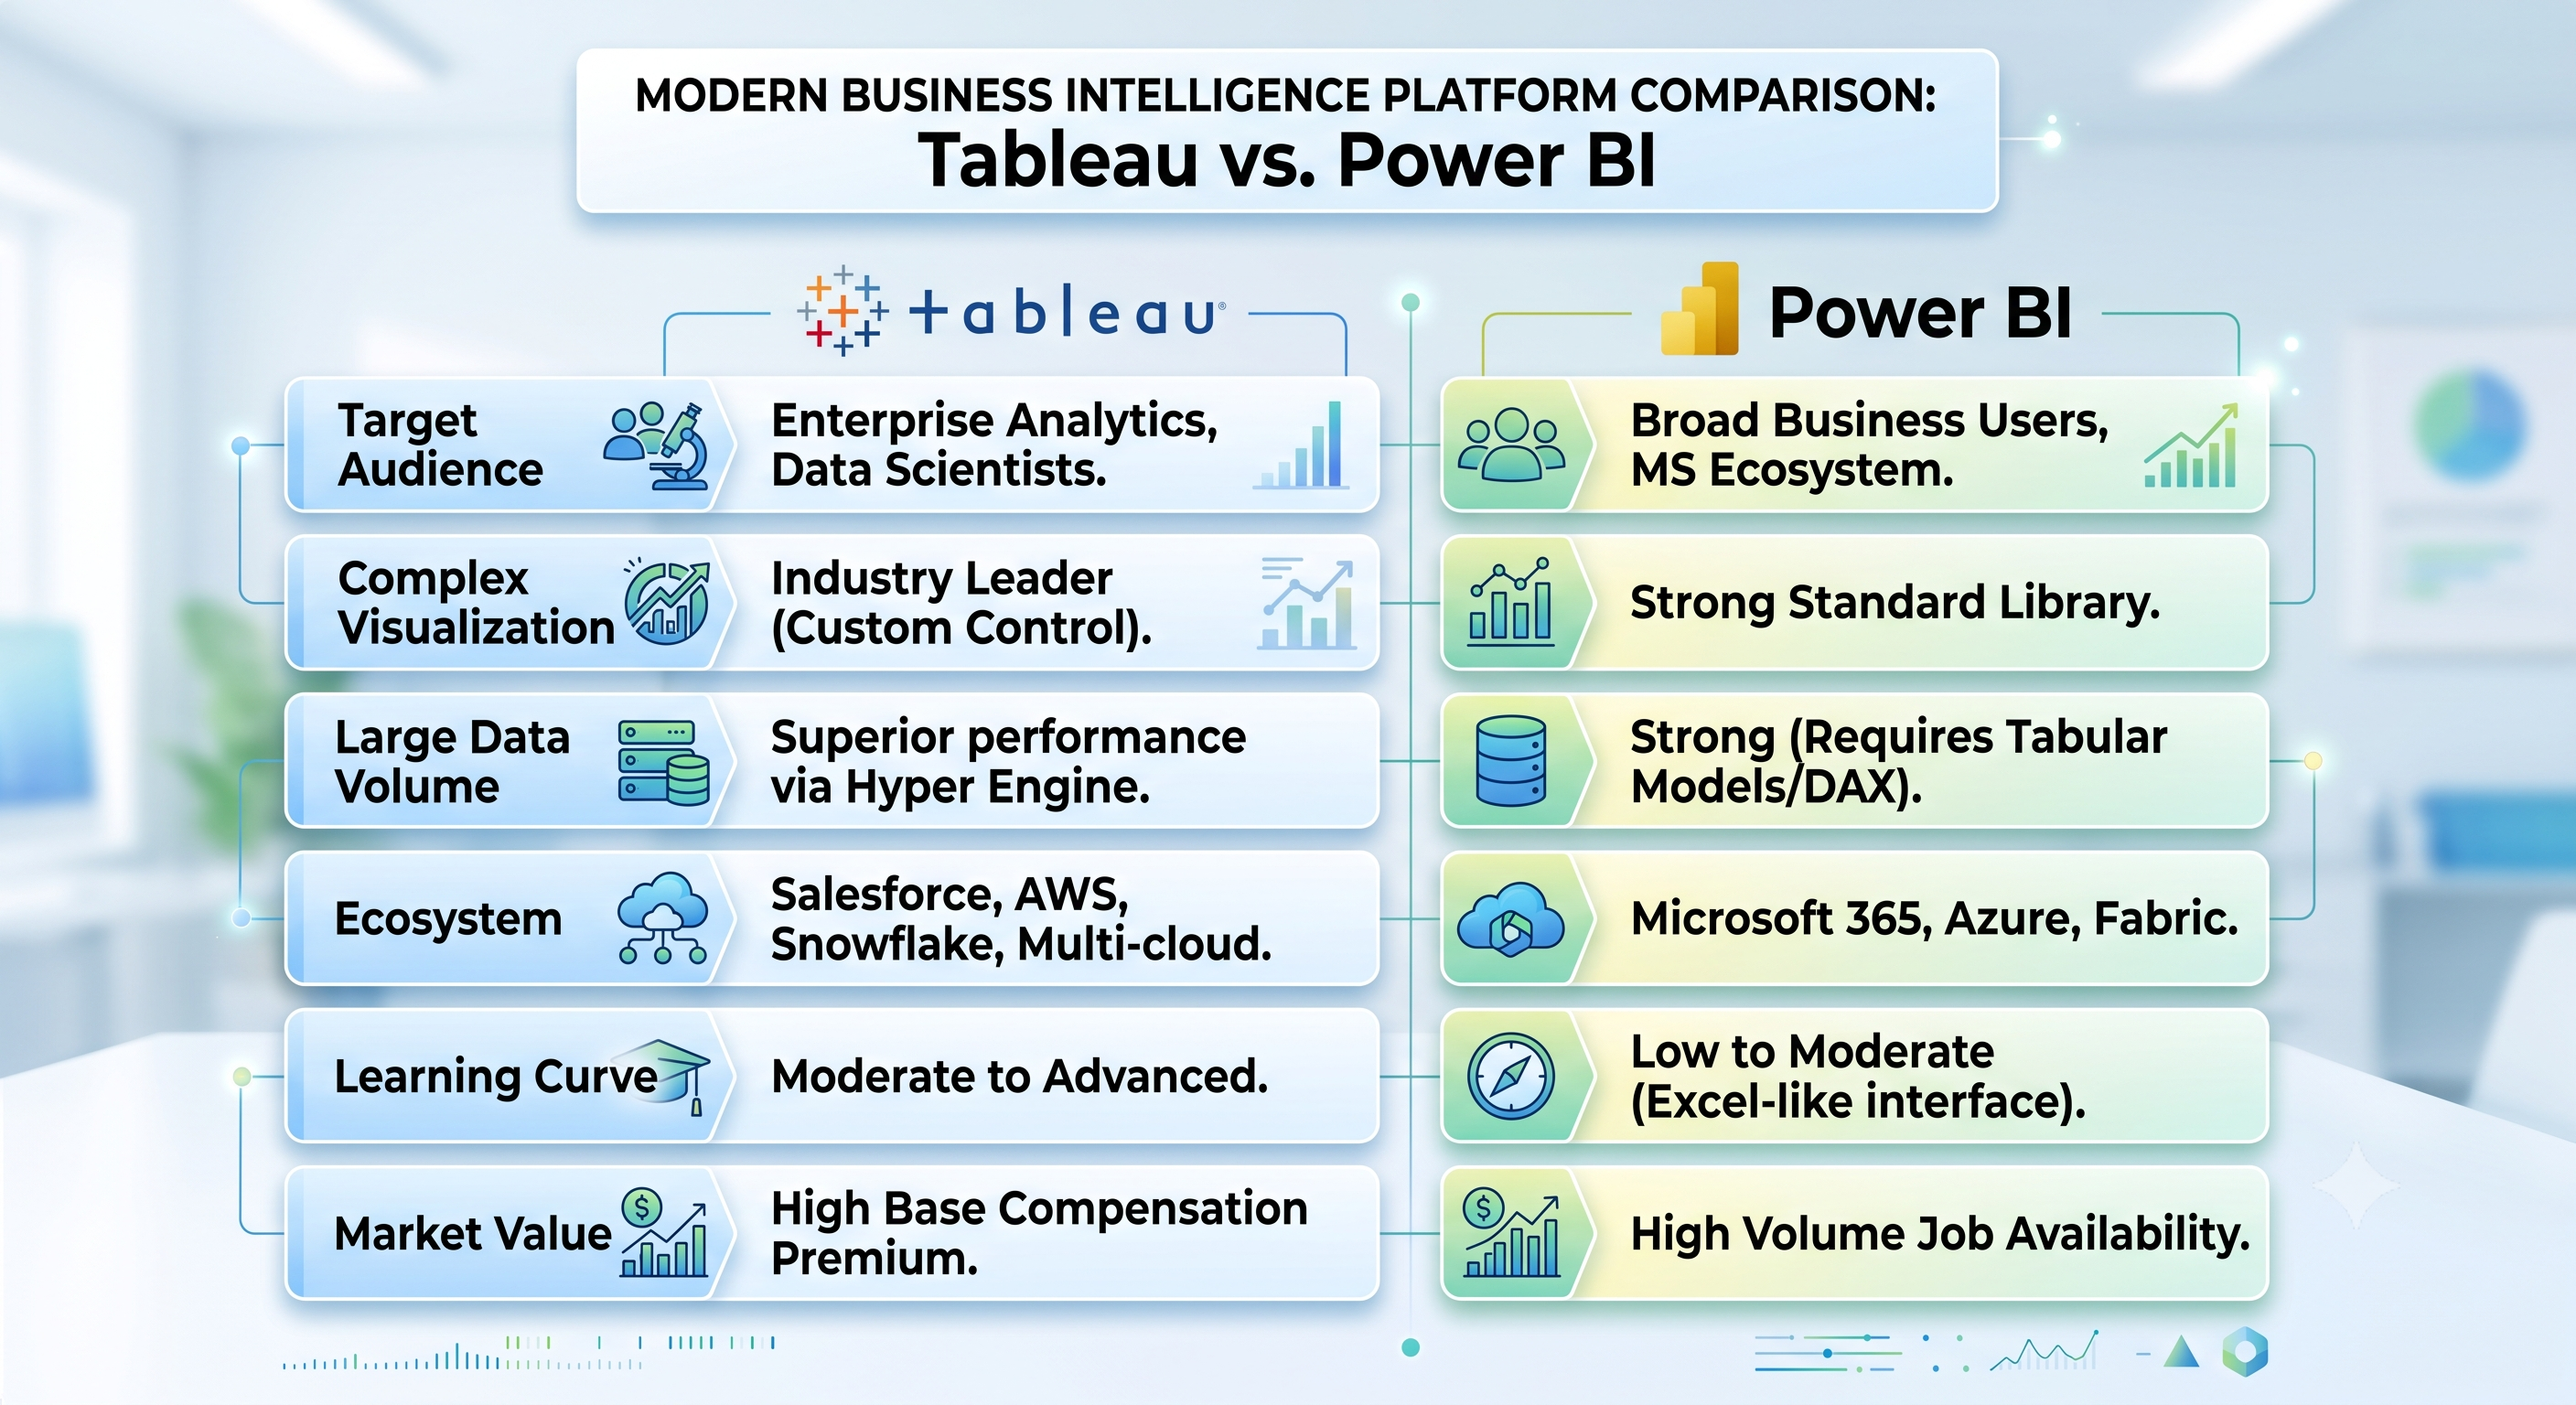
The Strategic Points
Microsoft Power BI stands out among many mid-sized businesses and companies using Microsoft platforms because of low costs associated with bundled services.
Tableau is the leader for enterprise business environments, Fortune 500 data analytics centers and organizations that need to prioritize exploratory depth of visualization, performance with big data sets and multi-cloud capability.
The Strategy of Using Two Tools: Learning Tableau first opens many doors in terms of understanding visualization theories and working with data. Getting from Tableau to Power BI becomes easier than the reverse. People who have knowledge of both tools allow firms to charge the highest fees for consulting services.
Learning Strategy: Move From Zero to Employment
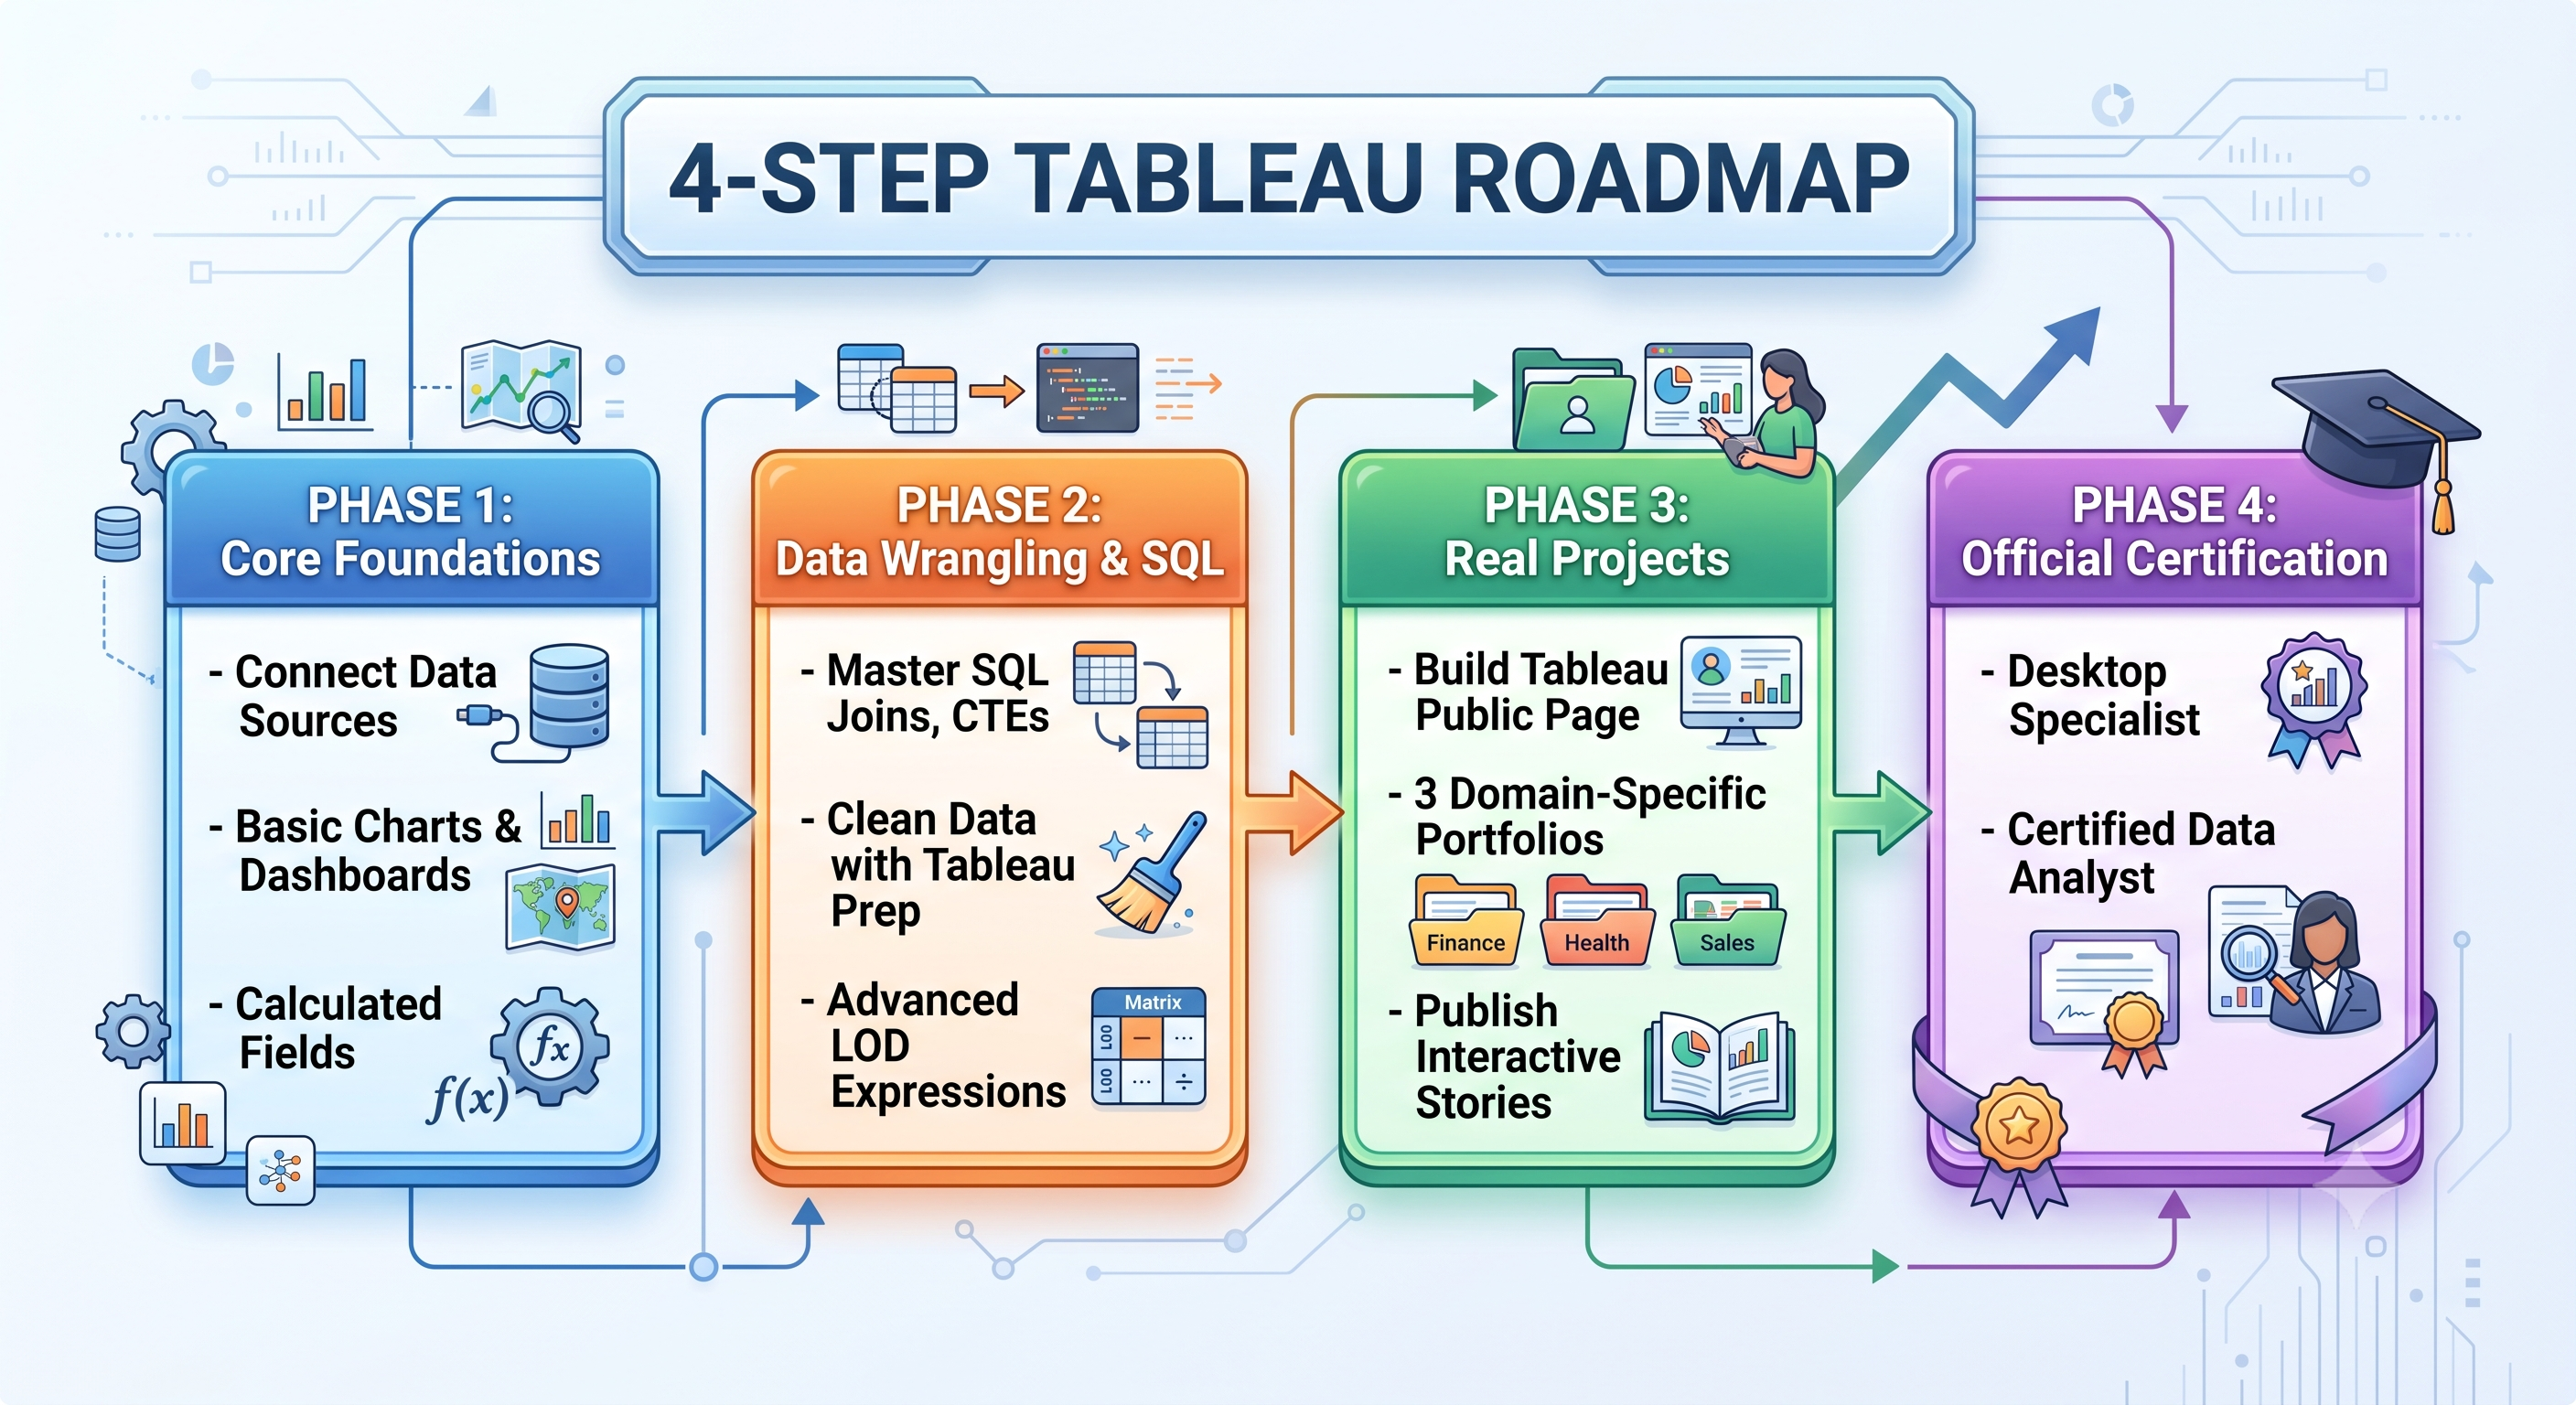
Step 1: Learn Key Principles
Become educated about types of data connections (such as in the example of Live Connection vs Data Extract).
Get to know basic chart types such as Bar Chart, Line chart, Scatter Plots, Dual-axis Charts, Treemaps, Heat maps, and Filled Maps.
Use main UI/UX principles (such as the F-pattern layout, spacing, and mood colors) to create
Step 2: Master Advanced Analytics
Writing complex logic statements
Learn about Level of Detail (LOD) calculations
Practice creating any SQL code to make sure you can clean and compile messy tabular data at the same time.
Phase 3: Create a Public Portfolio (Tableau Public)
A resume's bullet points can mean nothing when it comes to proving the candidate’s skill set since employers need to see the candidate’s work firsthand.
1. Set up a free account with Tableau Public
2. Design and publish a minimum of 3-5 real-world dashboards:
Executive KPI Dashboard: Track finances or sales-related data
Operational Tracking Dashboard: Track supply chain, logistics, or HR data
Creative/Explorative Storyboard/dashboard: analyzing the country’s public data like sports statistics, data about climate or data from movies.
Make sure that all the dashboards from your portfolio are clean and working.
Phase 4: Get Official Certifications in the Industry
Getting an official certification can help you prove your proficiency and get through the resume screening process:
Tableau Desktop Specialist: Good for newcomers as it checks main functions, connections, and chart creation. It doesn’t expire.
Tableau Certified Data Analyst: Industry-level certification for professionals that confirms advanced analytics skills, preparation of data, LOD statement techniques, mapping, as well as best practices for Tableau Cloud and server deployment. Constructed tableau classes online conducted with well-experienced teachers provide the best platform for the preparation of the certification.
Summary Checklist for Career Launch
In order to increase your worth in the job market and attract lucrative positions in business intelligence, you should take into consideration the following points:
Know Data Mechanics: Learn how to work with and understand SQL at all levels.
Go Beyond Simple Graphs: Familiarize yourself with functions like LOD expressions and table calculations.
Design for Decisions Learn the principles of good visual hierarchy and dashboard design.
Show, Don’t Tell Build and curate an interactive Tableau Public portfolio.
Get Certified: Showcase your professionalism and expertise with the Tableau Certified Data Analyst certificate.
Tableau is an effective instrument of transforming raw corporate data into actionable business ideas concerning strategic directions. In times of growing data volume globally, specialists, who are able to turn complicated data into clear visual stories, will continue to be in high demand in the market.
Get Certified Today: Get yourself a Tableau Certified Data Analyst certificate which validates your skills and knowledge. If you want to learn the tool from scratch, join our renowned tableau online training program now!
Top 5 advanced Tableau interview questions and detailed answers
1. Why is it important to understand this process for the design of complex dashboards?
Answer: The Tableau Order of Operations is the exact order in which Tableau performs filtering and formatting.
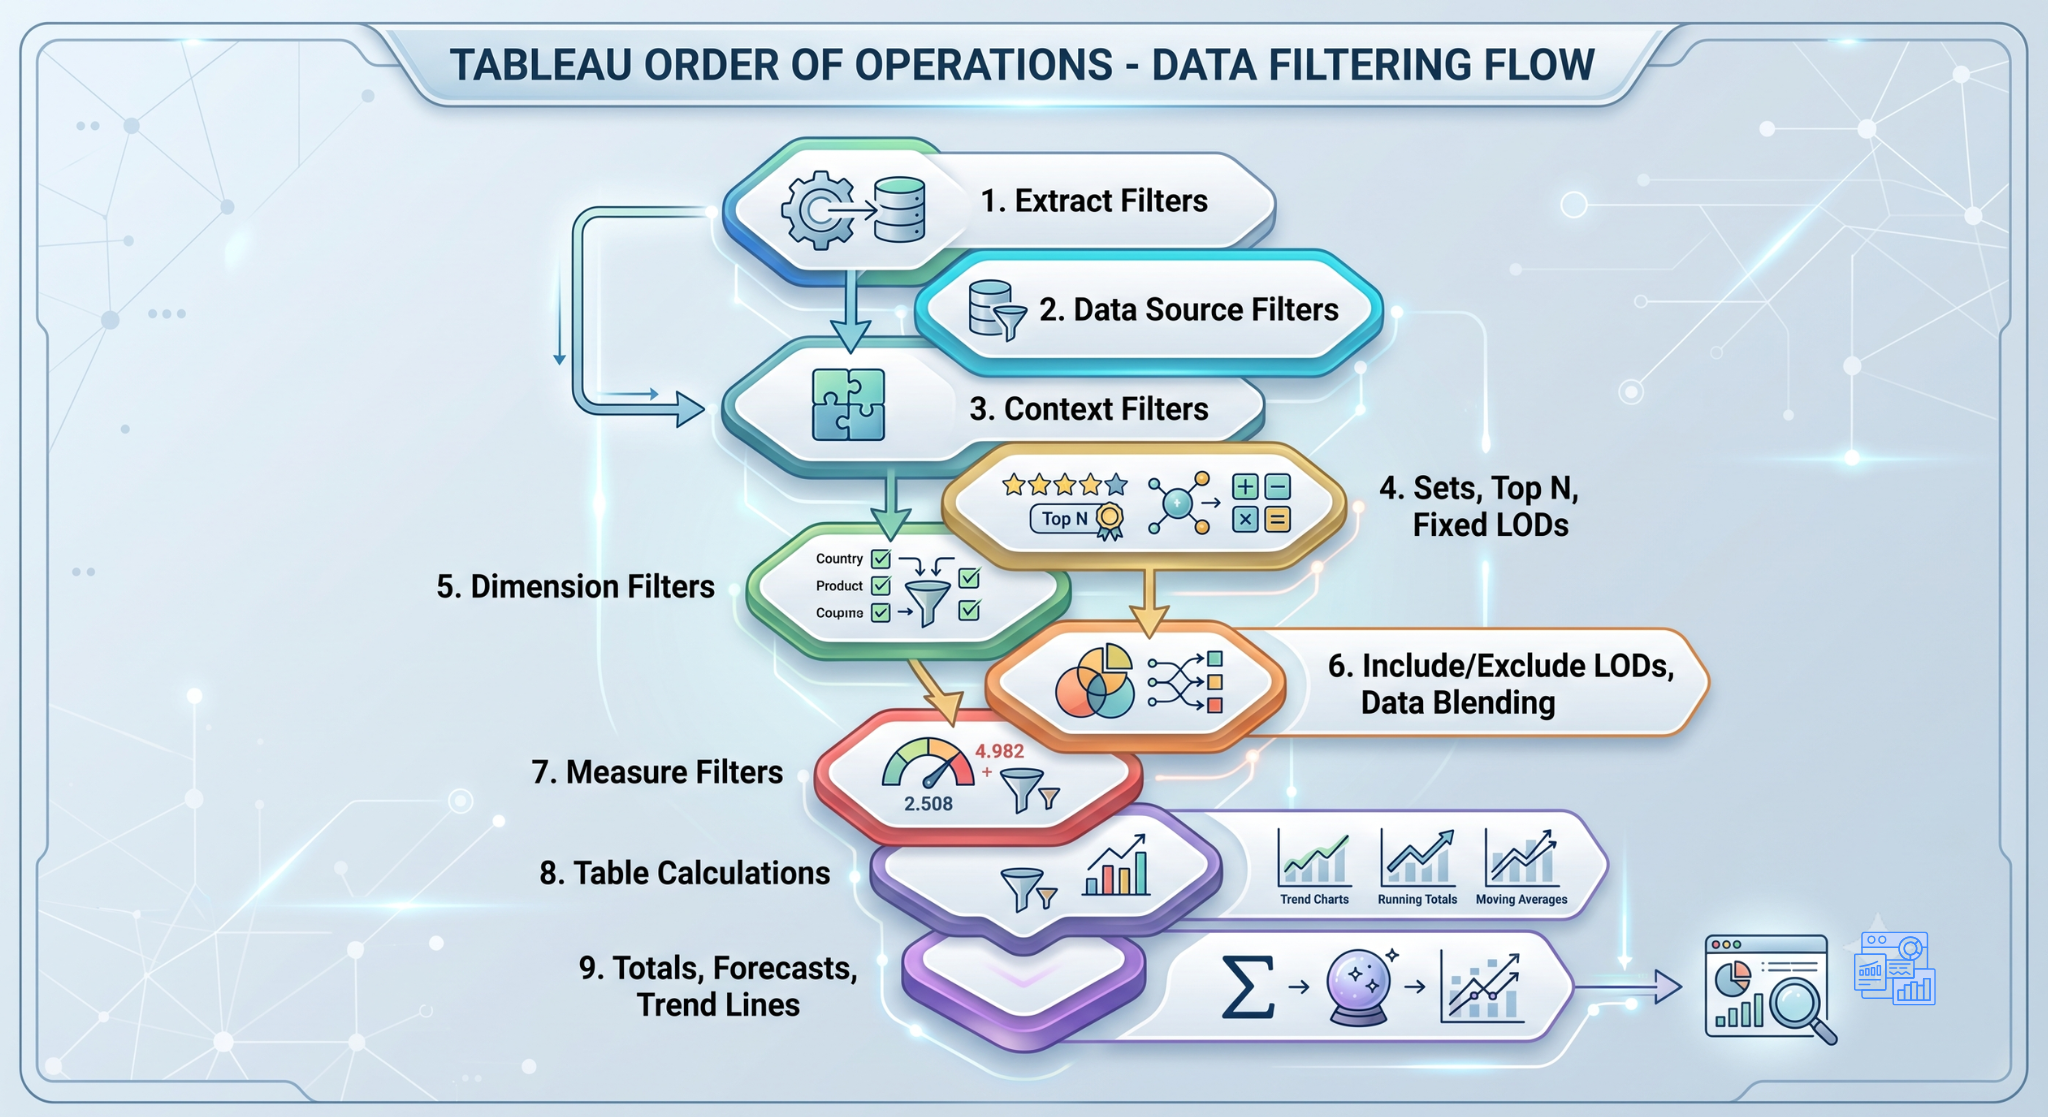
Importance for a Senior Developer:
Comparison of FIXED Level of Detail and Dimension Filters: FIXED level of detail function works on initial stage, while the normal dimension filter functions later on. For example, if the usual country filter is put on the dashboard, the FIXED level of detail calculated on global sales disregards the country filter, unless the country filter is placed into context.
Importance of Top N: For instance, if you want to find the top ten products in the eastern region, a regular region filter will be working after the Top N filter. As a result, you will get the intersection of the global Top 10 and eastern region. In order to obtain the actual top ten in the eastern region, you need to put the region filter into Context.
Importance of Table Calculation: The table calculation functions at the very last. Thus applying filtering to computation on table calculation does not delete the data frame and allows to get running totals and year-on-year percentage change using previous information without showing historical months.
2. In what way do FIXED, INCLUDE, and EXCLUDE LOD expressions function, and what is their relationship with level of detail of the view?
Answer: LOD expression enables a user to perform aggregations at a different level of detail than what has been chosen in the worksheet.
1. FIXED: The fixed aggregation only applies to the dimensions specified and not to what's available in the visualization.
Use Case: To get the cohort date of new customers you can use this expression: { FIXED [Customer ID] : MIN([Order Date]) }
Execution: The calculation takes place in a different query before any dimensions are filtered.
2. INCLUDE: This expression considers not only the dimensions mentioned in previous paragraphs but also the dimensions available in visual.
Use Case: This expression calculates daily sales average for states:AVG( { INCLUDE [Date]: SUM( [Sales])} ). Visual shows a particular state, however, thanks to INCLUDE, Tableau performs the calculations taking into account the state and the date.
Execution: This calculation is done after applying the filter.
3. EXCLUDE: The execution takes place only for the dimensions present in the visual.
Use Case: Deducing the regional contribution to sales taking the visual indicating cities.
Execution: This case illustrates how one can calculate dynamic percentages fairly simply without having to deal with table calculations.
3) Now, what is data densification in Tableau? What is the difference between Domain Completion and Domain Padding and how to deal with it?
Answer: Data Densification Tableau automatically generates and displays the missing data points or values to preserve the grid or to make sure that the visual features are continuous.
Domain Completion We have a couple of different dimensions on opposite sides (Rows and Columns). For example, if Dimension A has {1, 2} and Dimension B consists of {X, Y}, while there are only rows for (1,X), (2,X), and (2,Y) in data, Tableau will complete the domain by creating a cell for (1,Y) that shows a NULL value.
Domain Padding: This happens on a continuous scale of date/time or numeric bins. For example, if the data has January and March, and February doesn’t exist, if you check "Show Missing Values" Tableau will pad the domain to make trend lines and area charts continuous.
Managing or Stunting Densification:
Accidental densification results in higher-than-expected memory consumption, slower rendering of dashboards, and distorted calculations in tables (e.g., INDEX(), SIZE()).
To deactivate domain completion, shift dimensions to the Detail marks shelf rather than retaining them on the Rows and Columns simultaneously.
Clear "Show Missing Values" on a continuous date or bin field.
4. Discuss a complete process for identifying and improving the sluggish performance of a Tableau dashboard deployed in the enterprise.
Answer: The three phase audit is a structured approach to review performance. Recording, Data Engine optimization and Viz/UI optimization.
1. Perform Performance recording:
Access Help > Settings and Performance > Start Performance Recording.
Evaluate a workbook to point out the time required for: Executing Queries, Computing Layout, Rendering Marks and Data Blending.
2. Optimizations at the Levels of Database and Data Sources:
The use of optimized .hyper extracts is preferred whenever real-time operational monitoring is not an essential requirement as opposed to using live connections.
The use of heavy custom SQL views can be avoided by using physical database views, materialized tables, or Tableau relationships to avoid Tableau from wrapping customized SQL in sub-queries.
Make sure to remove any columns which are not in use from the data extract.
If raw event-level data is not required, then aggregated transactional information at the daily/monthly level could be used.
3. Optimizations at the Level of Worksheets and Designs:
Make sure high cardinality multi select dimension filters are replaced with parameter controls or wildcard search filters.
When using context filters make sure to do this cautiously as though context filters help in making the LOD logic more efficient, they cause Tableau to create intermediate data tables in memory.
Avoid use of maps or scatter plots with over 100,000 individual marks on screen.
5. What is the difference between Tableau's logical layer and physical layer? How do relationships sort out the data fan-out problem?
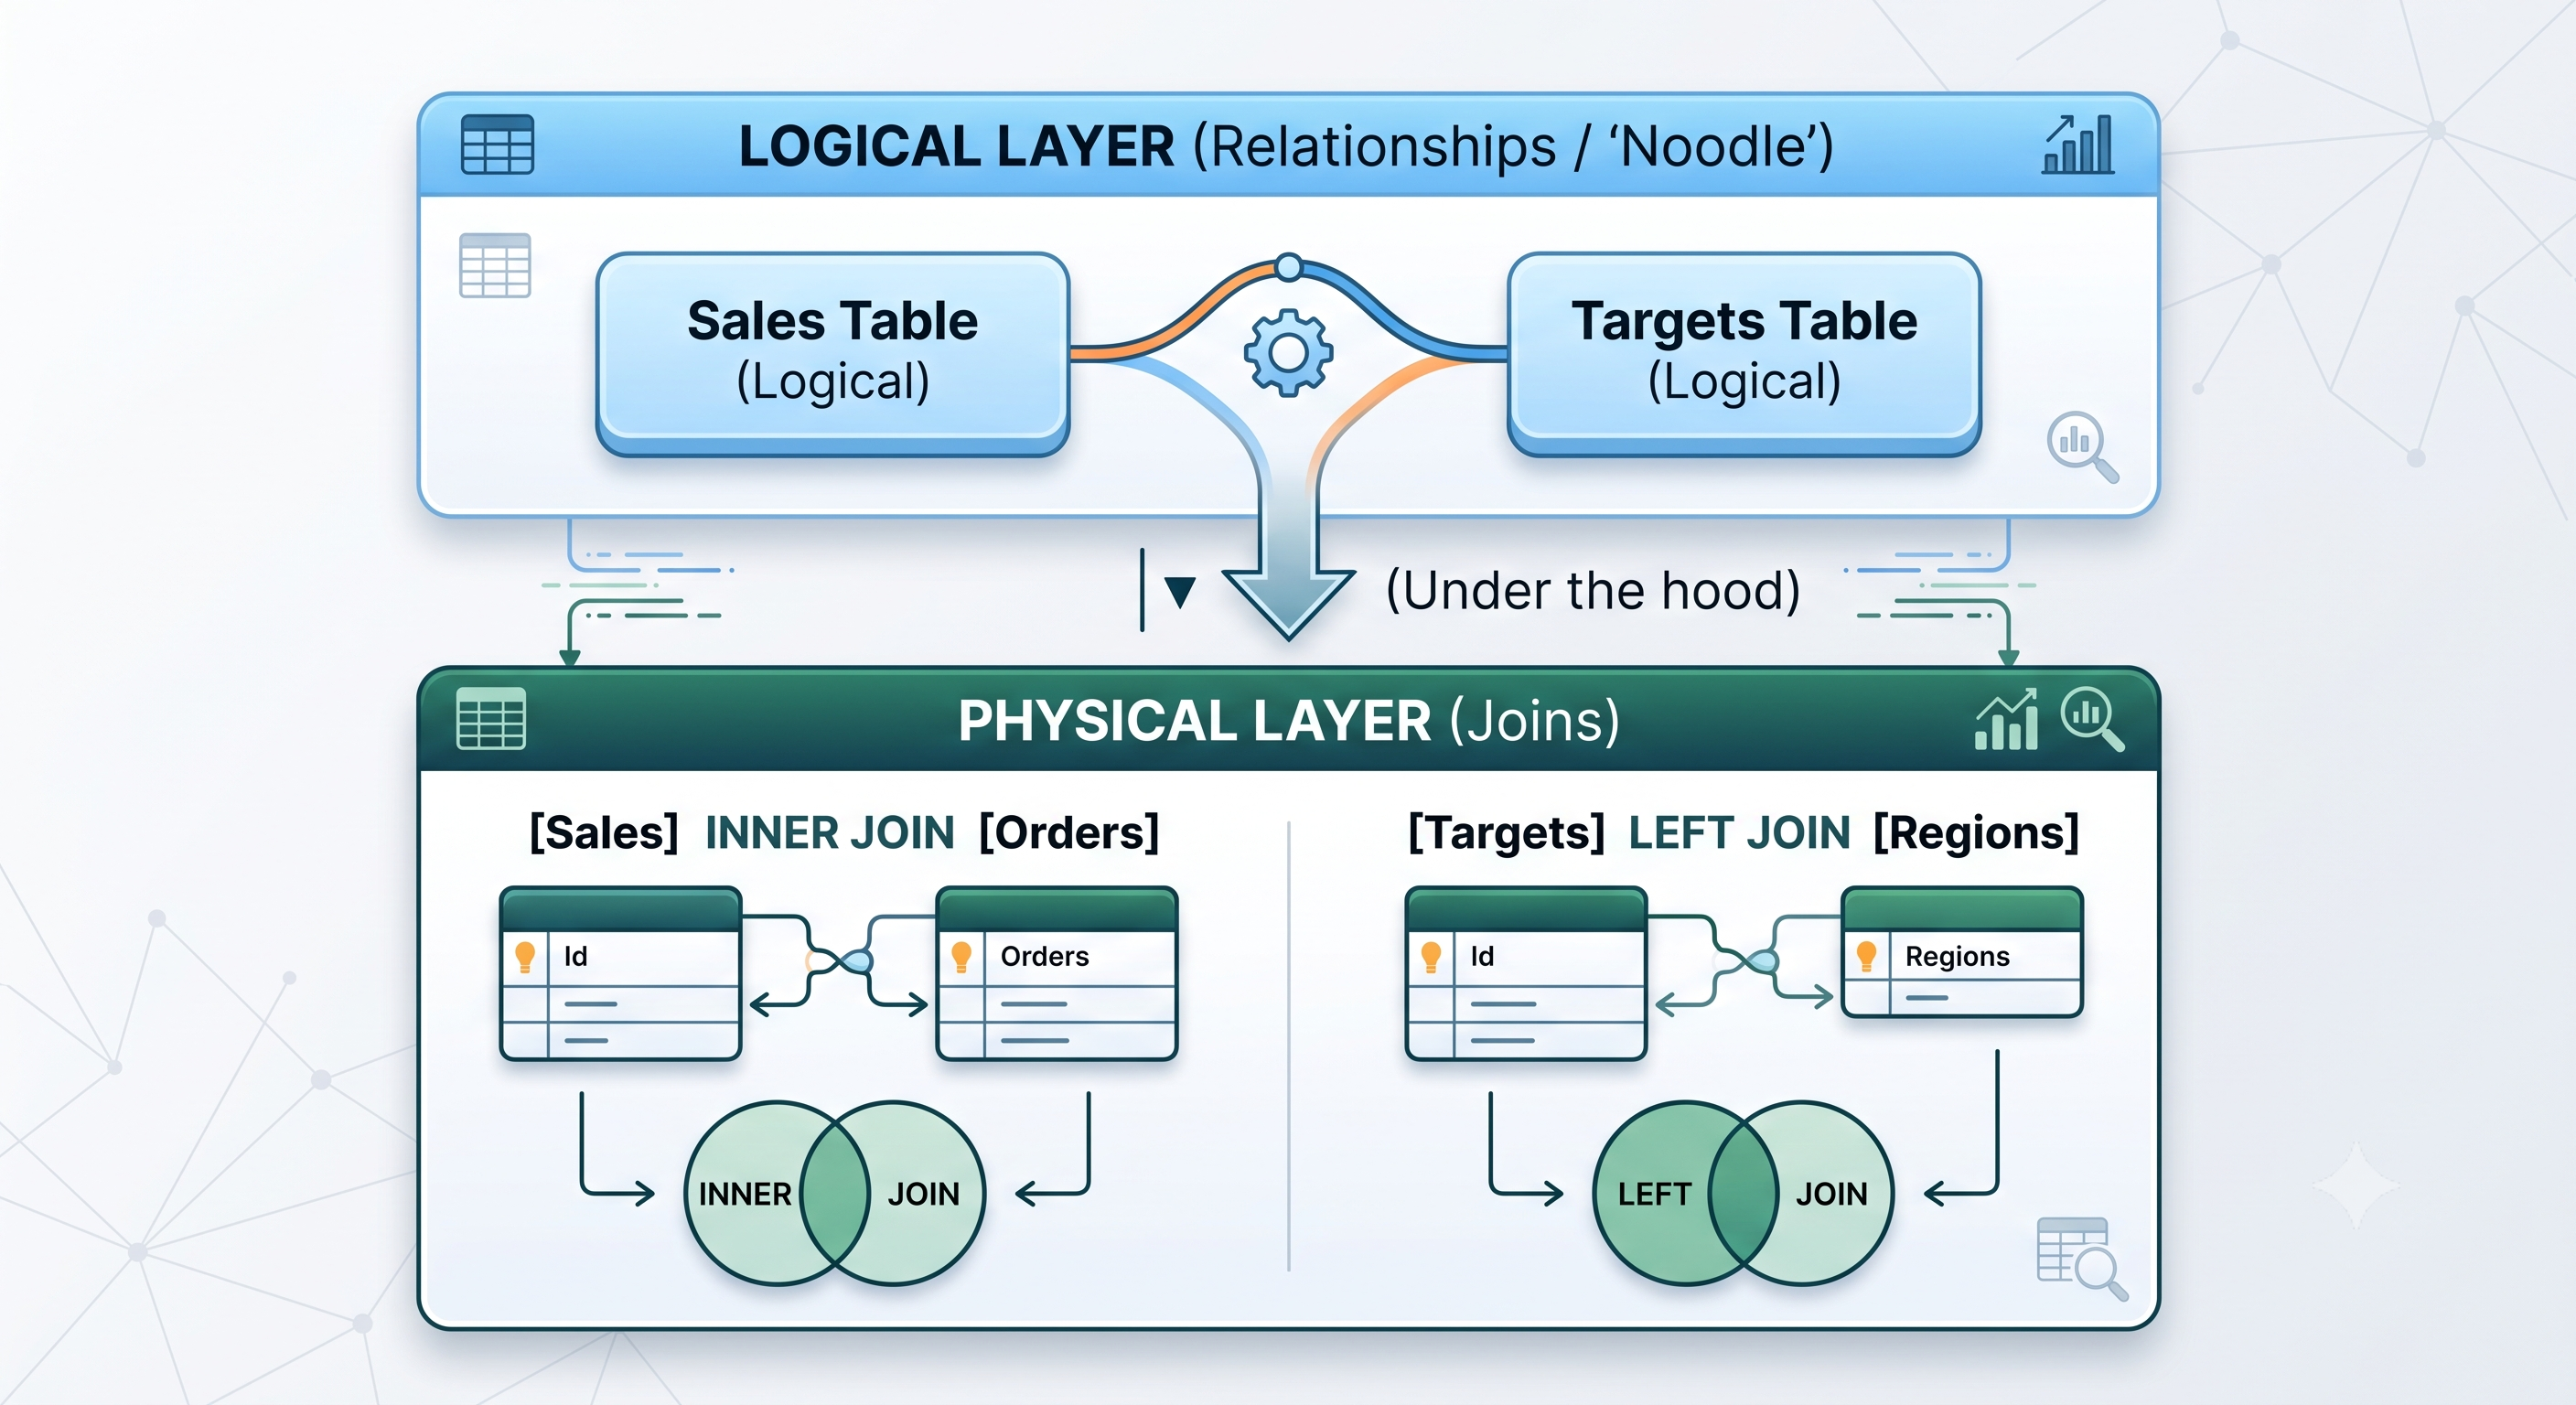
The physical links operator is used to connect various tables together before performing any type of analysis or calculations. For example, connecting one table containing information concerning the sales with another one comprising some details from a region will require the duplication of rows of the second table based on the number of lines in the sales table for every respective month (referred to as data fan-out). To prevent this duplication from happening LOD or AVG calculations have to be rather complicated and complex.
The role of relationships is to keep the tables apart within the computer’s memory. Tableau does not process tables at once but builds the important SQL JOINs according to the information provided in the active worksheet.
In this way, thanks to relationships data is aggregated before joining.
Are you prepared to qualify as a licensed Tableau Expert? Convert unrefined data into executive insights and enhance your career prospects. Get all the necessary online tableau training that will provide practical projects, certification guidance, and individual mentoring along the way.