
Your Power BI Numbers Look Right.. Can You Trust Them?
Last updated on Sep 28, 2026
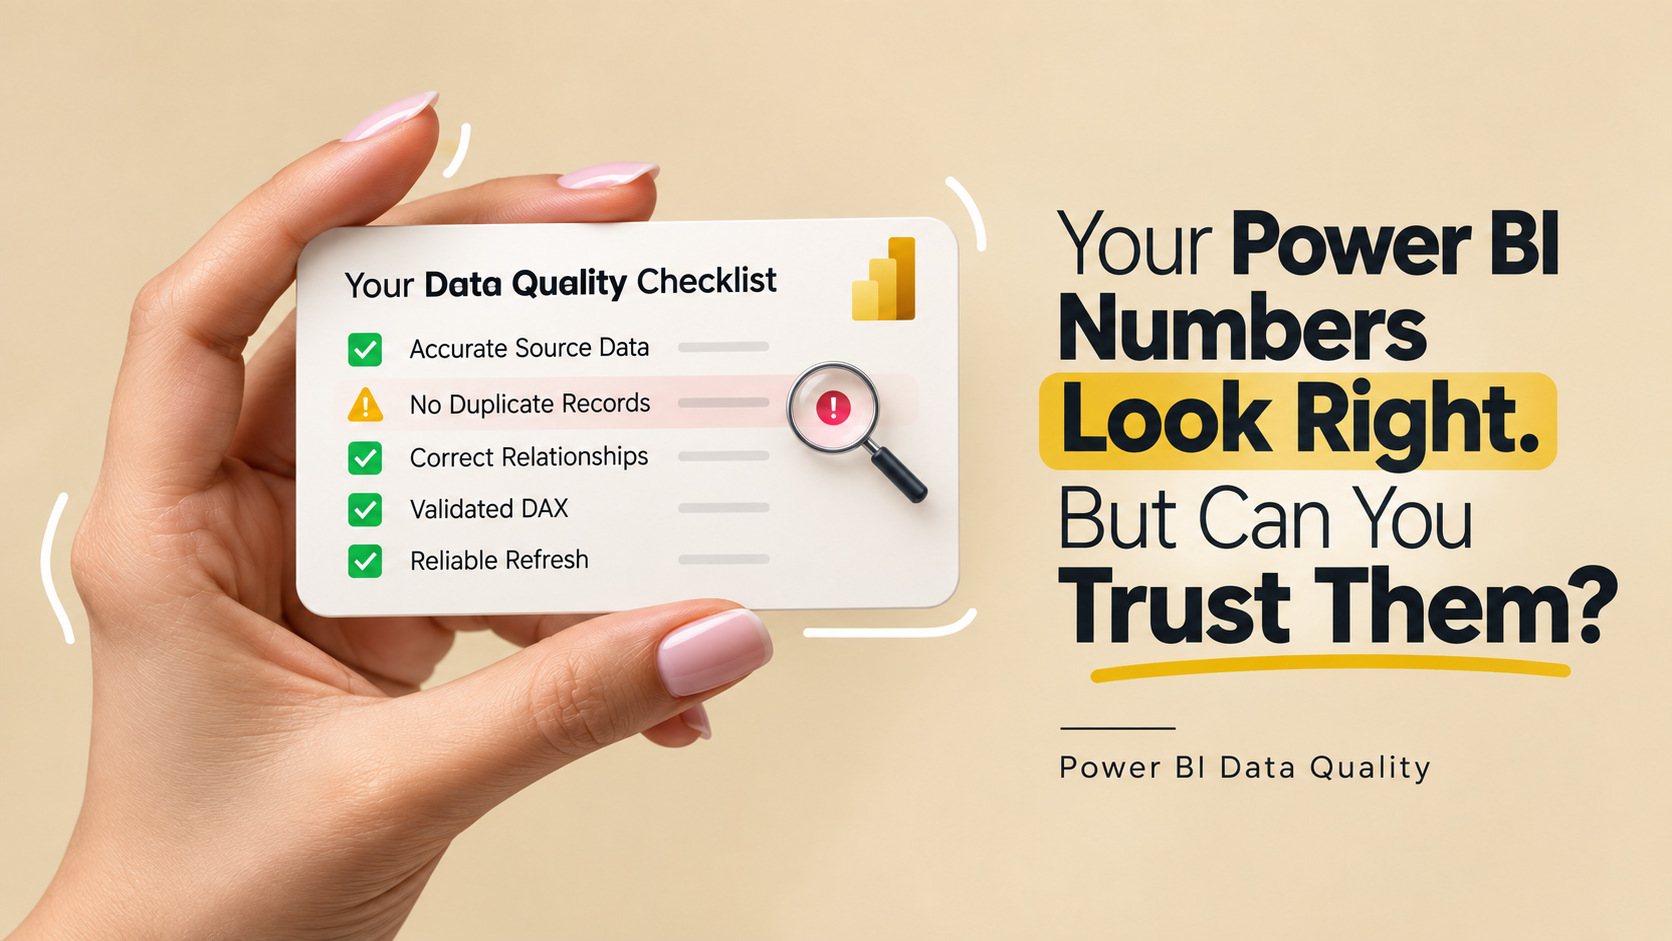
The Data Quality Problems Behind Reliable Power BI Reporting ,A Power BI report can look completely convincing. Still tell the wrong story. The charts are polished. The numbers are neatly arranged. The colors make everything easy to scan. A sales manager opens the report sees a revenue figure and assumes it is accurate. A finance team compares it with months numbers. A business leader makes a decision based on what appears to be a source of information.
What if the number is wrong?
Not obviously wrong. Not a number that looks ridiculous. A number that is just slightly wrong because duplicate records slipped into the dataset a relationship was configured incorrectly a date was interpreted differently. Two systems use different definitions for the same metric. That is what makes data quality such an important part of Power BI. The biggest problems are often not visible on the report page. They exist underneath it inside the source data, transformations, relationships, calculations and business rules that produce the number.
A beautiful report cannot fix data: The real value of Power BI begins earlier than the visual layer. It starts with making sure the information entering the model is accurate, consistent, relevant and understood.
The Dangerous Data Problem Is the One That Looks Correct
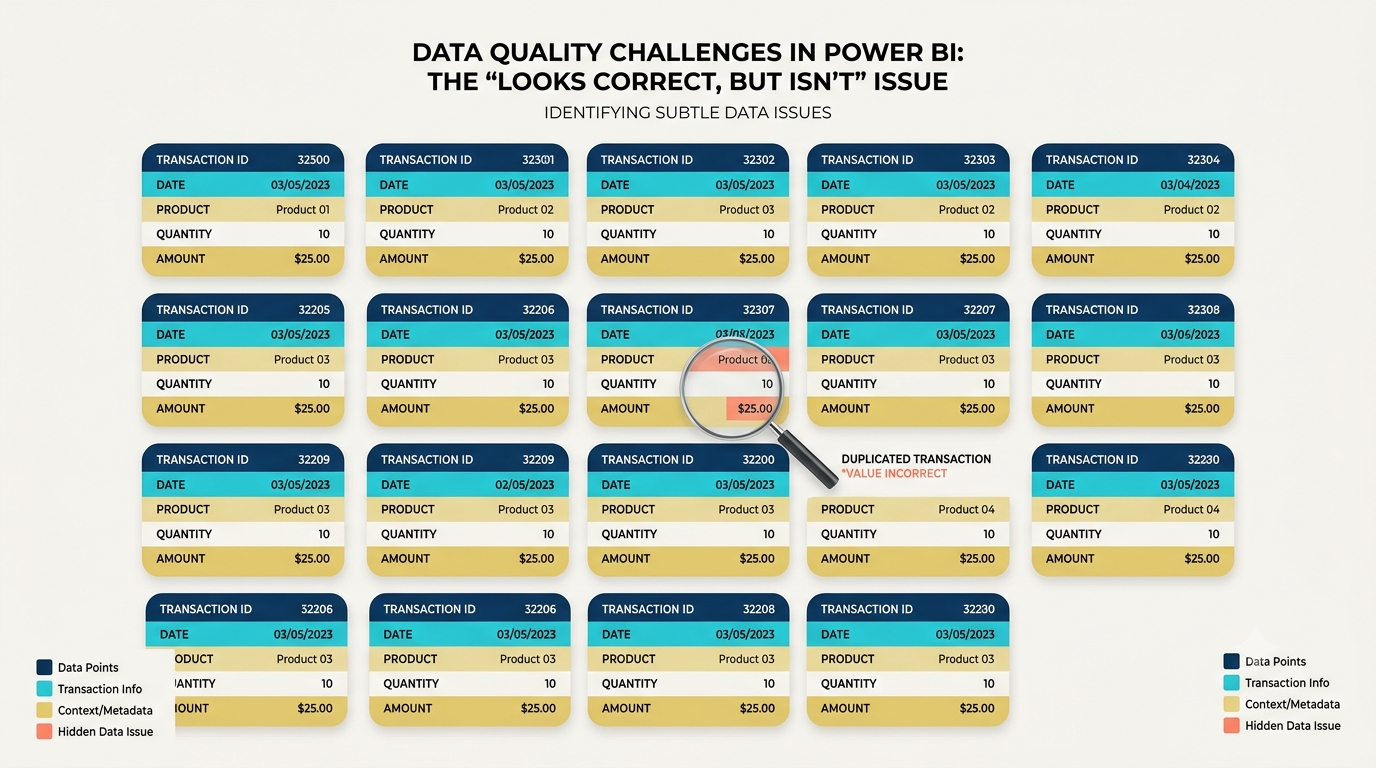
When people think about bad data, they often imagine obvious mistakes: a missing customer name, an empty sales amount or a completely incorrect date. Those problems are usually easy to spot. The difficult problems are the ones that produce believable numbers. Imagine a company has 10,000 sales transactions. During data preparation a small number of transactions are duplicated. The report still loads. The charts still look professional. The total revenue may still appear reasonable.
Nothing immediately tells the user that the number is inflated.
This is why data validation cannot simply mean checking whether Power BI successfully imported the data. A successful refresh only tells you that the data pipeline completed. It does not automatically tell you that the information is logically correct. A Power BI professional therefore has to ask questions. Where did this number come from? Was the source complete? Were duplicate records removed? Are the relationships correct? Are the calculations using the intended filters? Does the definition of revenue match what the business actually means by revenue? The important the decision the more important these questions become.
When Two Teams Have Two Different Numbers
One of the realistic data problems in a business is surprisingly simple: two departments report different numbers for the same thing.
Sales might say the company generated ₹12 crore in revenue.
Finance might report ₹11.6 crore.
Both teams may have reasonable explanations.
Sales could be working with booked orders while Finance is using recognized revenue. One report might include cancelled transactions while the other excludes them. One system could have refreshed earlier in the day. The reports could even be using date fields.
Now the problem is no longer simply technical. Someone has to decide what the business actually means by "revenue."
This is a distinction because Power BI cannot resolve an unclear business definition by itself. The tool can combine data transform it model it and calculate metrics. It cannot determine which business definition is correct without an agreed rule. Reliable reporting therefore requires more than accuracy. It requires business consistency.
Before creating a measure, analysts should understand what the metric represents, which records should be included, which should be excluded, and which date or status determines whether a transaction belongs in the calculation. Otherwise, two correct Power BI reports can produce different answers simply because they are answering slightly different questions.
Data Cleaning Is Not About Removing Blank Cells
Data cleaning is often presented as a simple process: remove duplicates, fill missing values, correct errors, and move on. x` Real business data is rarely that straightforward An organization may receive customer information from a CRM, transactions from an ERP, product information from spreadsheets, and operational data from another application. Each source can have its naming conventions, formats, identifiers, and rules. One system may store a customer's name as "Rahul Sharma" while another contains "RAHUL SHARMA”. One source may use Delhi, another New Delhi, and another a location code. Dates may appear in different formats. A product may have a code in one system and a new code in another. None of these problems necessarily produces an error message.
Power BI can import the information. The analyst still has to determine how those differences should be handled. This is where Power Query becomes particularly useful. Transformation steps can standardize formats, remove records, split or combine columns, replace inconsistent values, and prepare data for analysis.
The important point is that cleaning should not mean changing data until the report "looks right." Every transformation should have a reason.
Duplicate Data: The Silent Threat to Your Numbers
Duplicates deserve attention because they can change calculations without creating an obvious visual problem. Consider a transaction table containing one sale ₹50,000. If that transaction accidentally appears twice a revenue calculation may count ₹100,000 instead. The report may not know that one of those records is a duplicate.This is why duplicate detection should be based on the business logic of the dataset rather than simply looking for identical rows. Two records can have timestamps or technical identifiers and still represent the same business transaction. Conversely, two records may look similar. Legitimately represent separate transactions.
A reliable approach begins by identifying what makes a record unique. For example, a transaction might be uniquely identified by a combination of order number, product ID, customer ID and transaction date. The exact logic depends on the business process.
The key question is: “What does one row actually represent?"
Until that question is answered, it is difficult to know whether the dataset is clean.
Relationships Can Change the Story Without Changing the Data
One of the overlooked sources of incorrect Power BI results is the data model. The underlying tables can be completely accurate. The final numbers can still be wrong if relationships between those tables are not designed correctly. Imagine a sales table connected to a customer table. If the relationship is incorrect, ambiguous or based on a field that's not actually unique filtering one table may produce unexpected results in another.
This becomes particularly important when multiple tables are involved.
A Power BI model might contain:
Sales:. Revenue
Customers: Customer information
Products: Product details
Date: Calendar information
Regions: Geographic information
Each table has a role and the relationships determine how filters travel through the model. A attractive report can hide a poorly structured model because users generally see the final numbers rather than the relationships underneath them. That is why data modeling should happen before report design. If the model is wrong adding charts only makes the incorrect information easier to present.
The Problem With " One More Calculation"
Another common source of confusion appears when calculations are created without fully understanding the existing model. A Power BI report may contain measures, calculated columns, filters and transformations that all influence the result. When a new calculation is added without understanding that context it can produce a number that looks plausible but does not answer the intended question.
This is particularly important with DAX.
A DAX measure does not simply calculate a number in isolation. The result can change depending on the filters and context surrounding it.For example a measure showing sales may return one value when the entire dataset is selected and another when the user filters the report to a particular region, product or month. That flexibility is one of Power BIs strengths. It also means developers and analysts need to understand why a measure changes, not simply whether it returns a number. A calculation should therefore be tested under filtering conditions before it becomes part of an important business report.
A Refresh Completed Successfully. So Is the Data Reliable?
Not necessarily.
This is one of the important distinctions in Power BI reporting.
A successful refresh means the data-loading process completed according to the configured process. It does not necessarily confirm that the source system contained accurate information. Imagine an organization's sales system fails to send yesterday's transactions to the data source. Power BI refreshes successfully because the available source data is technically valid. The report now shows yesterday's sales without those transactions.
From Power BI's perspective, the refresh may have worked.
From the business's perspective, the report is incomplete.
This is why data validation should include more than refresh status. Analysts may need to compare record counts, totals, dates, source-system values or other business checks to determine whether the refreshed dataset actually represents the state of the business.
The question should not be:
“Did the refresh work?"
It should also be:
“Did we receive what we expected?"
Missing Data Does Not Always Look Like Missing Data
Missing information is another area where assumptions can create results.
A blank value might mean that information was never collected. It might mean that the field is not applicable. It might represent a value.. It could indicate a failure somewhere in the source system.
Those meanings are not interchangeable.Suppose a customer segmentation report contains thousands of customers, with no segment assigned. Treating every value as "Other" might make the chart look complete but it can hide an underlying data-quality problem. The better approach is to understand why the value is missing before deciding how it should be handled. Sometimes the right choice is to put it into a group. Sometimes the entry should not be used in calculations. In situations the missing information needs to be looked into at the source.
Good data preparation is not about making all the empty spaces go away. It is about figuring out what the empty spaces mean.
Why Data Types Are More Important Than They Appear
A value can seem on the screen but still be stored in a way that causes issues later.
Dates are an example.
A field that looks like a date might actually be stored as text. Numbers can also be stored as text, making math operations unreliable or requiring steps. Money and decimal accuracy can add another level of difficulty. If two systems show amounts differently, combining them without understanding how they are stored can lead to calculation errors. Data types affect sorting, filtering, calculations, connections, and time-based analysis. That is why data preparation should include a look at the meaning and type of important fields. The goal is not just to make the column look good. It is to make sure Power BI knows what the column actually stands for.
Data Validation Should Happen Before the Report Looks Nice
A typical process is to bring in data, build a model, create visuals, change colors, add filters, and then check if the numbers are right.
This order can create problems. By the time an error is found the wrong logic might already be in measures and visuals. A better way is to check the base Before spending a lot of time on the reports look an analyst should make sure the source data, transformations, connections and main calculations work as expected.
A simple validation might include:
Source check: Compare totals with the original business system.
Record check: Make sure the number of records and dates are as expected.
Duplicate check: Find records that might be the business event.
Relationship check: Make table connections work as intended.
Calculation check: Compare measures with values that are verified separately.
These checks don't need to be complicated. What matters is doing them regularly. Why Business Knowledge Is as Important as Technical Skills A person who is good with Power BI can make models and impressive calculations. Having technical skills alone does not ensure that the reports are useful. Imagine an analyst builds a sales measure without talking to the sales team. The calculation might be correct according to the data. Not match how the sales team actually measures success.
This is where business knowledge becomes important. Before making a metric, analysts should know who uses it what decision it helps with how the business defines it and what exceptions apply. For someone learning Power BI online, this is a step beyond just learning the tool. Knowing Power Query, DAX, data modeling and visuals is important. Real-world Power BI work also involves learning how business definitions shape how data is prepared and understood. The best analysts are not just people who know where to click. They understand the question behind the report. A Strong Power BI Model Starts With a Simple Question. One of the ways to improve data quality is to ask:
"What does this table actually show?"
This seems simple, but it can show many modeling issues. If a table has sales transactions, each row should represent a business event. If a customer table has one row per customer, the customer ID should have a purpose. If a date table is used for time analysis, its role should be clear.
Understanding the Data Model Before Building the Report
When each table and column has a clear purpose, building relationships becomes easier and calculations become easier to validate. Analysts can understand how information should flow through the model instead of trying to connect tables based only on similar-looking fields. A matching field does not automatically mean that two datasets should be joined. Two tables may contain a column with the same name or similar values but still represent completely different business concepts. Before creating a relationship, the analyst needs to understand what each table represents, how the records are identified, and how the relationship should behave.
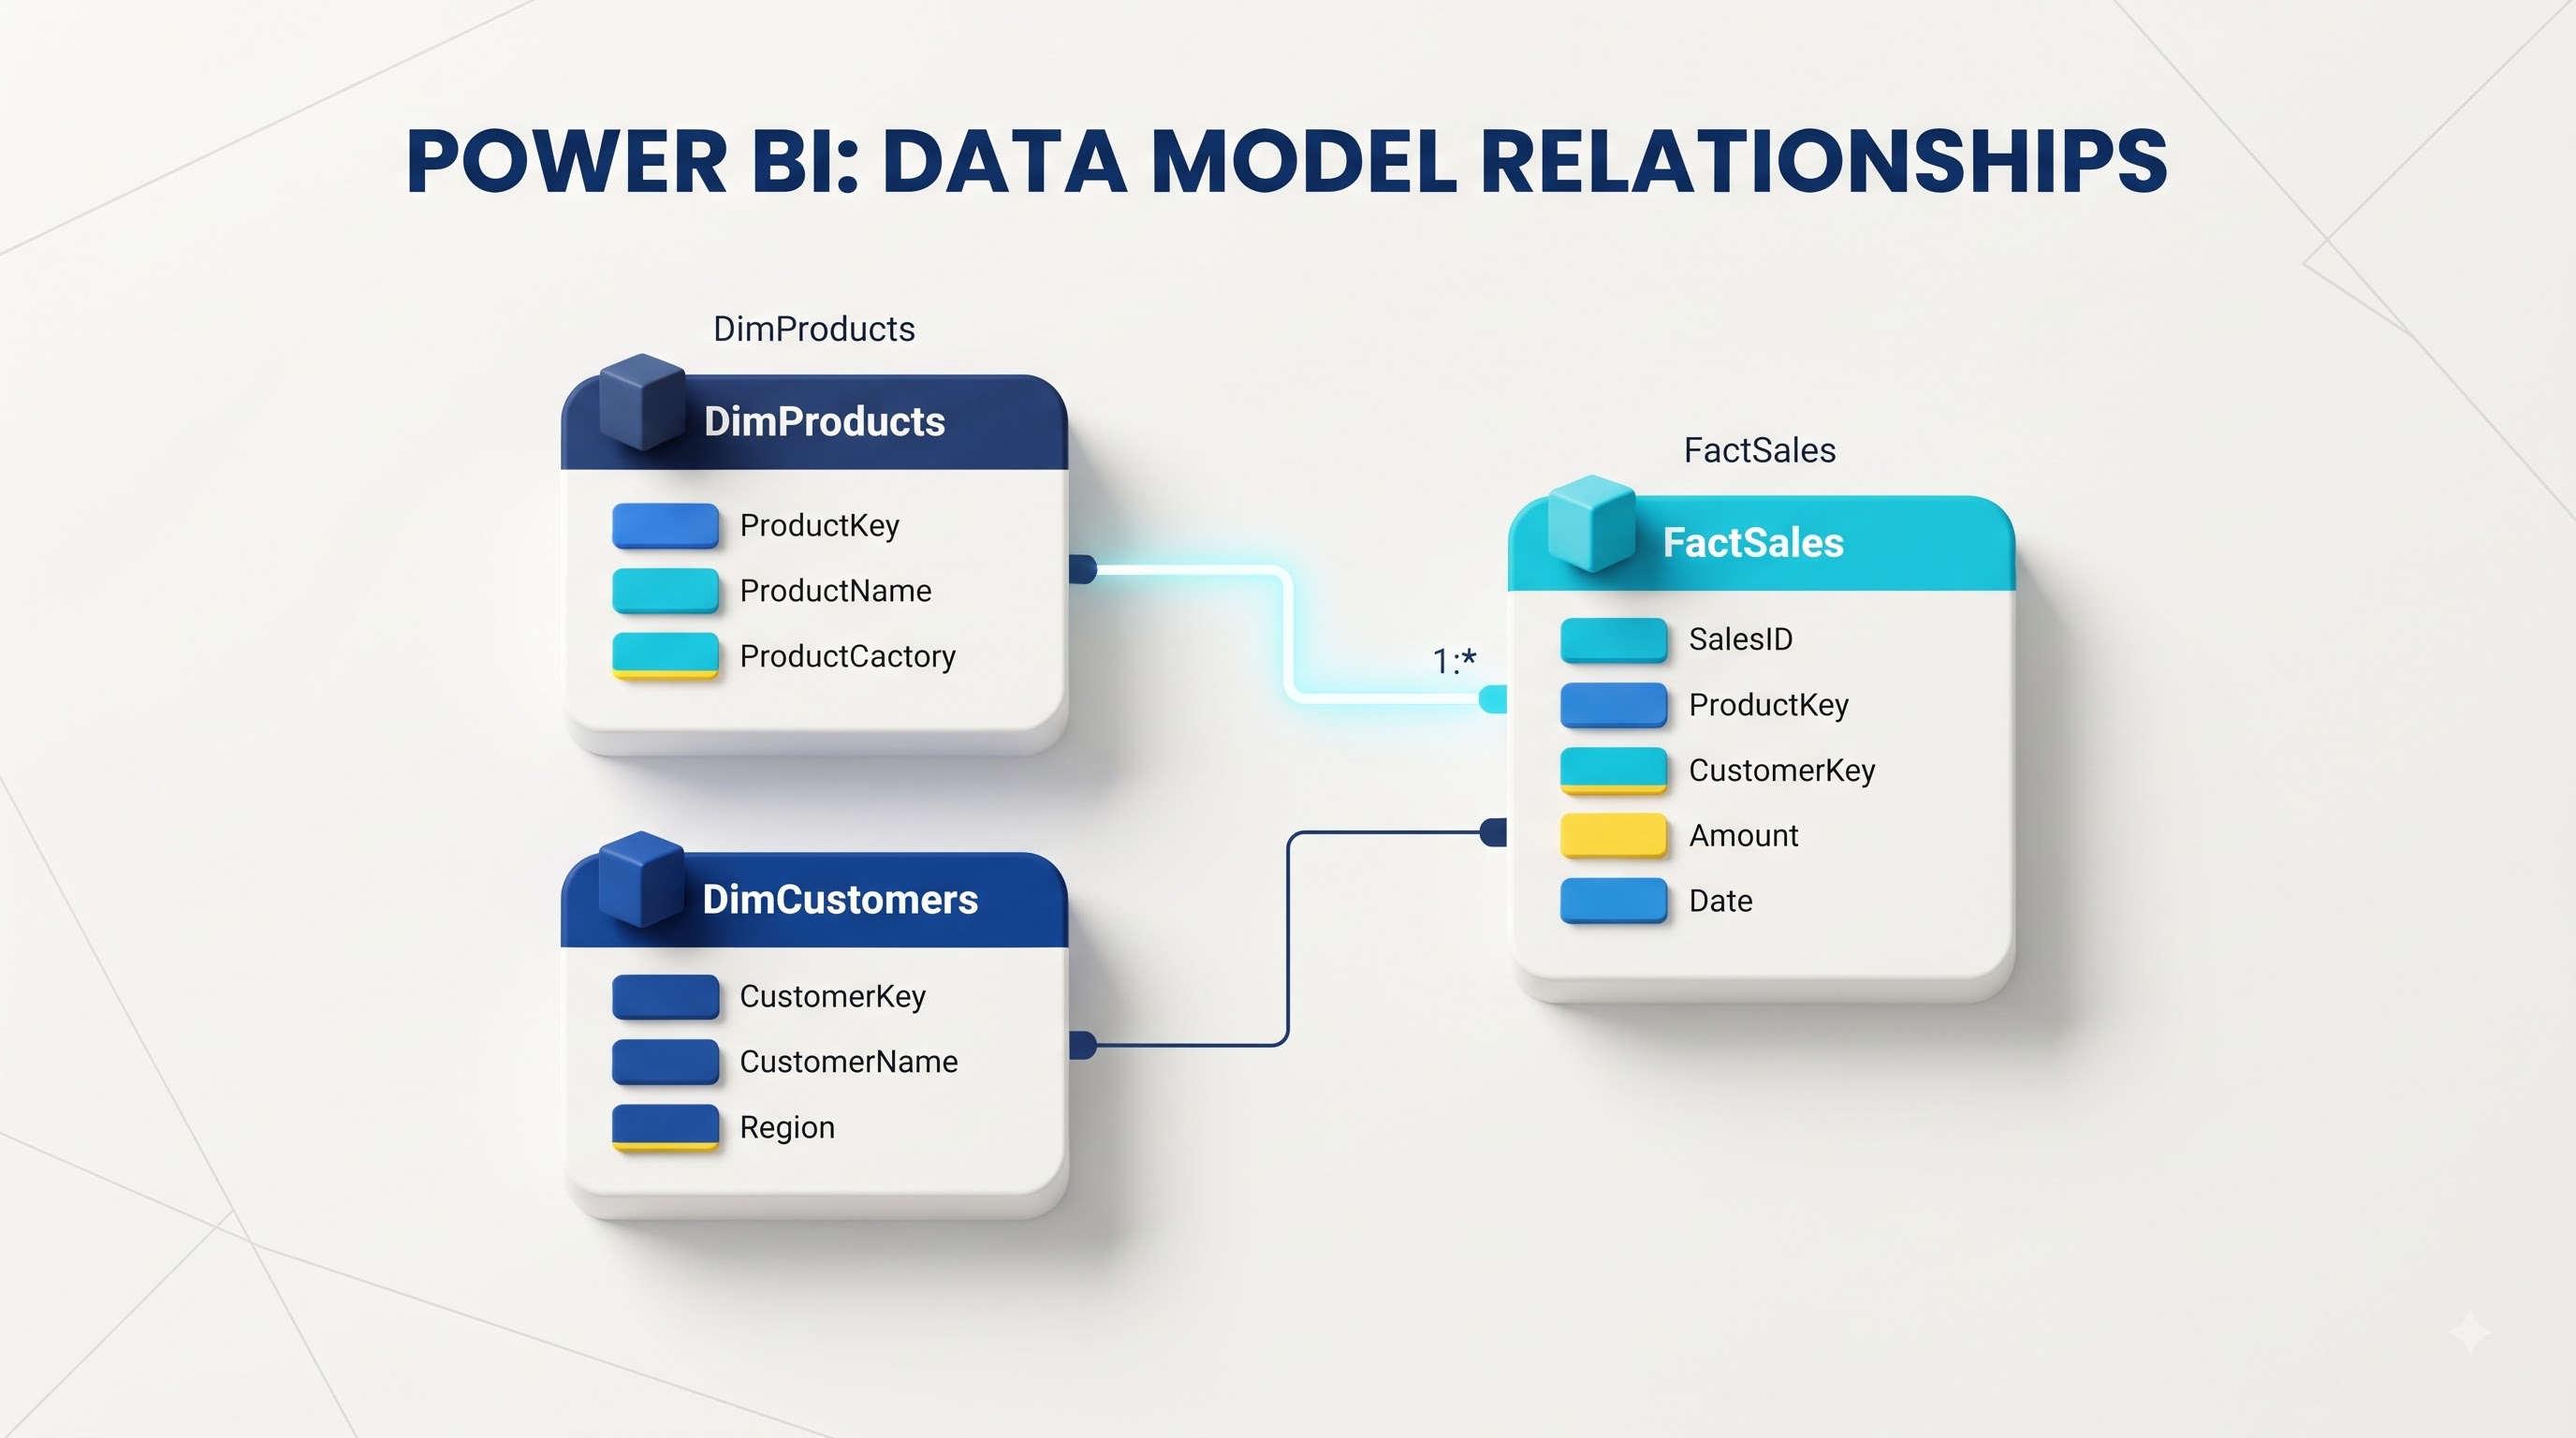
The connection needs to make sense from a business perspective, not just a technical one.
The Difference Between Data Accuracy and Data Completeness
Accuracy and completeness are often treated as the same thing, but they answer two different questions.
Accuracy asks: Is the information correct?
Completeness asks: Is all the required information present?
A sales dataset, for example, may contain completely accurate transaction amounts but still be incomplete if several days of transactions are missing. On the other hand, a dataset may contain every expected record but have incorrect values in some of those records. A reliable Power BI solution needs to consider both. It should also look at consistency, which determines whether the same information follows the same definition across different systems, and timeliness, which determines whether the data is current enough for the decision being made.
These factors become particularly important when Power BI reports are used for financial, operational, or management decisions. A number can be accurate and complete at one point in time but still be unsuitable for a decision if it is outdated or defined differently from the metric used elsewhere in the organization.
Should Teach More Than Report Building
The difference between creating a report and building a reliable BI solution becomes clear when professionals start working with real business data. Power BI ClassesTraining that focuses only on importing tables and creating visuals can teach users how the interface works, but practical learning should also include data cleaning, Power Query transformations, relationships, DAX validation, and troubleshooting unexpected results.
Learners should ideally work with imperfect datasets rather than only clean demonstration files. Real data contains duplicates, missing values, inconsistent formats, unexpected relationships, and other problems that require investigation. That is where meaningful learning happens.
When a relationship produces unexpected numbers or a calculation changes after applying a filter, the learner should understand why it happened rather than simply follow another step-by-step instruction. This type of practice develops the problem-solving skills that are important when working with Power BI in professional environments.
What Happens When Data Quality Issues Reach Management?
The consequences of poor data quality are not limited to an incorrect chart. Once unreliable information reaches decision-makers, a technical data problem can quickly become a business problem. A business leader might reduce investment in a product because its reported sales appear to be declining. An operations manager might increase staffing because a report suggests demand is rising. A finance team might investigate a revenue change that exists only because two reports use different definitions for the same metric.
The problem becomes more serious when users repeatedly discover inconsistencies in important reports. They may stop trusting the reporting system and return to spreadsheets, compare reports manually, or create their own calculations.
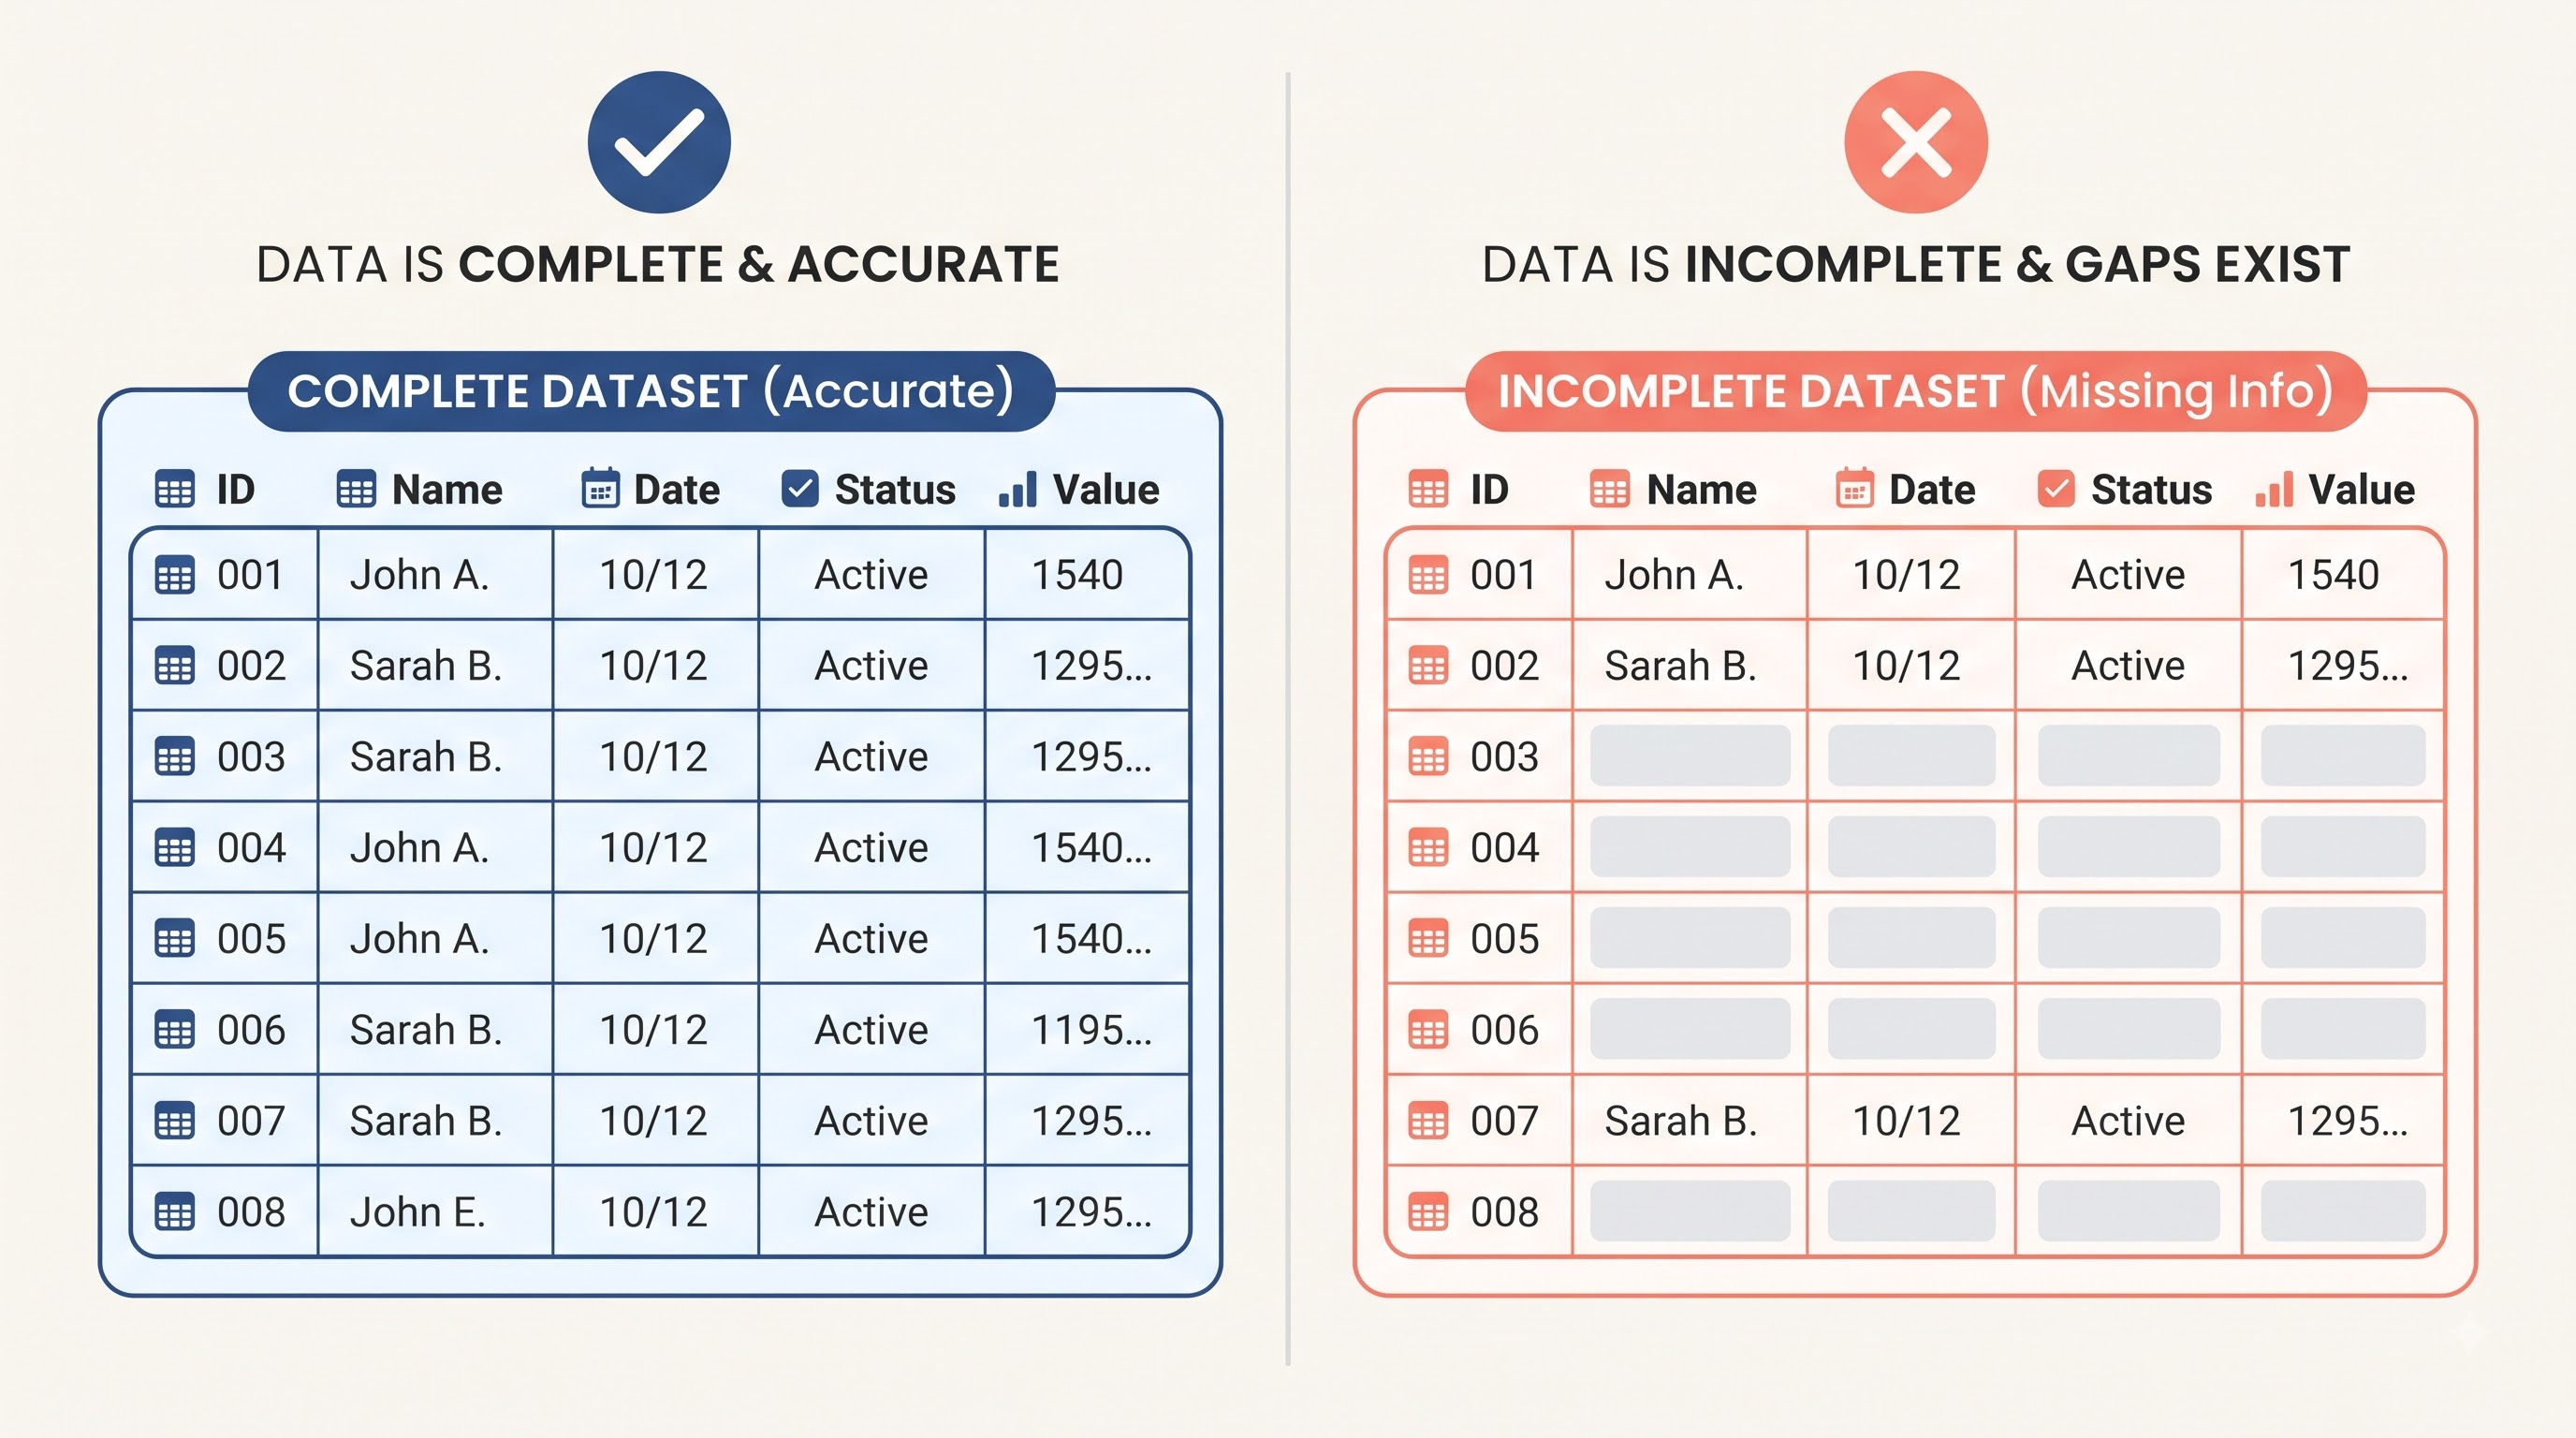
That is exactly what a business intelligence system is intended to reduce.
The value of BI is not simply producing information. It is creating information that people can confidently use.
Creating a Single Source of Truth Is More Than Putting Everything in One Report
The phrase “single source of truth” is often used loosely. It does not necessarily mean that every piece of information has to physically exist in one location. Instead, it means that the organization has an agreed definition and a trusted method for calculating important business metrics. For example, if a company has agreed on what qualifies as an active customer, different reports should not independently calculate that metric using different rules. Even if the reports are technically well-built, different definitions will produce different results.
The technical implementation can change depending on the system or reporting requirement, but the business meaning needs to remain consistent. This is where centralized data models, shared calculations, documented metric definitions, and clear data-governance rules become valuable. The goal is not simply to make different reports look the same. The goal is to make sure that the logic behind those reports remains consistent.
Building Trust Into a Power BI Solution
Reliable reports do not become trustworthy because of one final quality check. Trust is built throughout the entire reporting process. It starts with understanding the source systems and continues through data transformation, modeling, calculations, validation, refresh, and reporting. A mature Power BI process treats data quality as part of development rather than something that happens only after the report has been created. This mindset changes the questions an analyst asks.
Instead of asking:
“Does this chart look right?”
They ask:
“Can I explain exactly where this number came from?”
Instead of asking:
“Did the dataset refresh?”
They ask:
“Did the refresh bring in the data we expected?”
Instead of asking:
“Does this measure return a value?”
They ask:
“Does this measure match the business definition we agreed on?”
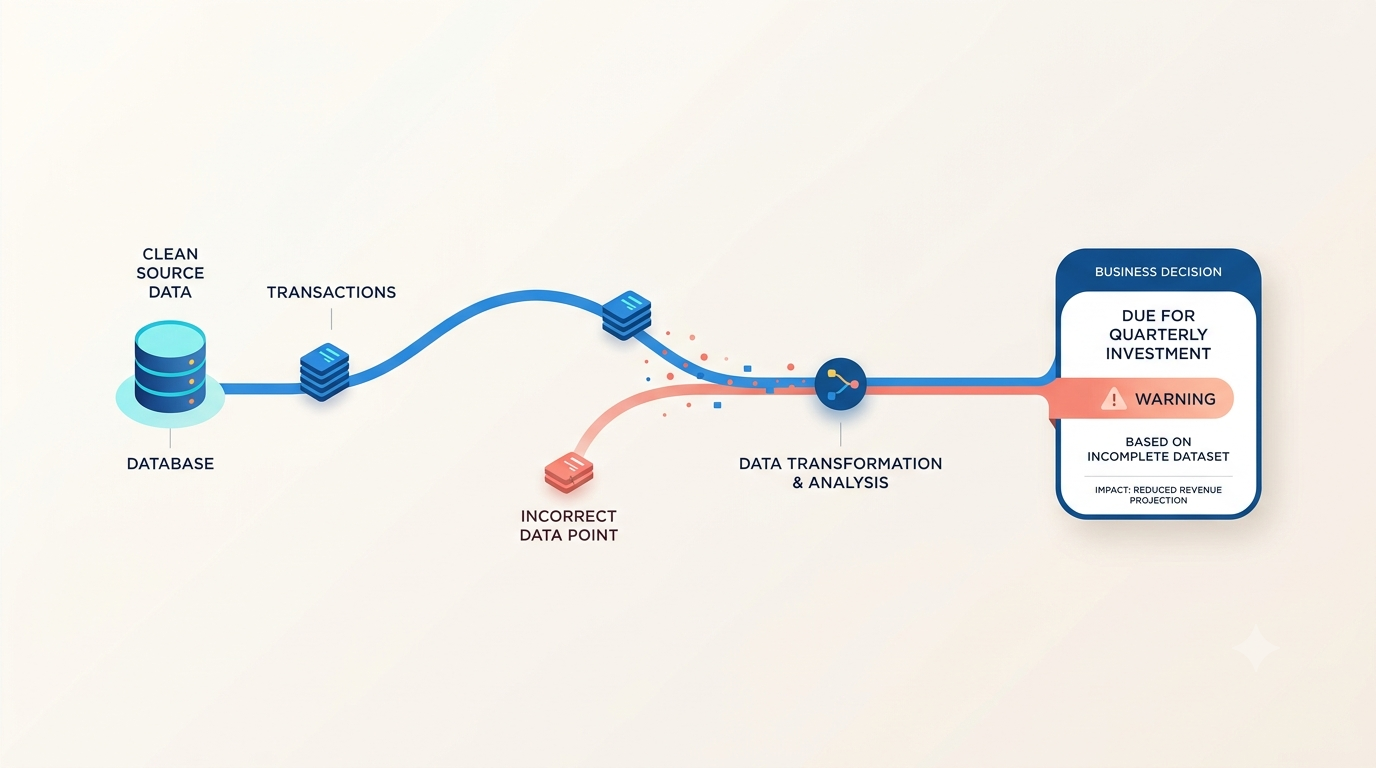
These questions shift the focus from simply building a working report to building a trustworthy reporting system. And that difference is what makes Power BI valuable in real business environments.
A Final Data-Quality Check Before Publishing
Before a Power BI report becomes a trusted source of business information, it should go through a final data-quality check. Small issues that are easy to overlook can affect the numbers users ultimately rely on.
Check the source: Confirm that the data comes from the expected system and covers the correct reporting period.
Check the data volume: Look for unusual changes in record counts that could indicate missing, duplicated, or unexpectedly added data.
Check for duplicates: Make sure records that should be unique are actually unique according to the relevant business rules.
Check relationships: Verify that table relationships and filters are working as expected and are not creating incorrect results.
Check important numbers: Compare key KPIs with a trusted source or an independently calculated value to confirm that the results are reasonable.
Check dates: Make sure the report uses the correct date field, reporting period, and refresh window.
Check missing data: Understand why important fields are blank instead of simply replacing every blank value with a default category.
Check the business meaning: Confirm that each important metric has the same definition for both the report creator and the people using the report.
These checks may seem simple, but they can prevent a polished Power BI report from presenting a polished version of the wrong answer.
The Real Skill Behind Reliable Power BI Reporting
Power BI is often seen as a tool for creating reports and visualizing data. That is certainly part of its purpose, but reliable reporting requires much more than knowing how to create charts. The difficult part is not always making the visual. The difficult part is knowing whether the information behind that visual can actually be trusted. A Power BI professional may spend hours cleaning data that users never see, fixing relationships that users never notice, testing calculations that appear simple, and comparing report totals with the original source system before publishing the final report.
That work may not look impressive on the finished report, but it is what makes the report reliable. This is also where Microsoft Power BI training becomes more valuable when it includes realistic business datasets and problem-solving rather than focusing only on software features. Working with imperfect data helps professionals learn how to identify inconsistencies, validate calculations, understand relationships, investigate unexpected results, and make reporting decisions based on reliable information.
Ultimately, strong Power BI skills are not just about building reports. They are about understanding the data well enough to know when the report deserves to be trusted.
A Beautiful Report Is Not the Same as a Reliable Report
Power BI makes it fairly easy to turn data into something that looks good. Looking good is only part of good business intelligence. A report can have spacing, nice colors, interactive filters, and fancy charts while still giving the wrong answer if the data underneath is missing, repeated, connected incorrectly, not cleaned well, or based on unclear business rules.
The best Power BI solutions start with a basic question:
Can we trust the numbers?
Answering that question means looking past the report itself. It means knowing the source data, cleaning it carefully, building relationships, checking calculations, making sure data updates correctly, and making sure the numbers match how the business actually works. When those basics are correct, the visual part of the report becomes more useful. People stop asking where the numbers came from and start using them to see what is happening. That is what good business intelligence should do—not just show more data but give people enough confidence in the data to use it properly.