
OpenShift Monitoring and Logging: Tools and Best Practices
Last updated on Oct 3, 2026
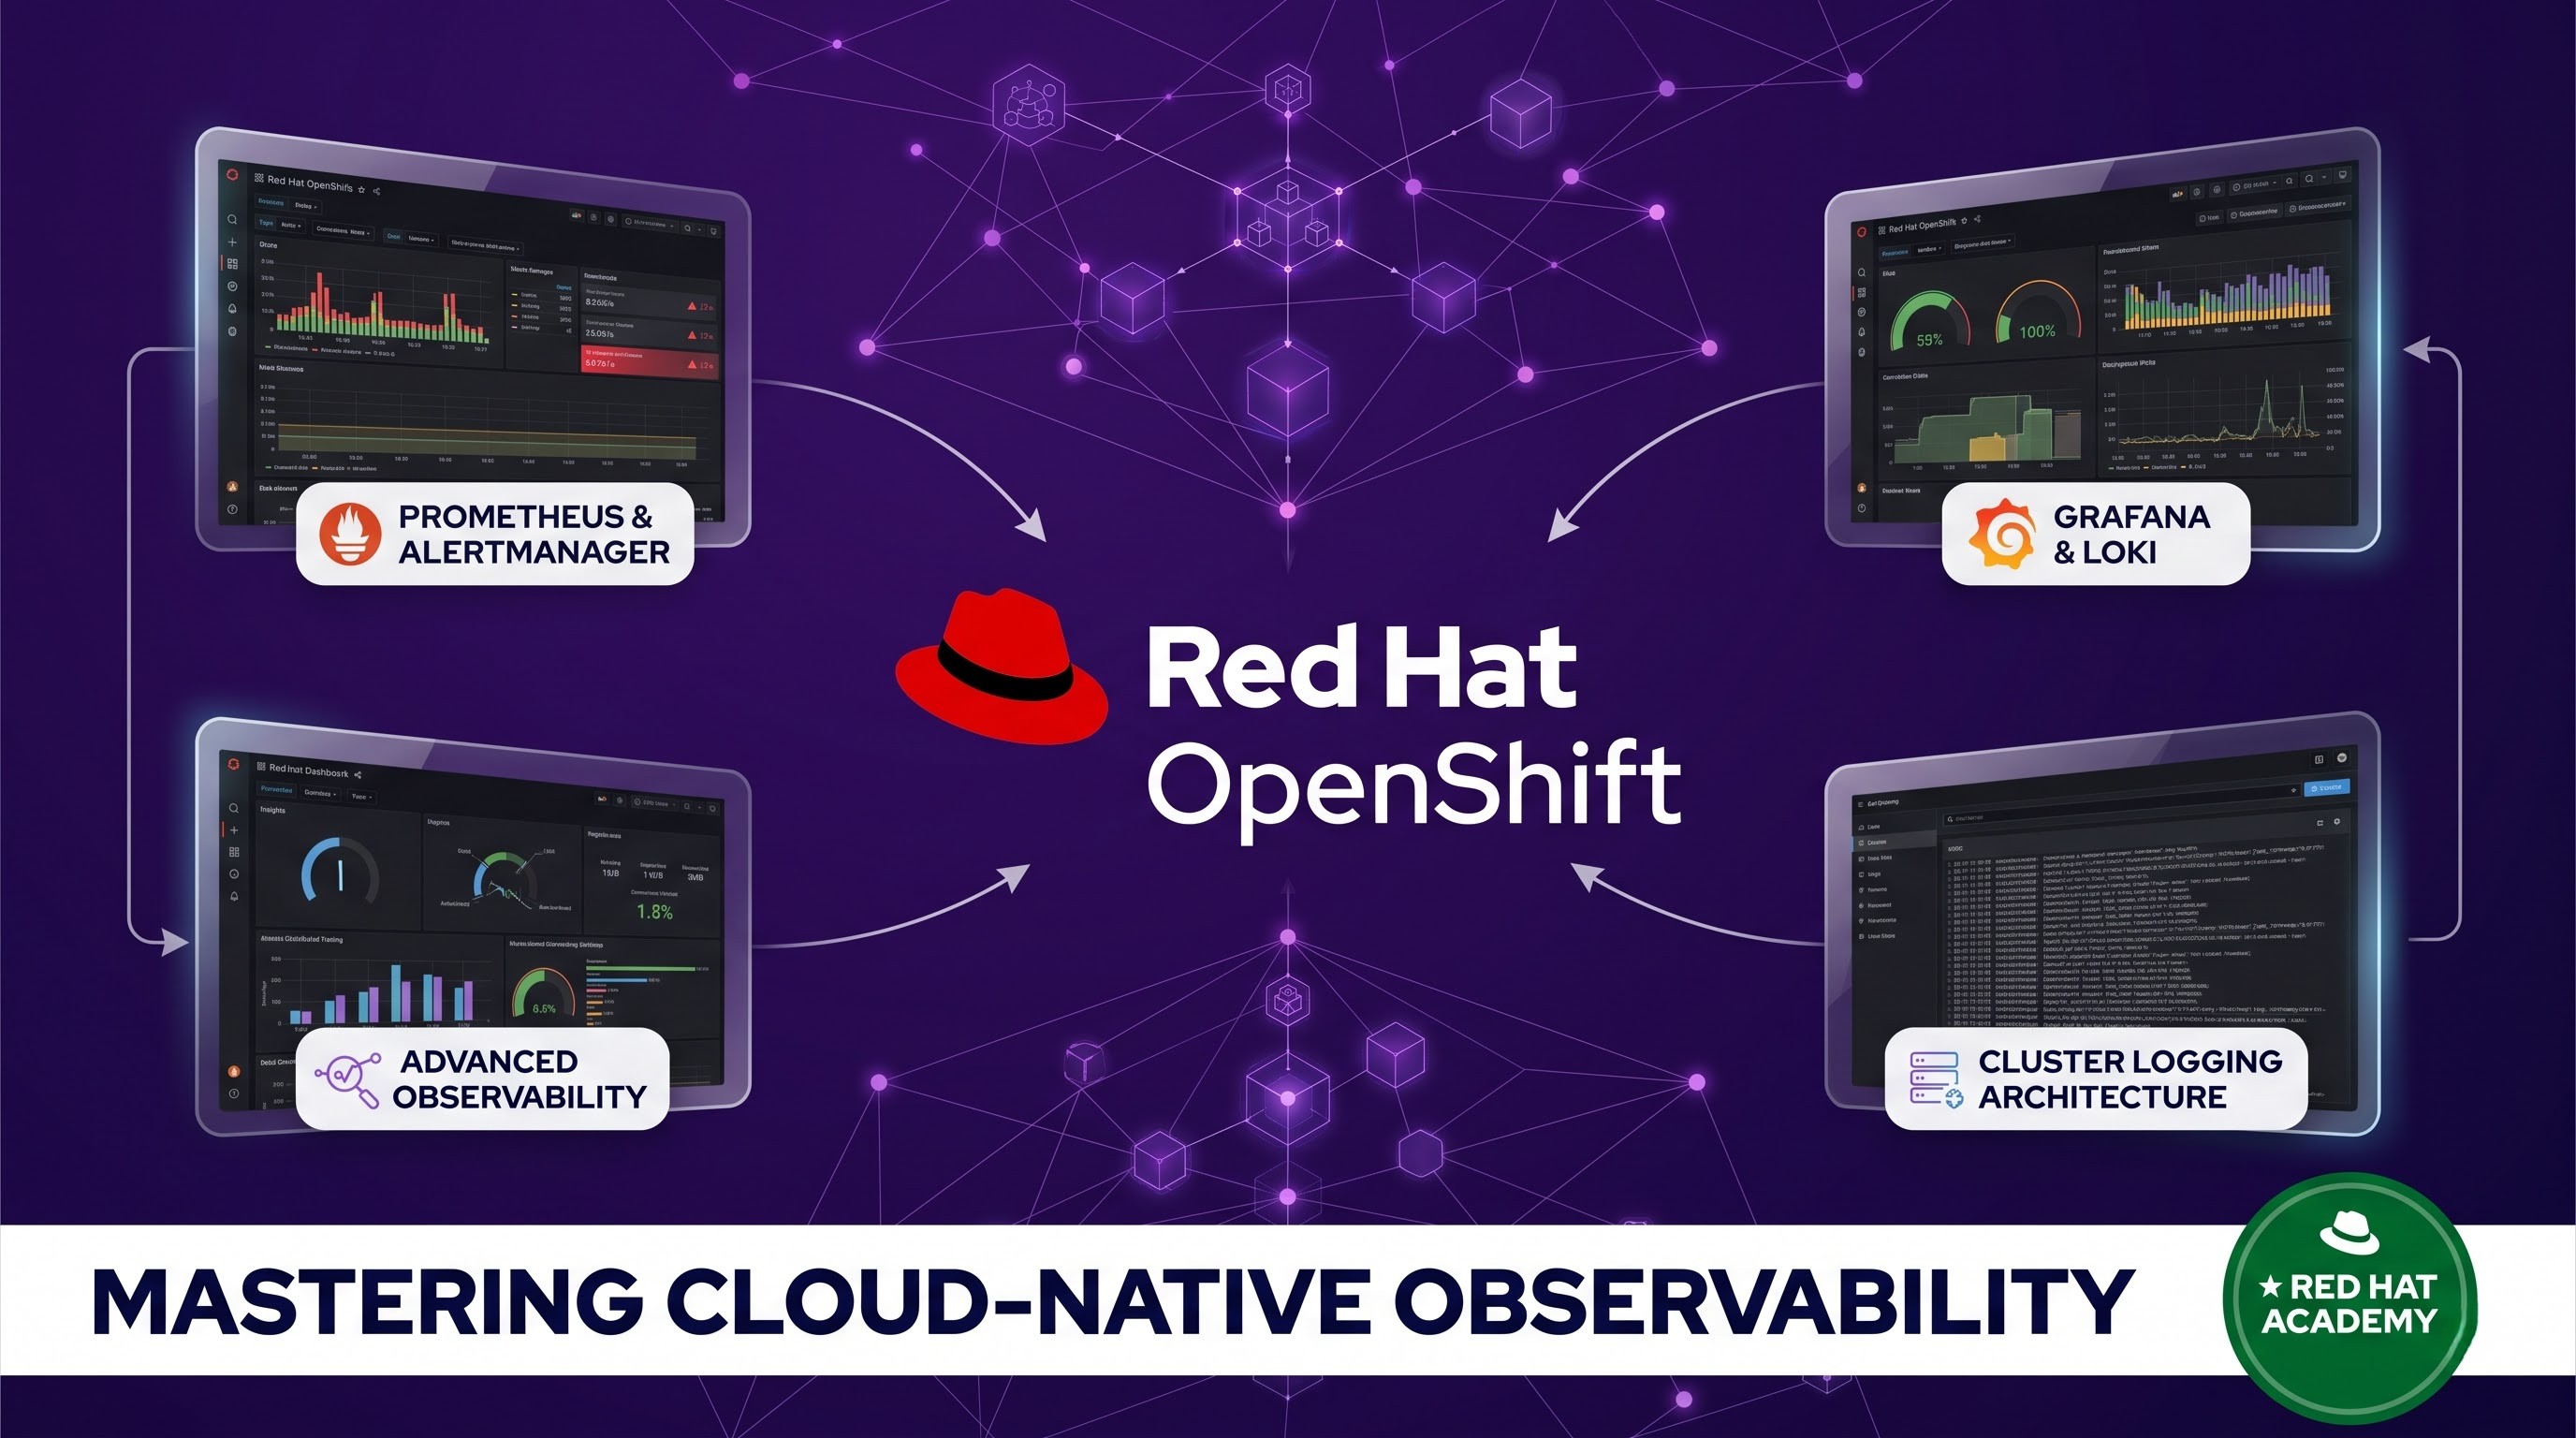
OpenShift Observability Overview
With the advent of recent enterprise architectures characterized by the adoption of containerized microservices based on Kubernetes and Red Hat OpenShift technology, traditional monitoring techniques have had a hard time keeping up. In the past, operations teams were able to easily monitor a limited number of physical servers, virtual machines, and traditional application runtimes thanks to the rigid nature of their computing environments. However, an OpenShift cluster is a changing, transient environment. Pods are opened and closed constantly on multiple workers, routes are being created and eliminated automatically, and the workloads utilize computing, storage, and networking resources in an intermingled manner. To achieve complete control over this complex environment and ensure high availability and performance, the organizations will have no other choice but to use reliable observability solutions based on efficient monitoring and centralized logging.
Observability in Red Hat OpenShift extends well beyond simply being aware of whether a node is either functioning or malfunctioning. It includes the features of a company that has good insight into the well-being of a cluster, infrastructure components, the performance of developer applications, consumption of resources, networking processes, and compliance to various security regulations. In absence of an adequate strategy for efficient monitoring and logging, it is impossible to succeed in such an effort as resolving production incidents in a way that is reminiscent of a trial and error method. The solution suggested by Red Hat OpenShift for this issue lies in the fact that it does its best to make use of its facilities operating at full capacity. However, just having an opportunity to use such things as pre-configured and automatic monitoring and logging systems does not guarantee success.
Yet, putting these functions to work is only the initial stage. Real operational efficiency includes knowing the essential elements, selecting appropriate tools, and applying fundamental practices in all areas of business. To ensure that your team becomes proficient in these structures as quickly as possible, it is beneficial to participate in a program such as openshift training online to get the necessary expertise.
The Progression of OpenShift Monitoring Architecture
The development of OpenShift engineering was achieved simultaneously as technology in the Kubernetes and Promotions area advanced. Initially, in order to monitor a Kubernetes cluster, it was necessary to put into operation individual components of open source systems including Prometheus, Alert Managers, node exporters, and custom dashboards. This brought about numerous disadvantages including the constant need for monitoring, loss of data, problems with capacity of the system. In order to eliminate those problems, Red Hat created a solution named Cluster monitoring operator which is an automated solution designed to work out of the box and solve the problem of monitoring systems.
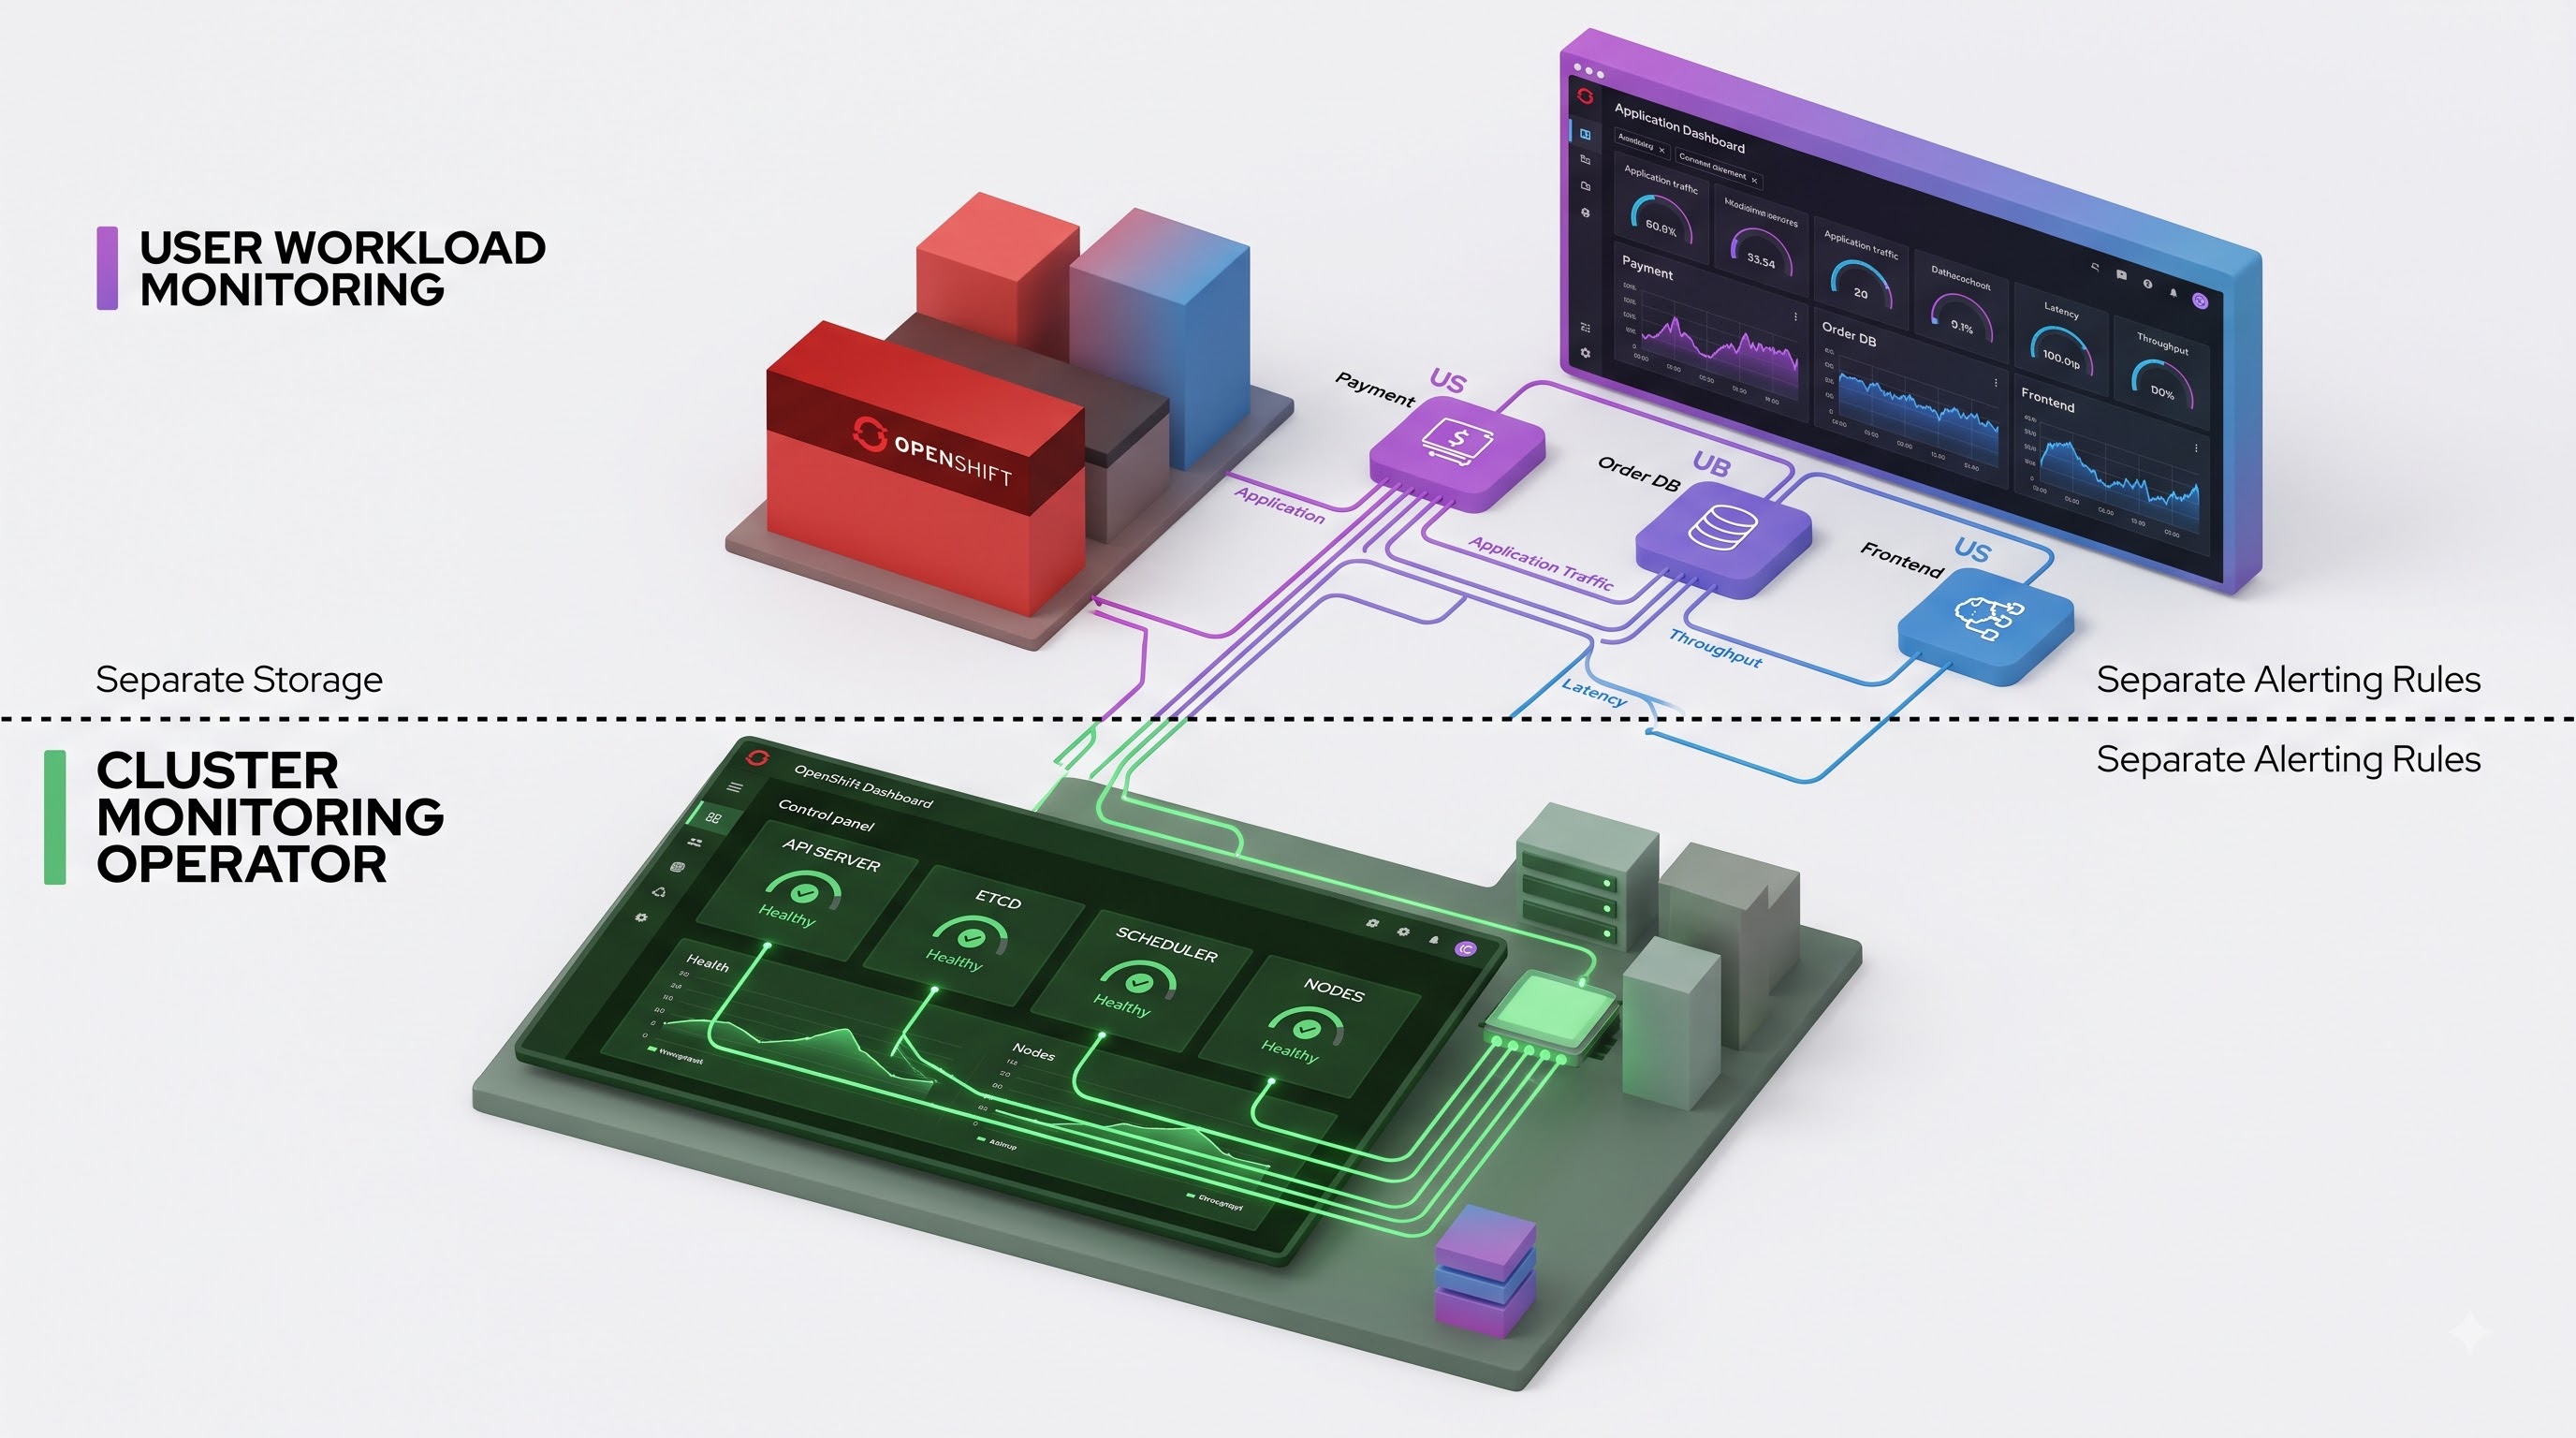
The monitoring system in the OpenShift process is differentiated into two levels. The platform monitoring includes monitoring of the overall health of the OpenShift platform itself and its systems. The platform includes all core components including API server, scheduler, controller manager, etcd, container and processes running in different machines. Those systems play an important role in sustaining the platform operation since they provide healthy throughput of monitoring.
On the other hand, user workload monitoring takes monitoring capabilities down to the application level. Often, developers and application teams have to monitor their own custom microservices, the business logic codes being executed, the latencies of the responses generated, and the custom metrics of their applications. User workload monitoring is achievable through cluster configuration manifests where administrators create a secondary, separate monitoring stack that is solely dedicated to the workloads of their project. Such separation prevents high-volume application monitoring from disrupting platform monitoring thereby maintaining the stability of the control plane while still giving developers application insights.
Key Monitoring Components and Tools
The OpenShift monitoring stack employs a proven set of open-source monitoring tools that are integrated into OpenShift’s lifecycle management. Understanding how these individual components work together is necessary for anyone who is charged with maintaining or troubleshooting the operation of a production-grade cluster.
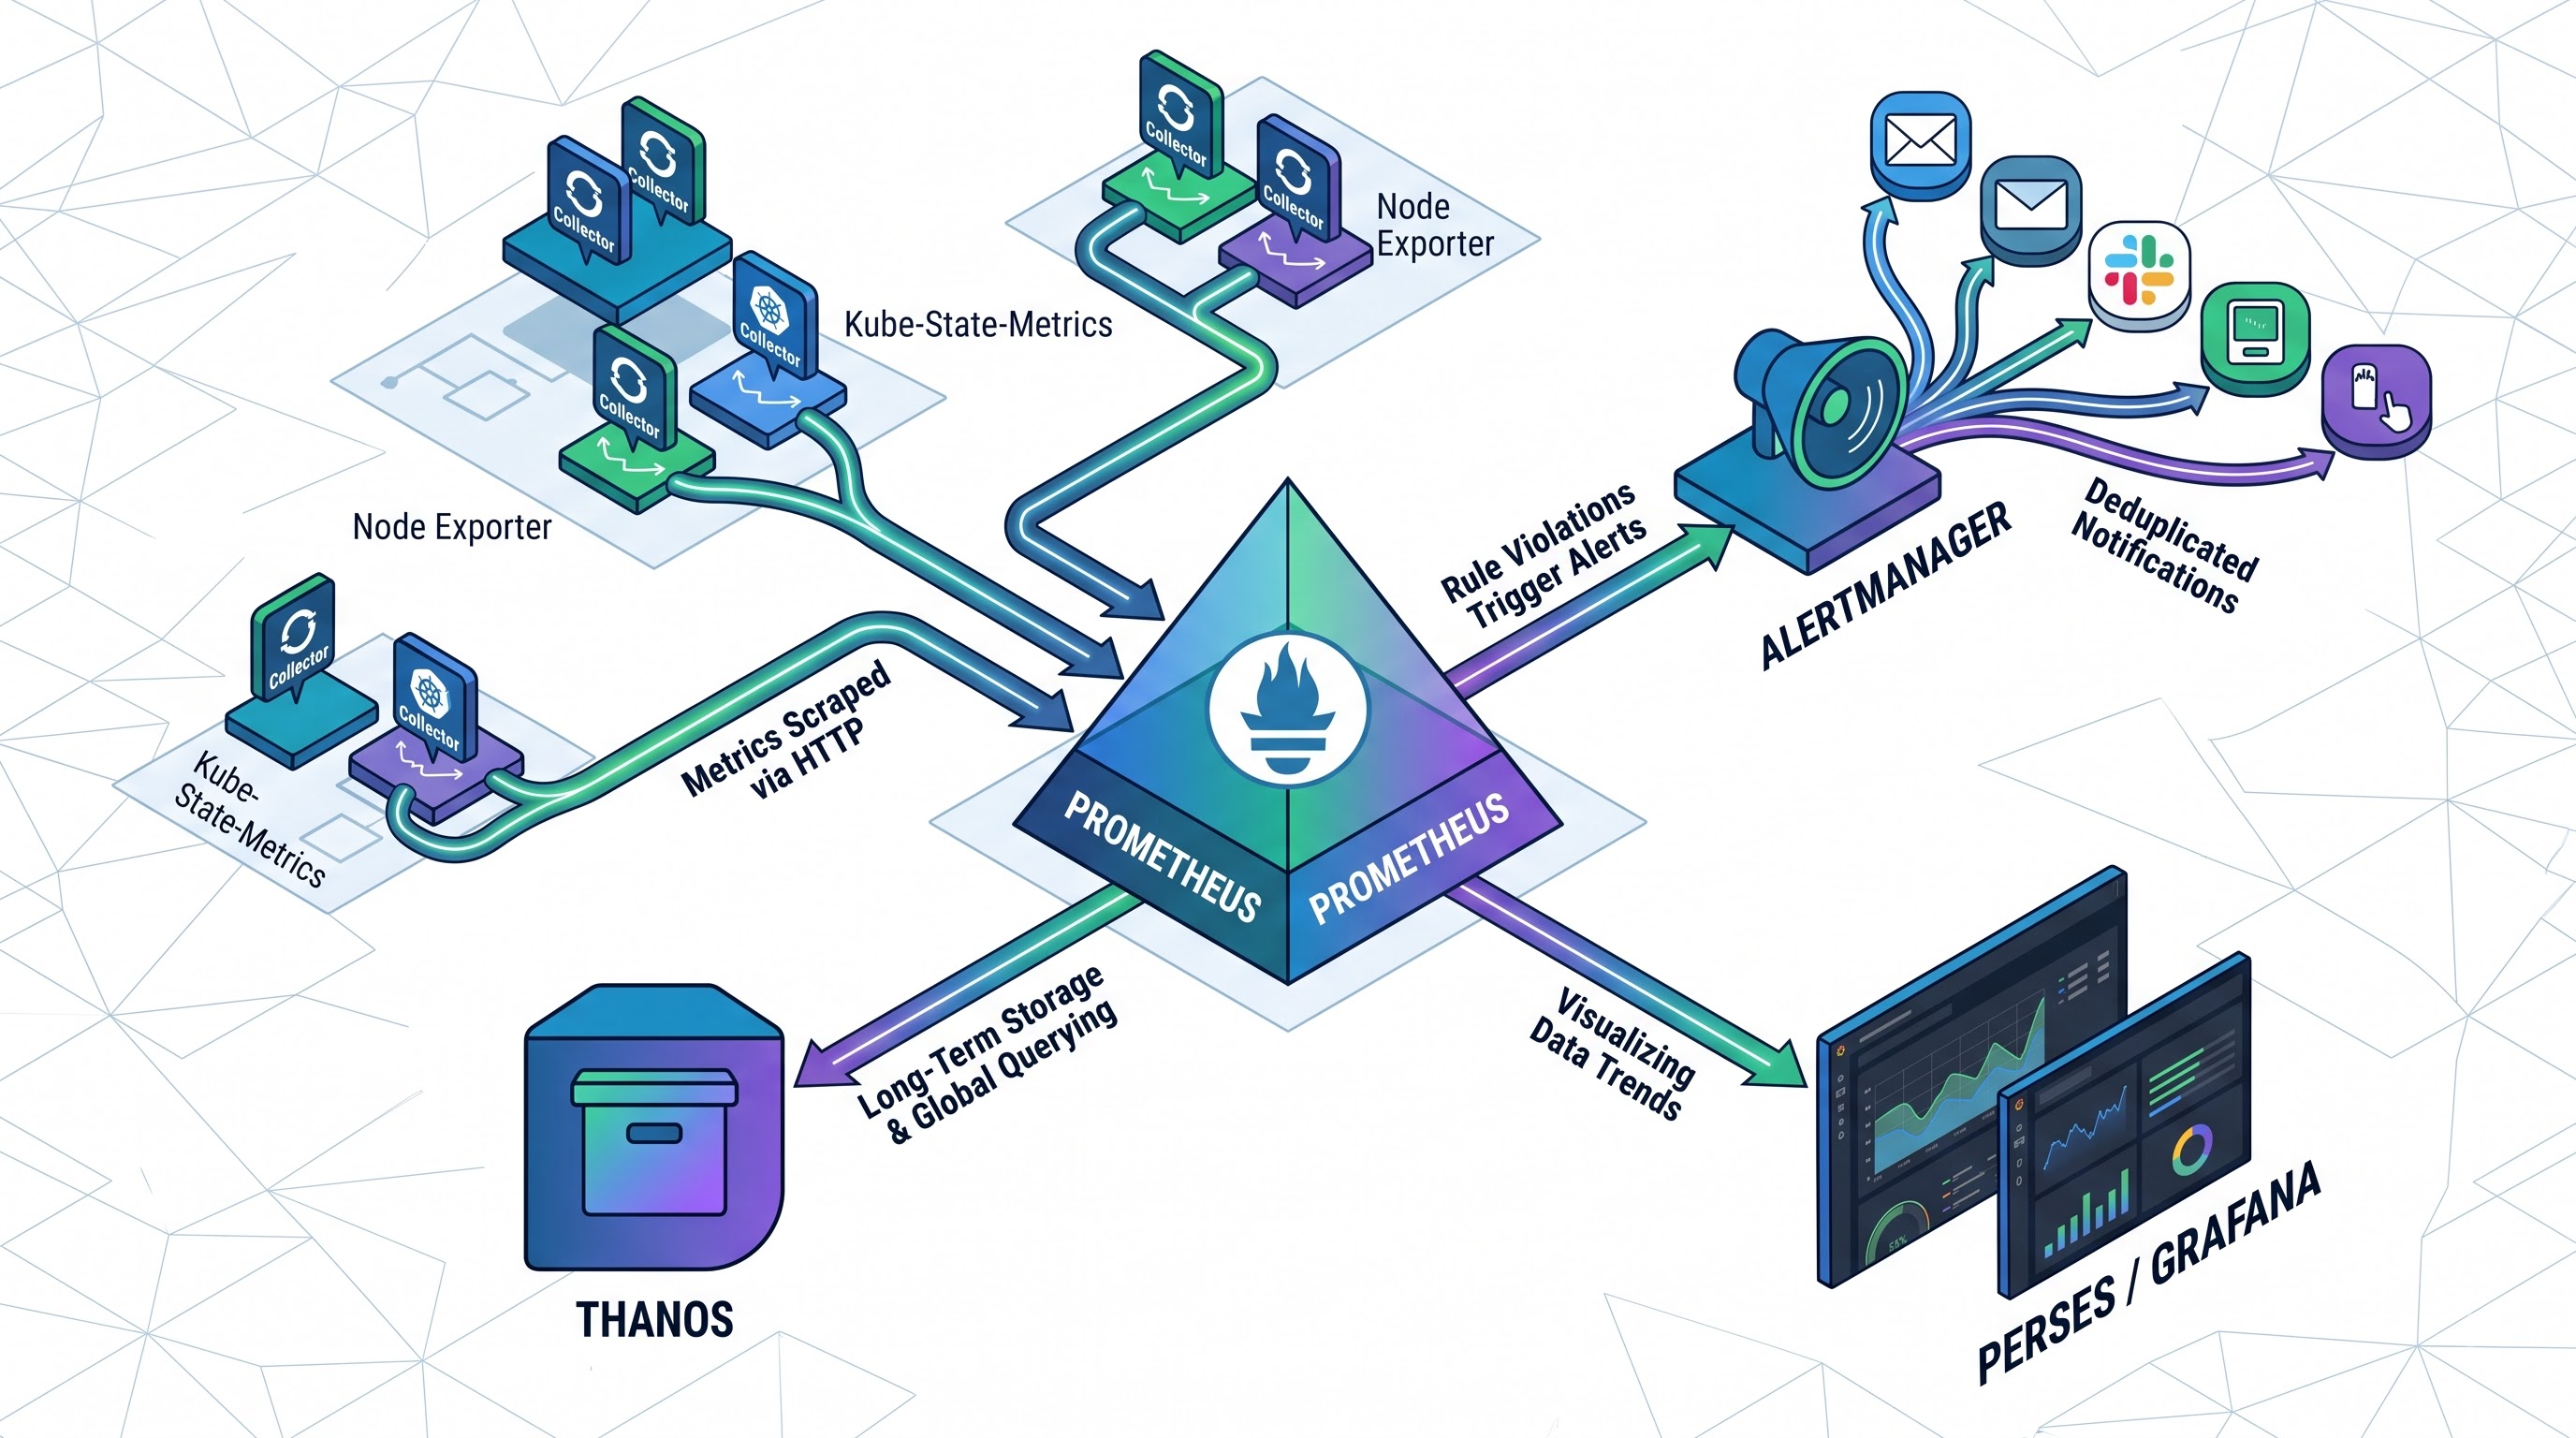
Comprising the most critical component of any monitoring architecture, Prometheus is a robust open-source monitoring and alerting toolkit. Built on time-series data model architecture, Prometheus collects metrics from the target applications through HTTP endpoints at specified intervals, saves them to a local time series database, and executes a powerful querying language painted as PromQL. In OpenShift, it is normal practice to deploy Prometheus instances in redundancy for higher availability to automatically identify new targets based on the Kubernetes service discovery methods.
While working with Prometheus, the Alertmanager app helps in processing alerts created by rules based on metrics. Prometheus visits Alertmanager with alerts whenever some metric violates a threshold applicable for a particular period of time. The Alertmanager stabilizes, silences, deduplicates and processes the alerts and sends them to notification systems, allowing organizations to be aware of what is happening and thus taking immediate actions without overwhelming with unnecessary alerts during a cascading failure.
Thanos has the ability to store the metrics for the long run and offer the ability for viewing all of them in one place. Because there is a limitation on the amount of data that can be stored in a local Prometheus instance for a specific period, Thanos works with external data storage. With this ability to keep the latest time-series data stored, it allows easy querying for significant amounts of historical data and trends.
Node Exporter and kube-state-metrics create the necessary data flows. Node Exporter runs as a number of processes across all nodes in the cluster and is responsible for gathering the most basic data about hardware and software metrics, such as CPU load, RAM usage, Disk I/O, and bandwidth. On the other side, kube-state-metrics listens to the Kubernetes API server and modifies the internal object state (such as deployments, pods, persistent volume claims, and replicas) into the data that can be collected and processed by Prometheus.
Advanced Observability Products and Technologies
As the needs of enterprises evolve, conventional monitoring of platforms frequently needs to be expanded upon or customized. For this purpose, Red Hat offers the Cluster Observability Operator, which provides capabilities that satisfy complex telemetry requirements. With the help of this operator, administrators can create customized observability stacks, built to specific services or multi-tenant groups of users.
The recent development of the platforms has played a role in the emergence of modern dashboards, including the incorporation of the Perses dashboarding application through the Cluster Observability Operator. This application provides a modern, extensible and GitOps-based approach to visualization, enabling visibility of dashboards across several clusters once it is integrated with the Advanced Cluster Management from Red Hat.
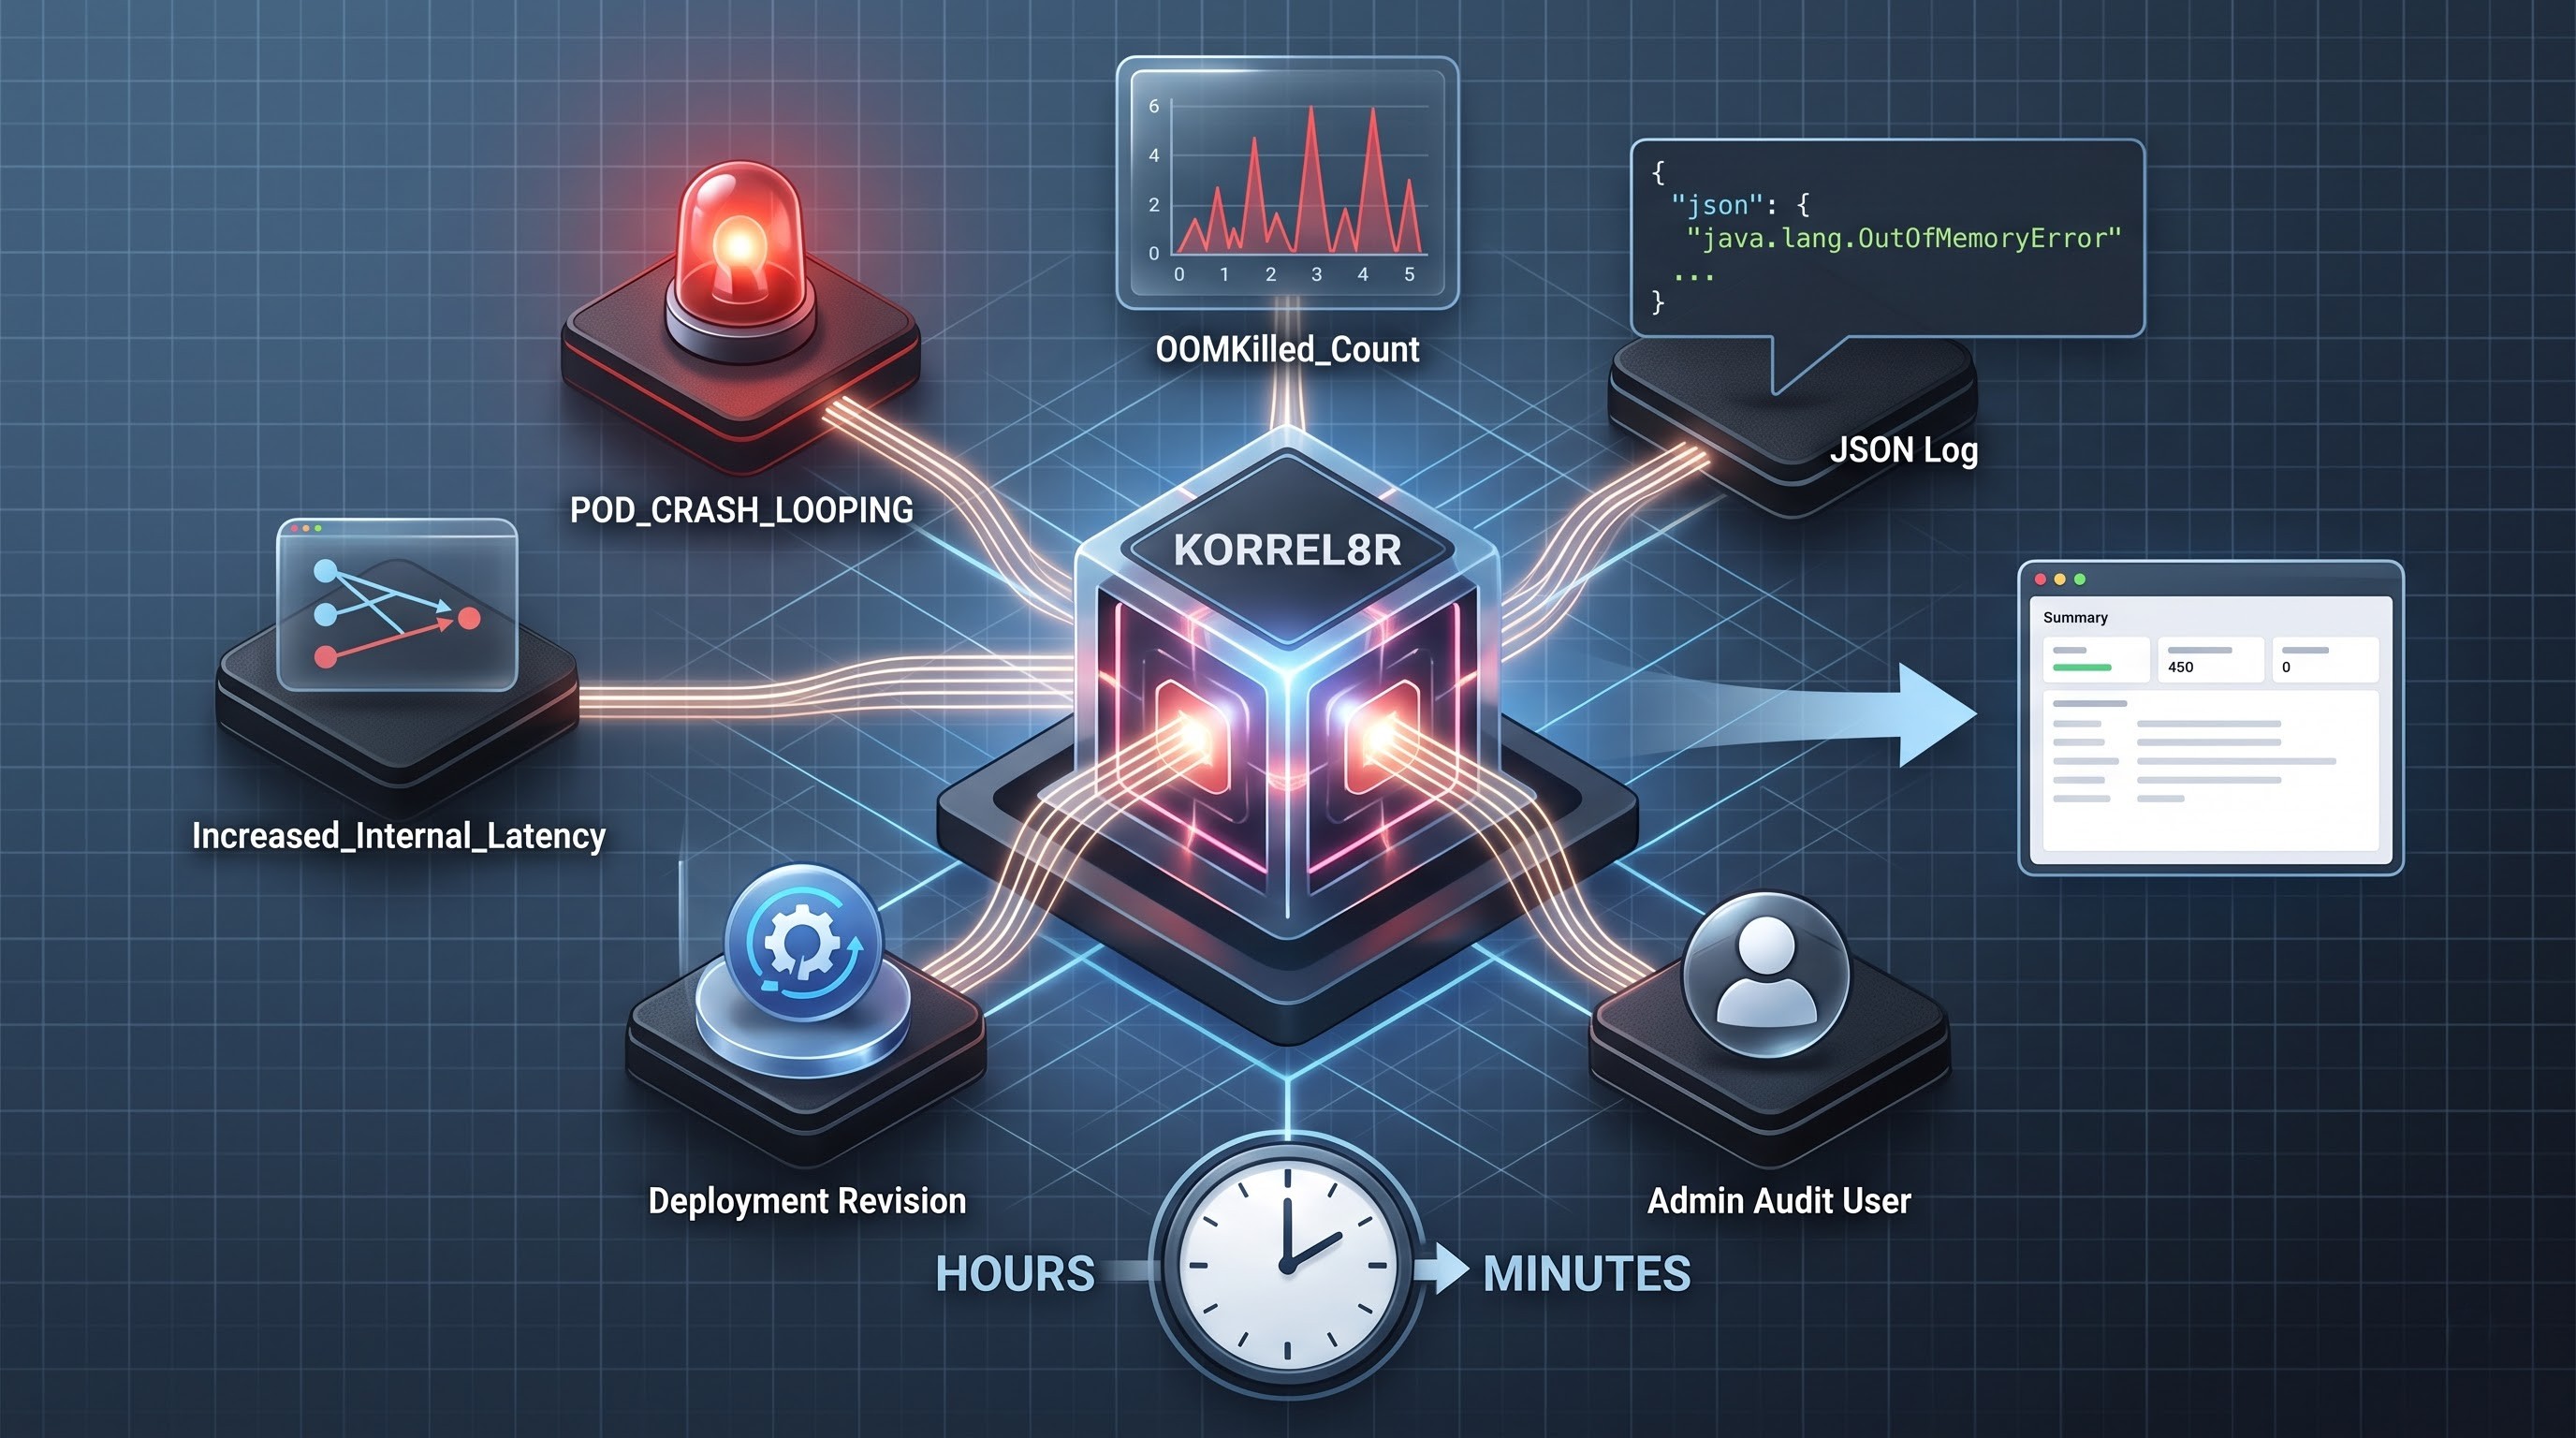
The newest innovative technology in OpenShift observability is the signal correlation feature introduced by Korrel8r. Previously, operators had to continually switch between various screens to identify the root cause of problems related to metrics, logs, network traces, and alerts. However, an intelligent correlation engine now automatically links pre-existing telemetry signals. Now, whenever an alert occurs within a specific pod, signal correlators will yield a complete picture of related metrics, logs, network flows, deployment events, and so on. Thus, while it previously took operators hours to troubleshoot incidents, it now takes minutes.
OpenShift Logging Architecture
Metrics reflect the state of the system, while logs tell what really happened. OpenShift has a powerful centralized logging subsystem. The Cluster Logging Operator manages it. In a container environment, application logs are not persistent. If a container crashes, restarts, or is re-assigned to a different node, logs are gone unless they are collected instantly.
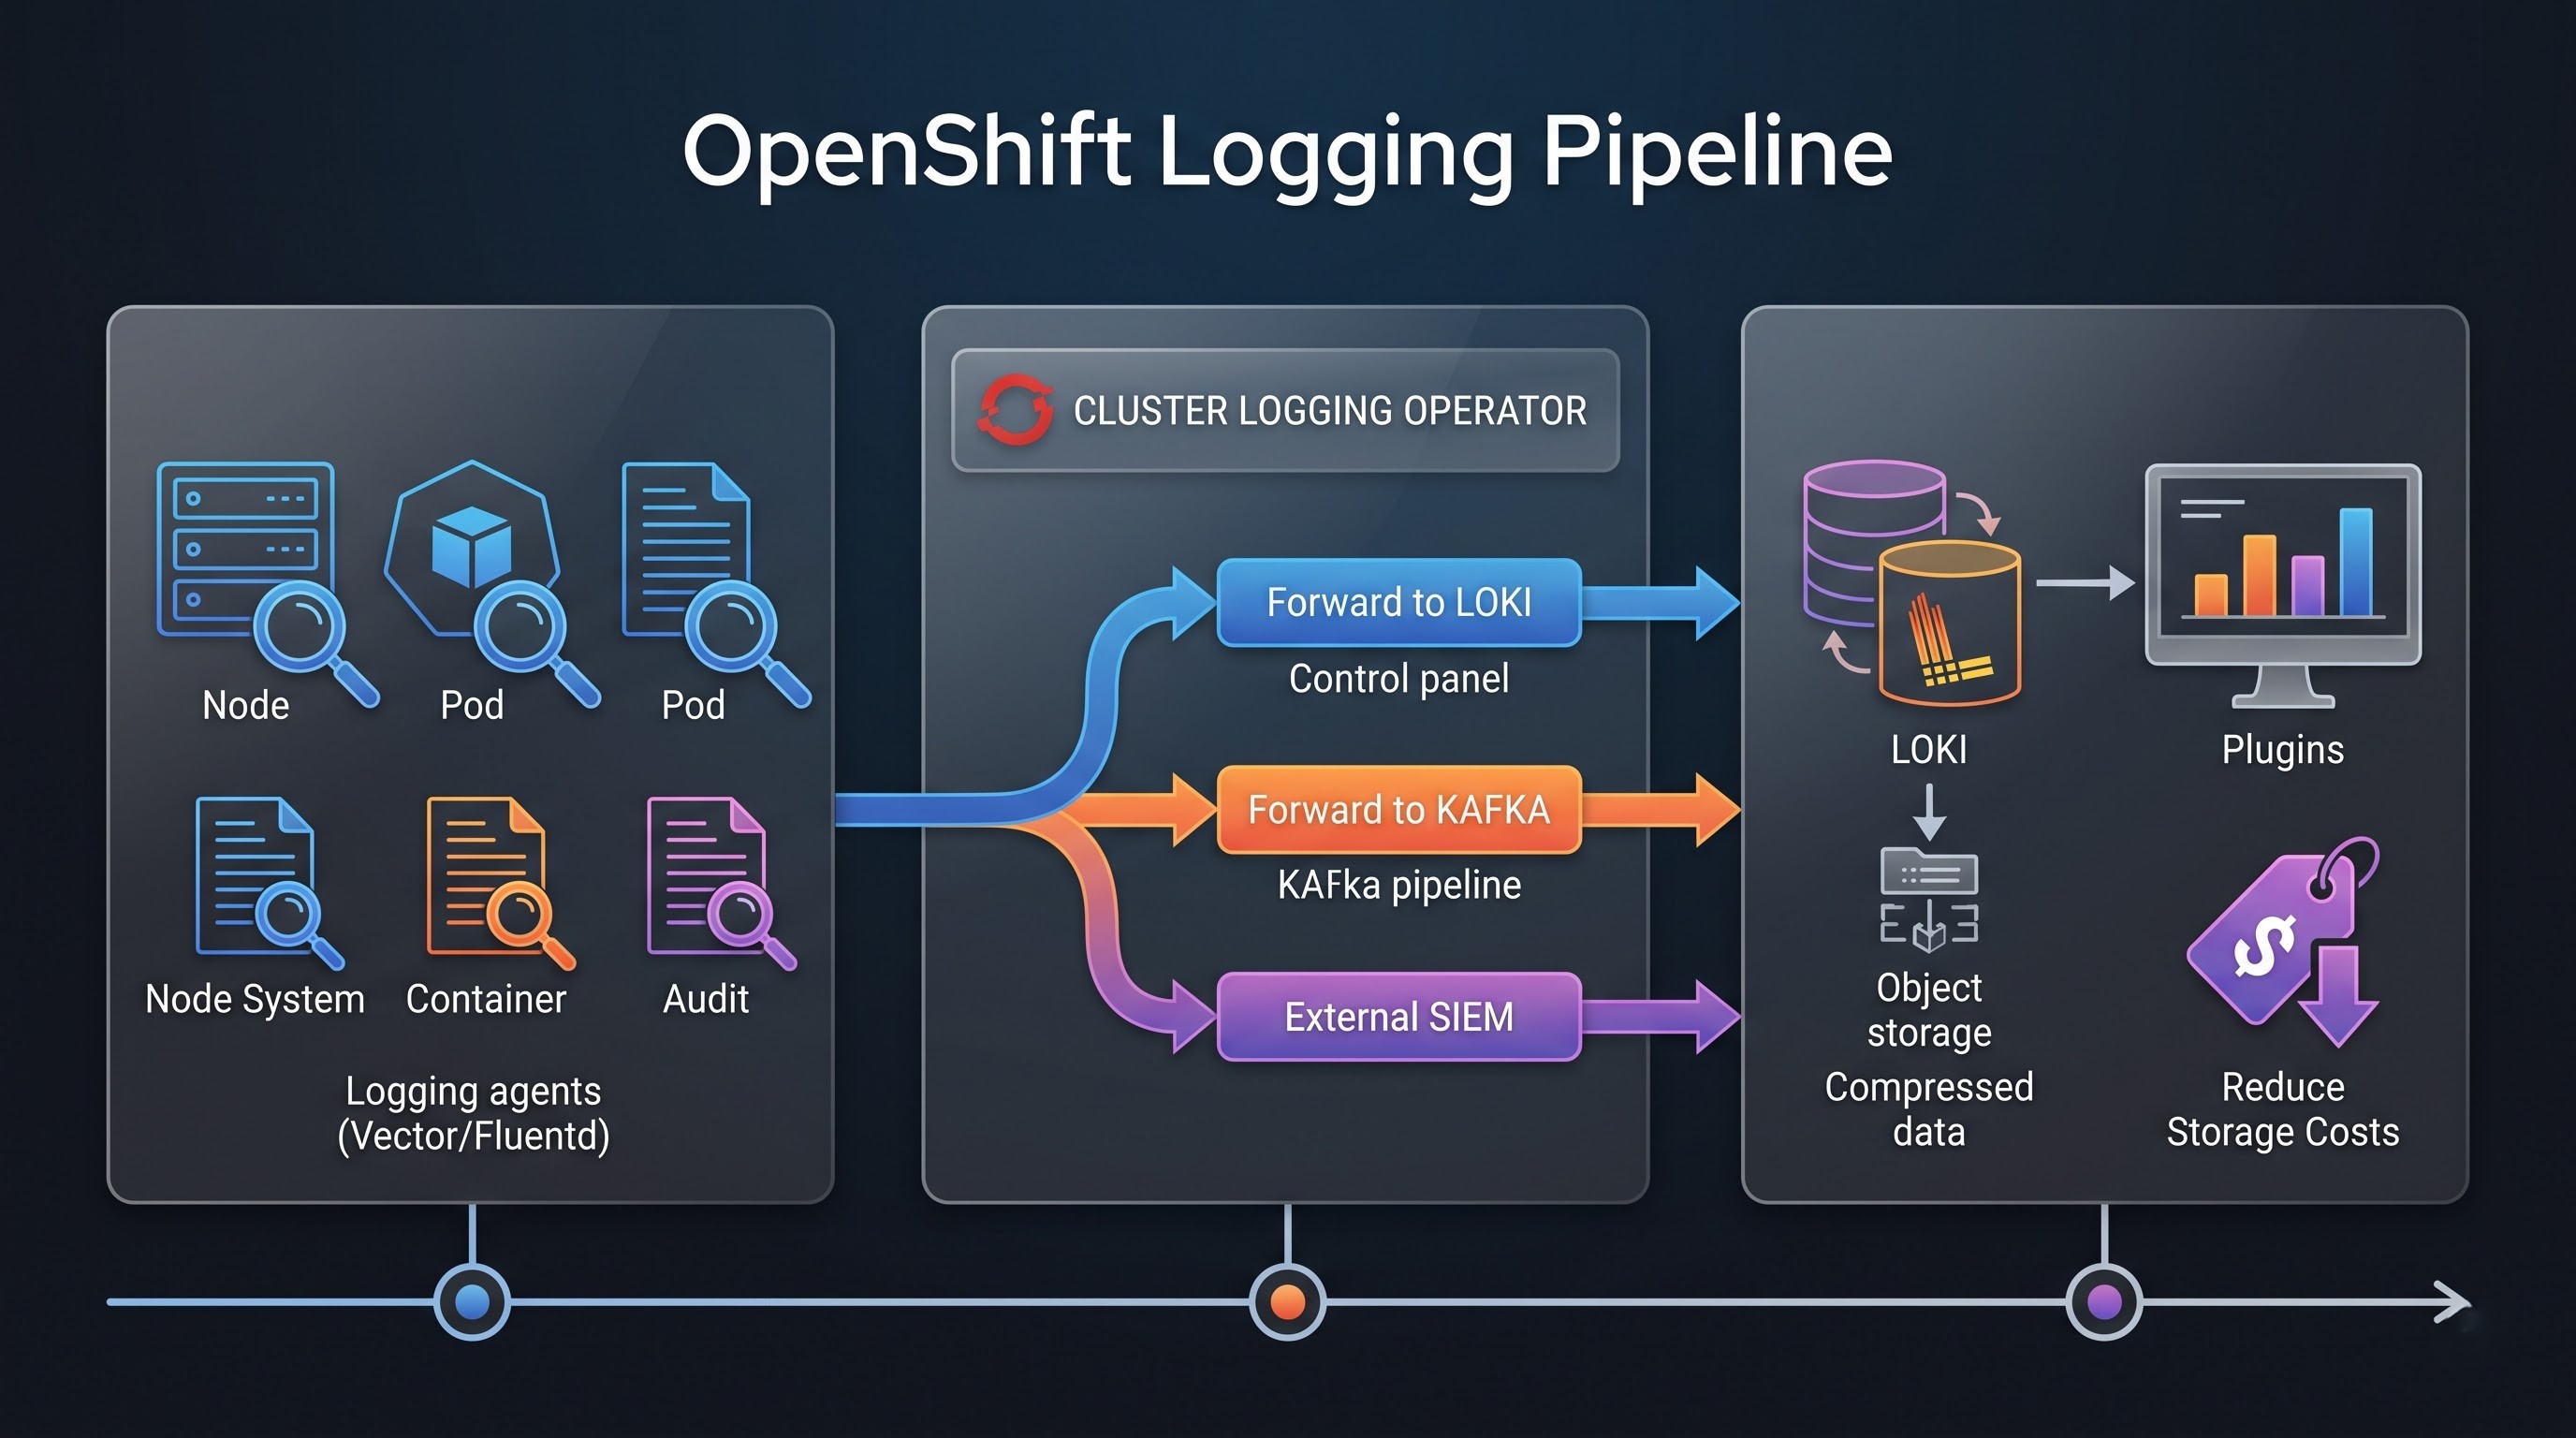
The architecture of Cluster Logging has three major functional stages namely, logging collection, logging forwarding, and logging storage.
Logging collection is accomplished by using simple and light-weight collector agents that are used across the nodes in the cluster. Logging collection is done through agents that work as sensitive monitors for node system logs, container log files, and Kubernetes audit logs. In the past, technologies like Fluentd and Fluent Bit were quite common for logging, but new implementations of logging are using advanced pipelines with the use of Vector for processing logs with high efficiency and memory utilizations while also supporting the OpenTelemetry Protocol.
Logging forwarding allows the administrators to control the destination of logs. By using custom resource definitions, teams can define pipelines for forwarding logs.
The management of logging data and its visualization is usually performed by using an integrated tool like Loki or an external enterprise storage system. Loki is a log collection platform that is greatly influenced by Prometheus in terms of design and is noted for being highly efficient as well as scalable horizontally. Loki makes use of indexing log metadata and labels instead of the entire log payload, which allows compression of the logs into object storage and helps save costs by reducing storage concerns without preventing fast querying via OpenShift web console or visualization plug-ins.
Essential Tools for the Implementation of Modern OpenShift
OpenShift has its own state-of-the-art monitoring and observing capabilities, but very often companies find it necessary to enhance their systems with the help of third-party software. Therefore, the choice of the most suitable program depends on the level of development of the organization and the existing enterprise contracts as well as the features that need to be fulfilled.
Prometheus and Grafana are the two oldest open-source solutions for collecting and representing metrics. Grafana allows creating marvelous dashboards that merge information taken from Grafana, Prometheus, and third-party sources.
For businesses that need to have deep application performance monitoring and distributed tracing, products like the Red Hat implementation of OpenTelemetry, Jaeger, and Tempo are vital. Distributed tracing allows one to keep track of the user requests from the moment they are initiated and throughout all the connected microservices, helping detect the exact gaps in latency, broken downstream dependencies, and serialization time delays.
Additionally, commercial observability platforms have an important place in large corporations. The solutions like Sysdig, Datadog, Dynatrace, Metoro, and IBM Instana are integrated with OpenShift via certified operators. Products leveraging eBPF technology give an opportunity to trace applications and capture telemetry data with zero coding required, meaning that one can obtain the visibility one needs without making any changes to the application code or recompiling it. Besides, the specialized monitoring tools used in Kubernetes enhance the security posture of systems during runtime, ensure the detection of threats and compliance auditing.
Best Practices for Monitoring Cluster Stability
Implementing the observability stack is only a part of the journey, and the next step includes responsible usage of the stack in compliance with best practices. In the absence of strict regulations, the monitoring infrastructure will consume resources violating cluster performance and creating overwhelming noise for operators.
The most important practice is to create resource quotas and limits for the monitoring stack. The use of Prometheus and log collectors contributes to the increase of CPU and memory usage, especially in the cases of obtaining metrics with high cardinality or dealing with huge volumes of logs. Administrators must define dedicated resource requests and limits for monitoring namespaces so that telemetry elements do not deprive production workloads of available resources.
Next, teams have to be very careful about metric cardinality. High cardinality is when the labels you add to metrics are such that they can have an infinite or very large number of unique values. For example, using user ids, client IPs or raw request urls as metric labels. High cardinality leads to spikes of memory consumption in Prometheus time-series databases, sometimes leading to crash loops. The practice that has been considered the most effective is using bounded, low cardinality labels like the names of the namespaces, the names of the deployments, the codes of the errors, and so forth while leaving the high cardinality analysis as the job for distributed tracing or log management solutions instead. Those engineers who want to learn how to apply these production practices in the enterprise environment may benefit from participating in an advanced openshift course online, which includes more in-depth modules about cluster health, logging pipelines, and governance of resources.
Another key practice is to optimise the storage retention and scrape intervals. Not every metric has to be kept at high resolution forever. Using Thanos to offload historical summaries to cheap object storage and setting appropriate retention policies for raw operational metrics does not suddenly fill up storage volumes. The introduction of scrape jitter tolerances in high-availability user workload monitoring environments can also greatly reduce time-series database storage overheads by improving chunk compression without sacrificing critical data precision.
Best Practices for Data Lifecycle Management and Logging
Metrics need to be governed carefully, and logging infrastructure needs to be managed rigorously for its lifecycle, to avoid exhausting storage and to comply with regulations.
Structured logging is the foundation of robust logging practices. Applications should log in structured formats such as JSON, not in unstructured plain text. Structured logs contain explicit key-value pairs for things like error codes, transaction identifiers, user roles, and service names. This enables log collectors and backend query engines to index and filter logs in real time, and without the expense of compute-intensive regular expression parsing during incident investigations.
Just as important is managing log levels. In production environments, verbosity of logging levels should be dynamically disabled or only used in dedicated debugging sessions. Running applications at debug or trace log levels produces enormous volumes of data that saturate network bandwidth, swamp storage clusters, and escalate cloud infrastructure costs with little to no operational value.
Data classification and data access control must also be enforced across all log streams. OpenShift clusters often contain sensitive data such as personally identifiable information, authentication tokens, and financial transaction details. It’s important that administrators enforce strict role-based access control policies on log stores, so that developers are able to only access logs for their particular namespaces, while compliance and security teams have audited access to broader infrastructure and audit logs. Finally, implementing automated log rotation, compaction and expiration policies purges or archives historical logs per corporate retention mandates.
Alerting Strategy, SLOs and Mitigating Alert Fatigue
Ineffective alerting strategy is one of the biggest threats to the operational stability. When operations teams are flooded with hundreds of low-priority or false-positive alerts a day, alert fatigue kicks in. Critical production warnings are missed or ignored, resulting in long downtimes and significant business impact.
To develop a healthy alerting strategy, organisations need to move from infrastructure-centric alerting to user-centric and symptom-based alerting. Teams should alert on service level objectives and user facing symptoms, not alerting engineers because a single pod CPU utilisation spiked to ninety percent (which may be perfectly normal behaviour for a scaling workload). If error rates go above a certain percentage or request latency goes beyond the thresholds that have been set, then an alert should go off because the real user experience is going downhill.
Alerts should be urgent, actionable and well documented. Every alert rule defined in Prometheus or Alertmanager should contain a runbook link or clear diagnostic instructions to allow the on-call engineer to understand the context and perform remediation steps immediately. Moreover, alerts should be arranged with sufficient levels of severity. Interrupting pagers with notifications should be for critical, actionable emergencies that require immediate human intervention. Informational or warning-level notifications should be routed to an asynchronous ticketing system or chat channel for review during normal business hours.
Refinement should be constant. In post-incident reviews, teams should regularly review firing alert histories, discarding noisy alerts, tuning thresholds that cause false alerts, and aggregating related alerts to avoid alert storms during cascading failures.
Telemetry improved governance, FinOps and cost optimisation
OpenShift clusters are scaling to thousands of nodes supporting hundreds of different business units. The cost of compute and the money to run an exhaustive observability infrastructure can quickly spiral out of control. If you let metrics be scraped without limit, logs streamed without limit and keep everything forever your telemetry components can easily end up using a surprisingly large percentage of your total cluster compute power. So the strict financial operations and resource governance specific to monitoring and logging stacks is an important pillar in enterprise cluster management.
Platform engineering teams should implement chargeback or showback models that charge the consuming application teams directly for monitoring and logging resource consumption to control runaway telemetry costs. By tracking metrics ingestion rates and log volume generation per namespace, organisations can get a precise understanding of what it actually costs to run specific workloads. When application teams see the direct impact on their departmental cloud budget from generating verbose, unstructured debug logs or high-cardinality custom metrics, it’s natural for them to maximize their telemetry footprint. Also, the platform administrators should enforce rate-limiting and ingestion throttling rules at the log collector and metric scraper boundaries to avoid rogue applications flooding the central time-series and log databases during unexpected traffic spikes or software anomalies.
Conclusion and the Future of Cloud-Native Operations
Observability is not a static product you deploy and forget; it is an operational discipline that is ongoing. As container platforms mature and workloads become increasingly distributed across hybrid cloud and edge environments, the tools and practices that govern OpenShift monitoring and logging will keep evolving.
Organisations can take advantage of the robust native capabilities embedded in Red Hat OpenShift, including the Cluster Monitoring Operator, user workload monitoring, advanced signal correlation, and unified logging pipelines to harness a rock-solid foundation for operational health. By using cardinality judiciously, structured logging, symptom-based alerting in line with service level objectives, and a culture of continuous feedback, engineering teams can avoid reactive firefighting.
In essence, mastering OpenShift monitoring and logging provides enterprises with unparalleled operational visibility, enabling high availability, a bulletproof security posture, and rapid innovation velocity in an increasingly cloud-native world.
To sum up, open source monitoring and logging is critical for achieving comprehensive organizational transparency. This ensures constant data availability, high degree of security, and fast innovative process in a cloud-dominated reality. openshift online training is the best way to acquire necessary knowledge and skills in this field from the practical point of view.