
In Data science we can share Information by using reports. It makes distributing the results in a simple manner and avoids, the copy /pasting designs into emails. By the unique button click option, you can show text, code, and charts from worksheets and so that you can easily spread data with others in your Enterprise by a sending them a URL. So that is why reports make data science easy.
So till now, we have gone through the importance of reports in Data Science.
Get in touch with OnlineITGuru for mastering the Data science online Training.
Now we look at how to publish a Report.
Report Publishing:
Files types are required for Publishing Reports, so we will see some examples of them.
1).md
2).html
3).ipynb
We have two methods for publishing reports.
- If you want to publish a file from a file preview page, you should press the publish button above the content of the file.
- After that click on publish report option by quick drop-down actions option. publishing dashboard displayed to fill in the way of your file.
- After that select start a new report option and make the report with a Description and title.
Publishing and Running a Report:
you can publish a report in a single step by running a notebook. On the screen of the report published, you can select publish radio button and run option. we have drop-down boxes types are two for optioning resources on based on computation.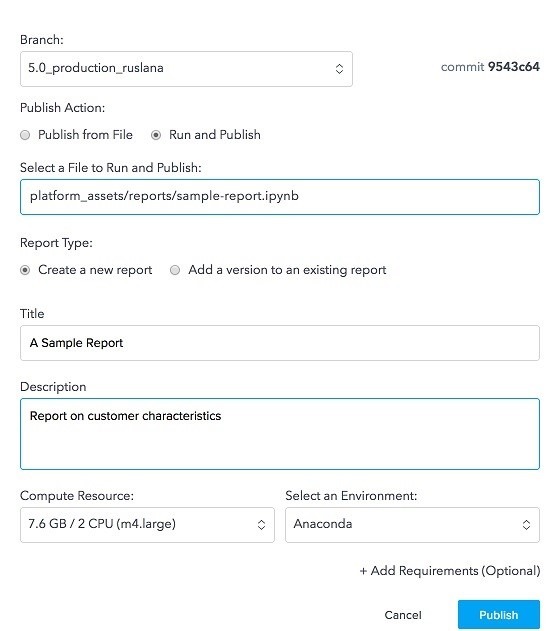
Now you should select resource size and Environment for processing the notebook and press on publishing. This will start an example of the selected size and Environment and starts running the notebook.
Now your report can be view under project progress
How to prepare a .rmd (R markdown) File for Publishing:
In a running R studio session R markdown files are saved, rather than saving outputted files to the .rmd file. You have to change the Html doc inside your Rstudio if you want to publish an R Markdown document on the Report form.
Then from R studio, make the running file of R markdown file from bottom to top, loading all outputs, tables, charts. so that you can use knit HTML, button by the .rmd window header or on the console of Rstudio, you can implement by practically by following the command.
Rmarkdown::render(‘my-analysis.rmd)
On the minimum level. The header file of R markdown should have to be on the output type as HTML. Here's sample header.
Title: “My Analysis “
Output:html_document
Optimize the output Html file to Project source. After that from the tab of files or from the fast actions drop down, implement the HTML file as a Report.
If you want to get the control on your client's code for each cell of R markdown Document, please make use of the echo option, as the below R markdown Documentation.
For Instance to secure code from forming it to Report, form your code like the below:
### here’s where my analysis gets back
‘’’{r echo=false}
Plot(some_data)
‘’’
Managing and viewing Report:
From project outputs, the page goes through your report. By delete icon, you can delete button, which was located above the content report.
Versions of Report:
you can make changes in the existing report by using Report versions option. Rather than creating a total fresh report, you can go for the version number of that report. This feature is greatly useful when data is updated and if you want to again run the notebook and charts are updated.
By watching the Reports itself, you can get the version list in the version menu on the left corner.here you can process so many types of reports. We have two ways to create a new version of the report.
New Version can be Published within a report:
The best way to create the latest version of a report is to jump in the report itself and select new report version. In that same window select your branch and select option stating “ add a version of the report which was already existing “ then enter the path of your notebook and enter your report name. after selecting publish the latest version of your report.
Version Deleting:
You can delete the version of your report. In your report Choose the version which you want to delete. on the left and click version delete in the upper right corner of the version report.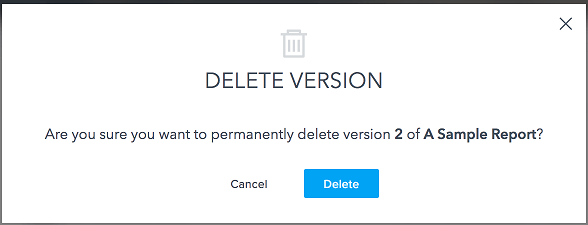
Recommended Audience :
Software developers
Project Leaders
Team Managers
Prerequisites :
Little data on Mathematics, Statistics, and Aptitude is required. R dialect and Mahout to investigate the nuts and bolts required for the course. Counts, SQL, Coding, and Hadoop are benefitted to learn rapidly.The mentor will give self-direction for prerequisites to the course.Checkout in OnlineITGuru now Data Science online training Hyderabad.