
Monitoring plays a major role in every part of our life. It is applicable for both IT as well as Non- IT departments. In IT, Consider the example of the AWS Cloud. This cloud platform offers many services to the people(for example AWS Cloud Watch). But all the services do not create the same burden in the AWS environment. Some cause high weight while the others low weight, And in most of the cases, we do not use all the AWS services.
Even though we don't use all the AWS services, at a time, it creates some sort of usage/ weight in the AWS Environment. So we need to delete all these unused services in the AWS Environment. Moreover, if you start using any service for the first-come, we don't know how much storage/ computation is required. So in this scenario, we need the Monitoring tool to know the things happening in the AWS environment. Then there comes to the picture of AWS Cloud Watch
What is AWS Cloud Watch?
It is the component of Amazon Web Services, that provides real-time monitoring on AWS Resouces and Customer application running on the Amazon Infrastructure.
AWS Cloud Watch is AWS monitoring and management service. It is designed for the purpose of maintaining the used services as well as the resources. This monitoring is designed for developers, IT engineers, System operators to make their life easier. Moreover, this monitoring makes sure that all the services that you are using are running smoothly.
AWS Cloud Watch allows administrators to easily monitor multiple instances and resources from one console using the following tasks.
- This enables, robust monitoring of various tools like Virtual Instance hosted on Amazon EC2, Databases located in RDS, Data stored in Amazon s3.
- Monitors, stores and provide access to system and application file logs
- Provides various alert condition including rules, triggers, high-resolution alarms and sends notifications
- Gathers and provides a real-time presentation of operational data.
Also, check the mastering workday and AWS by easy steps So let us create a cloud watch practically
step - 1:
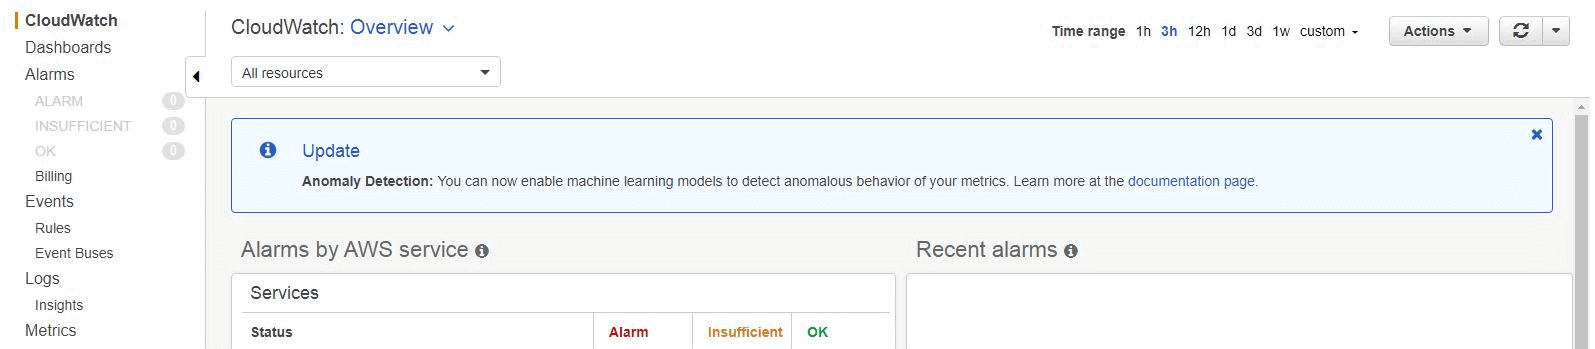
Log in to the AWS account and search for the Cloud Watch. Then you will see the screen as follows
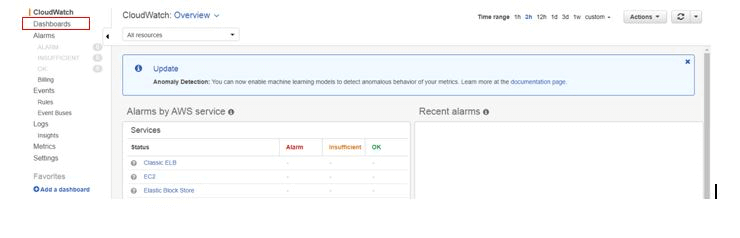
step - 2:
Click on Dashboards
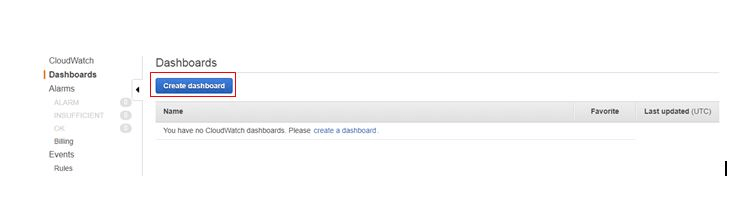
step - 3:
Click Create Dashboard
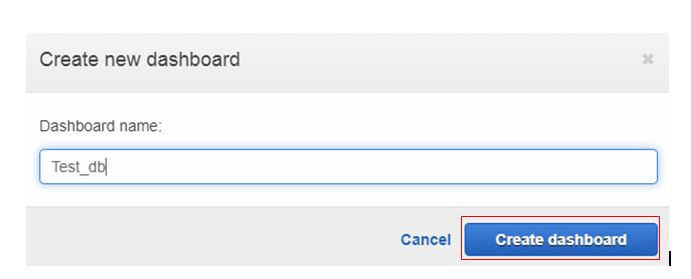
step -4:
Provide any name and click on Create dashboard
step - 5:
Then you will be entering into the following screen
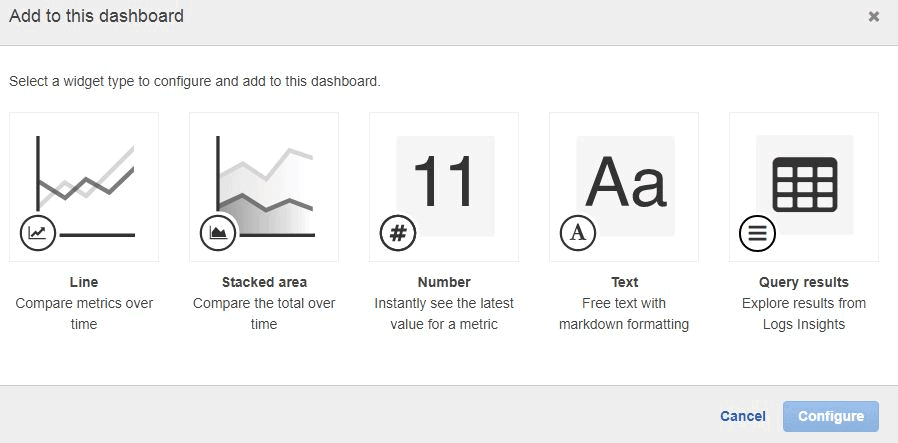
As shown in the above screenshot, this platform provides the metrics in five different formats.
step - 6:
Select any widget and click on Configure.
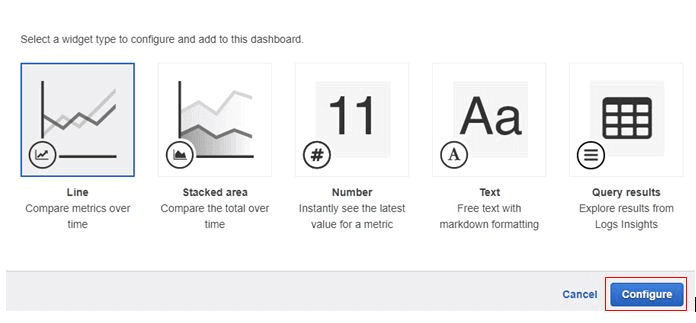
step -7:
select any Metrics and click on Create Widget.
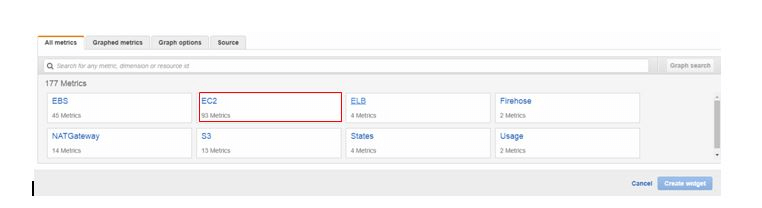
step - 8:
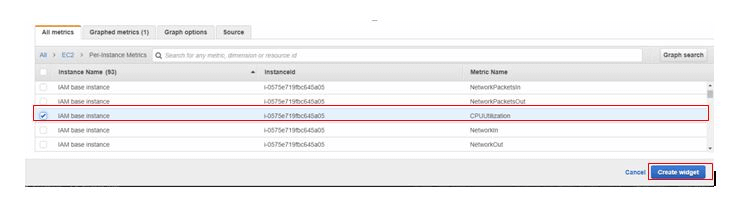
Click on Pre-Instance Metrics
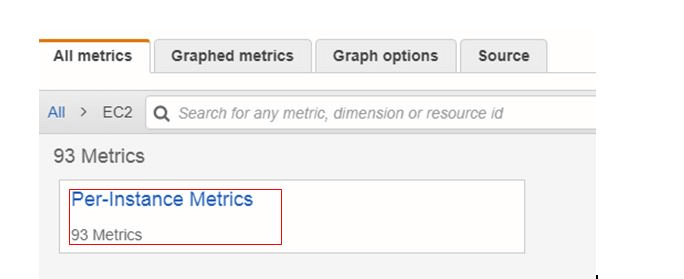
step - 9:
Select any Instance on the basis on Metric Name and click on create the widget.
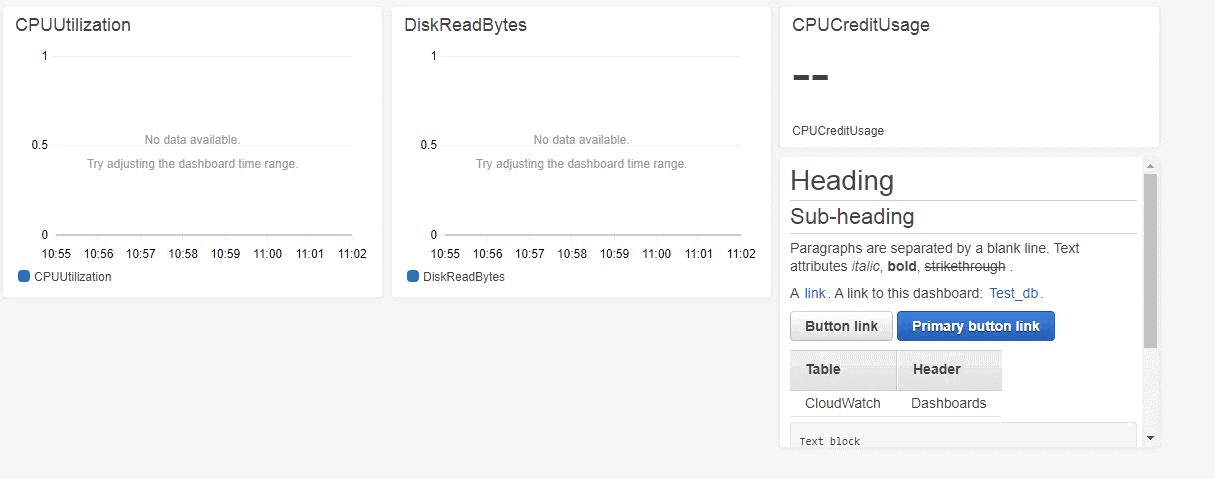
Likewise, you can create any number of widgets of any type as shown below
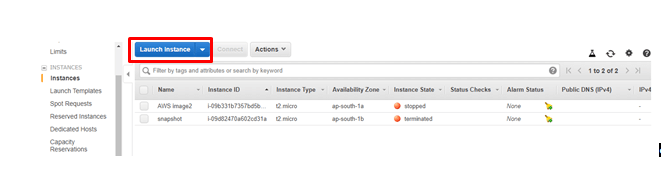
So now create an instance and log in to the session.
Then create the stress to the CPU with the following command
yum install stress
Then you can observe in the dashboard that you have created
Alarm:
It is just an alert (or) the indication in the Cloud watch for a particular condition. Amazon platform allows you to set alarms in order to take action in certain conditions.
So let us see how to create an alarm practically
Alarm Creation:
step - 1:
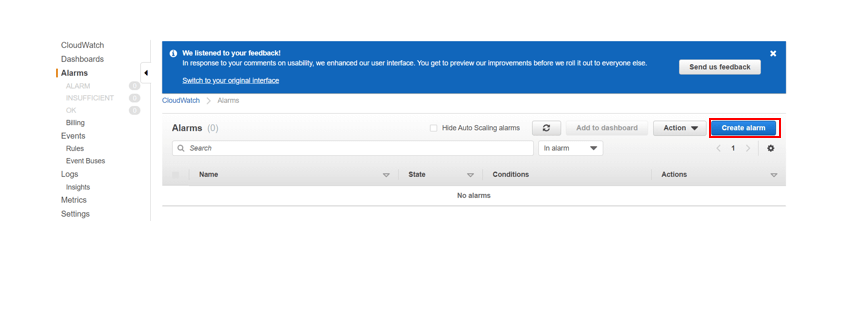
Navigate to Cloud watch in AWS Console and click on Alarms.
step-2:
Click on Create Alarm
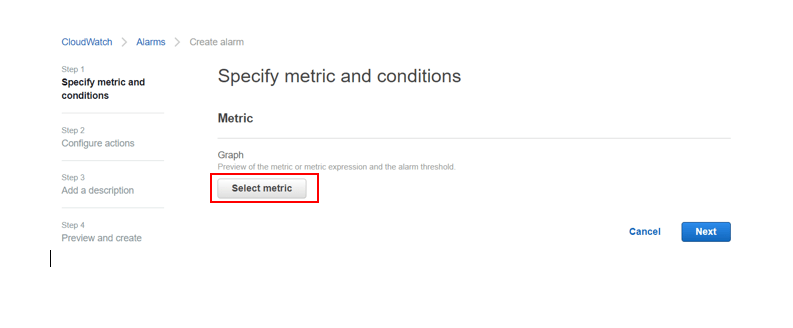
step -3:
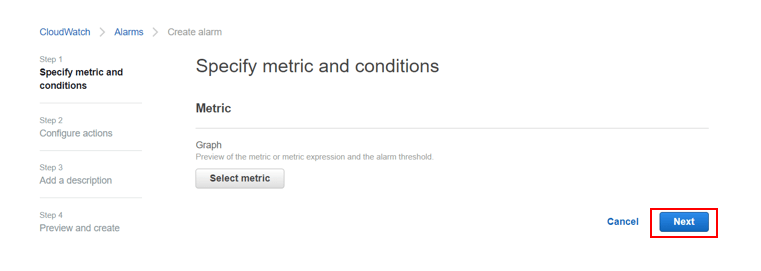
Click on Select Metric
step -4:
Click on Select Metric
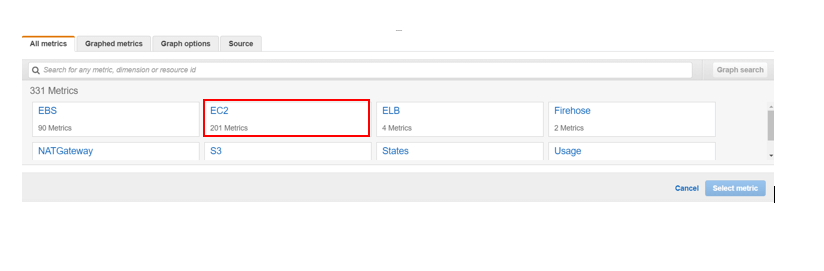
step -5:
Select the Metric. (Here, in this case, I'm selecting Ec2)
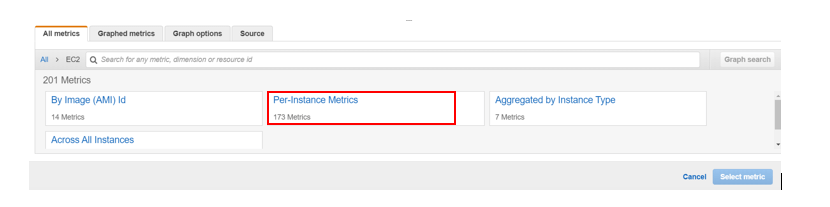
step - 6:
Select any one of the parameters and click on it.
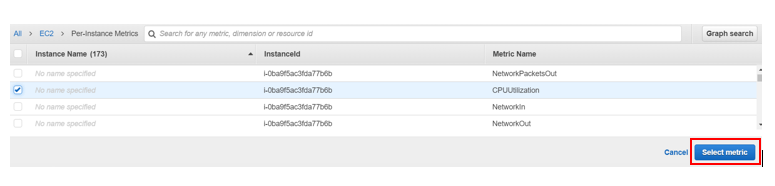
step - 7:
Select the parameter. Here, in this case, I'm selecting CPU Utilization
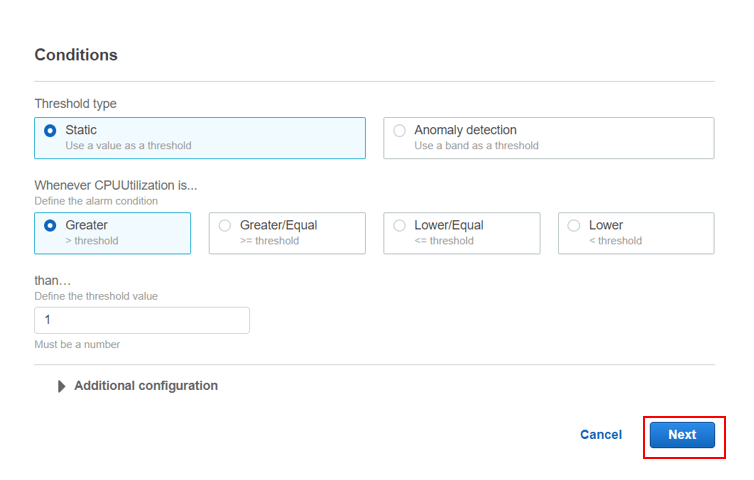
step - 8:
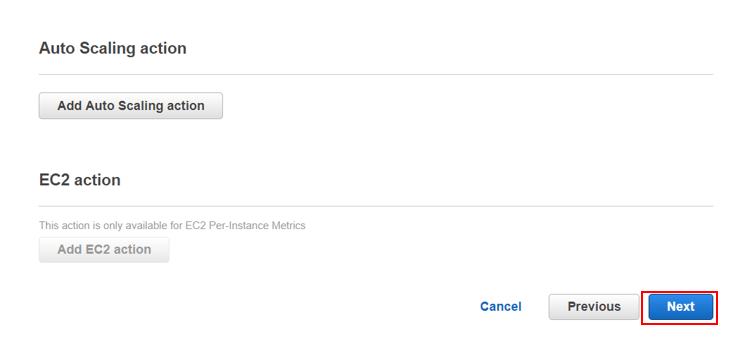
Make modification (if any) and click on Next
step -9:
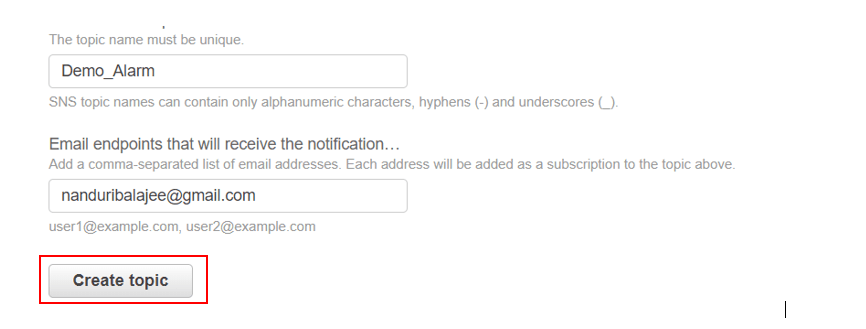
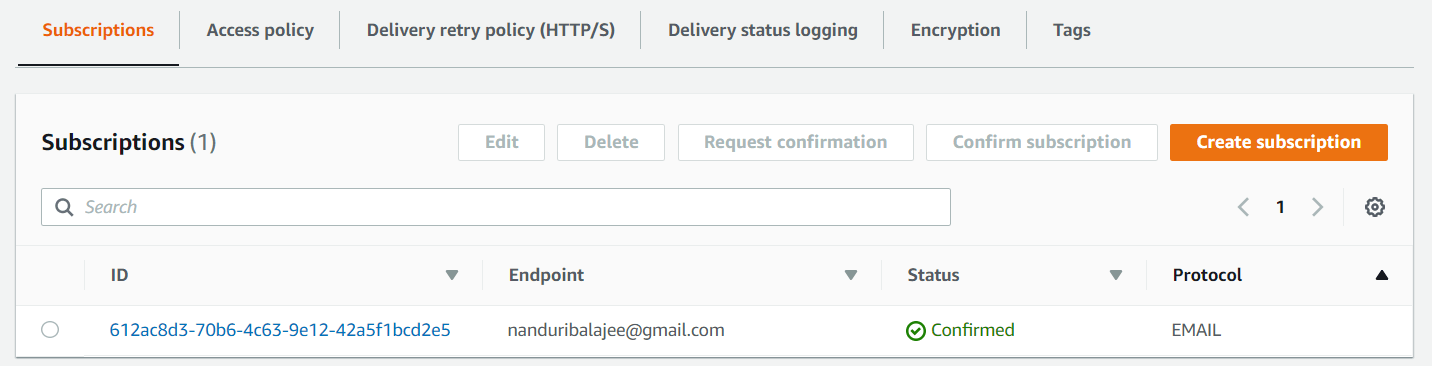
Select on Create Topic and provide the name and email and click on Create Topic
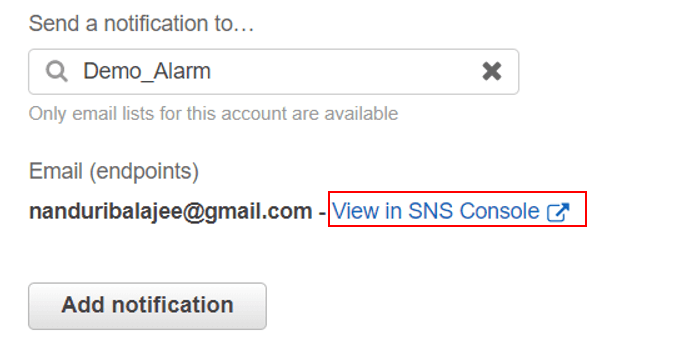
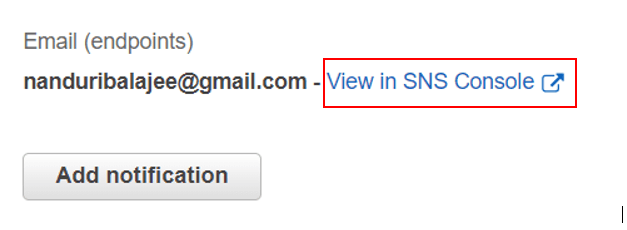
step -10:
Click on View in SNS Console
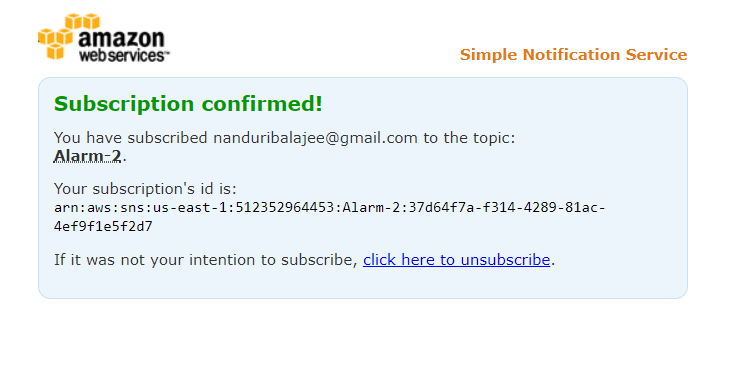
step - 11:
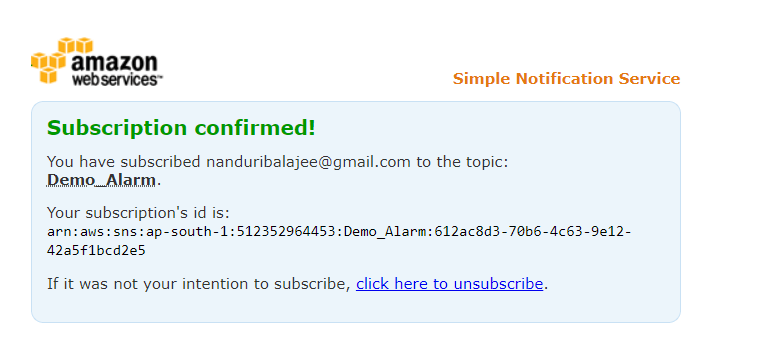
Here you have can see the status as the pending confirmation. So now login to the email that you have provided before and activate the link.
step -12:
Then you can see the confirmation as shown below
step -13:
Reload your SNS tab, then you can see the change in status as shown below
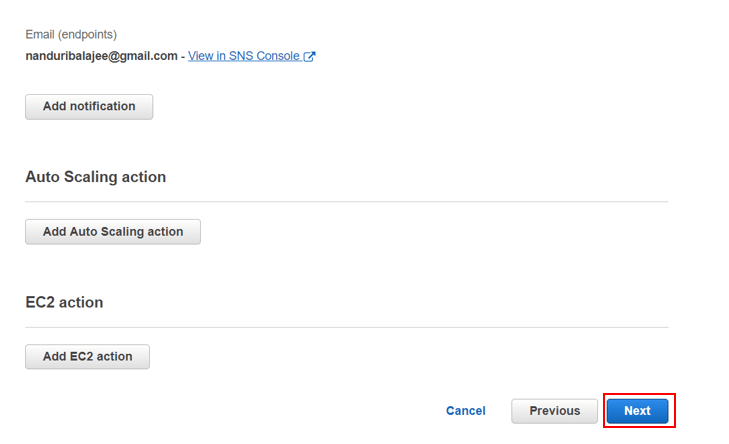
step -14:
Navigate to Cloud watch tab and Click Next
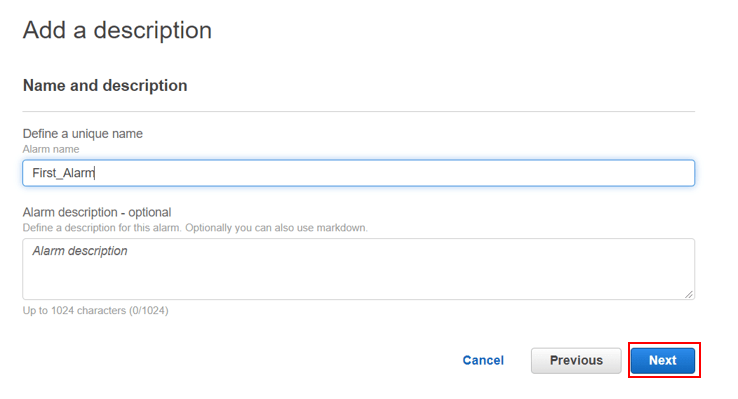
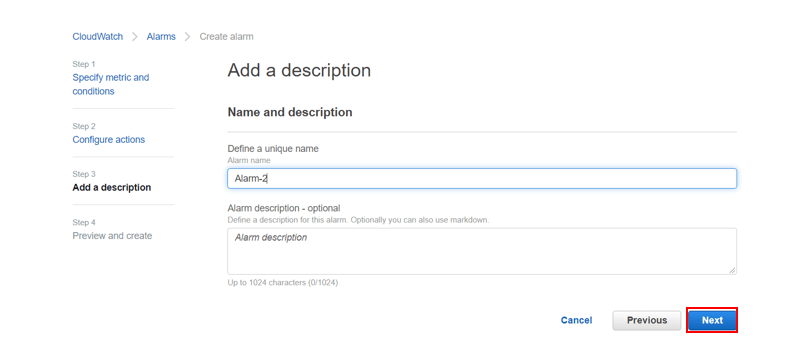
step -15:
Provide any name and click on Next
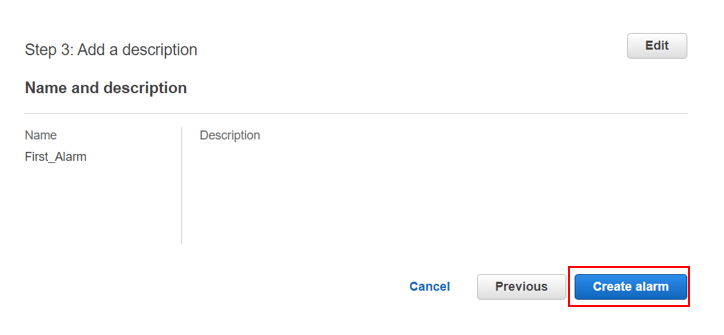
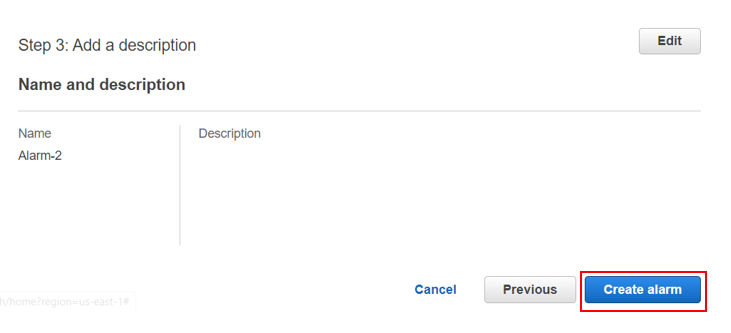
step - 16:
Click on Create Alarm
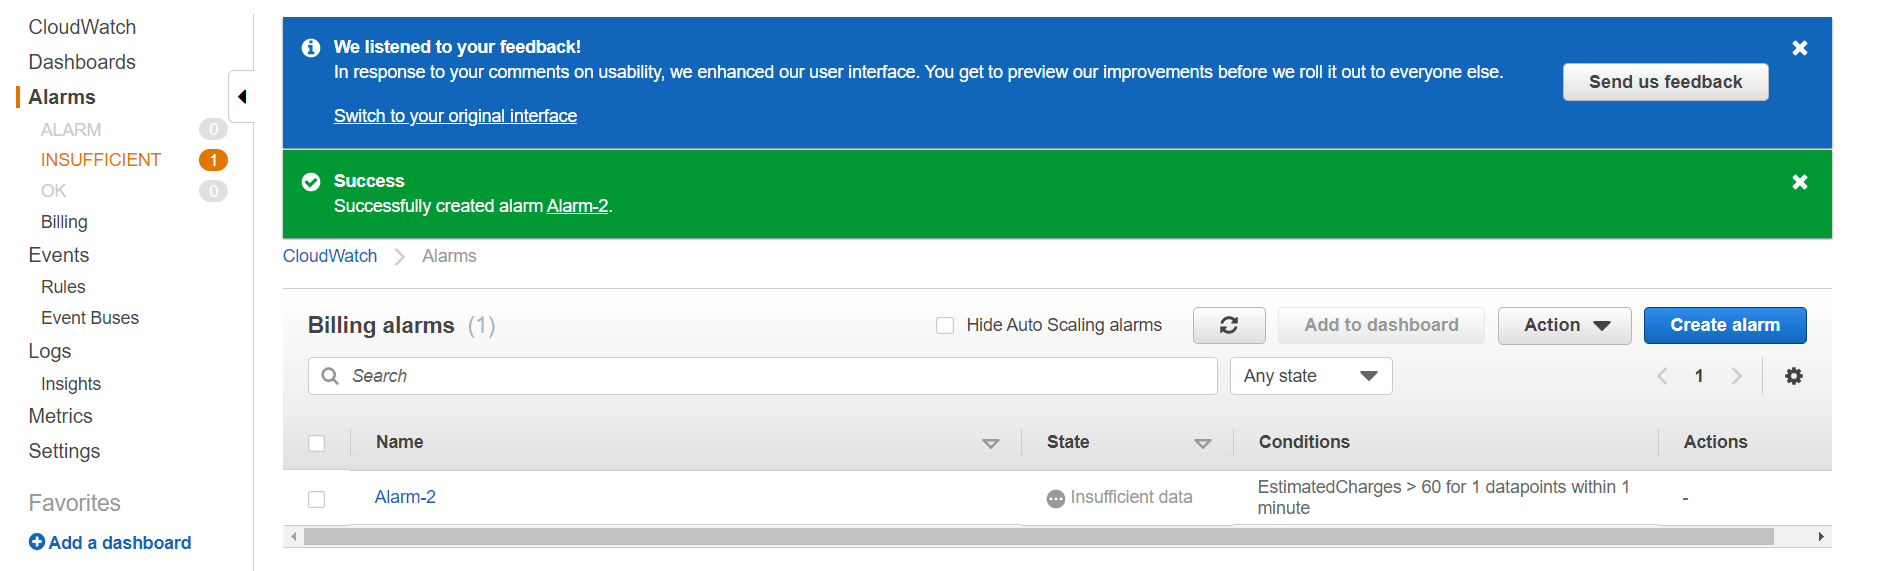
Then you can see the screen as shown below
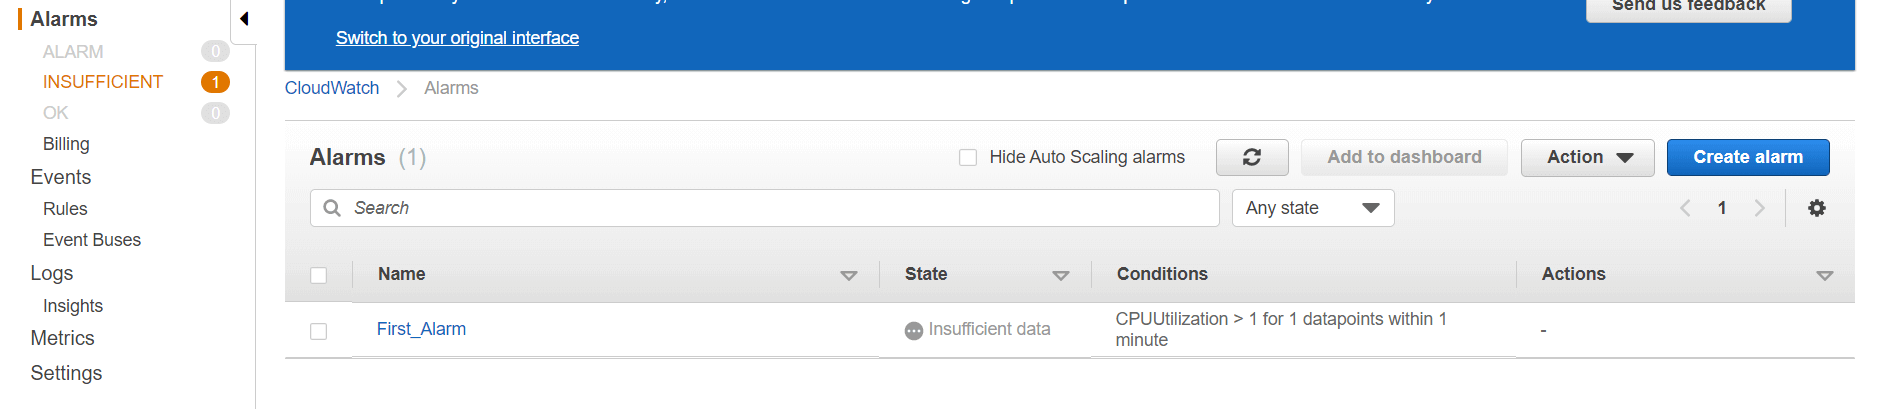
Initially, it will as insufficient and it takes some time to get ok. One you get ok, you can see the analytics in your Cloud Watch
Note:
In order to get ok, you need to create stress in your instance.
I hope you people have successfully created an alarm.
Visit AWS online Training for a more detailed practical explanation.Billing:
Step -1:
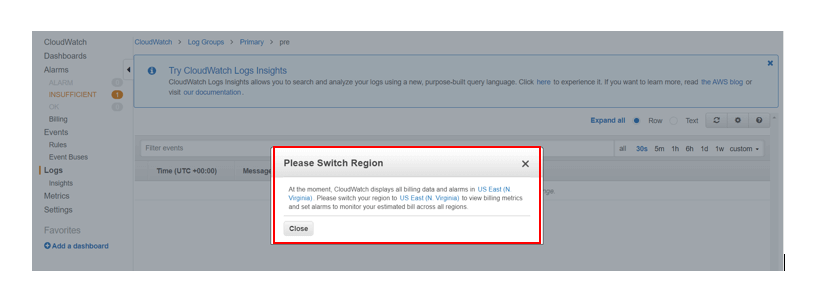
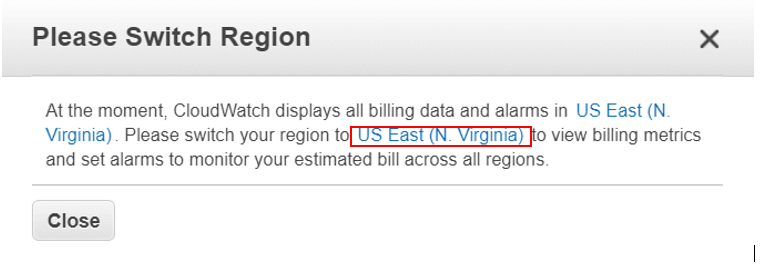
This option works only for North Virginia. So whenever you click on Billing you can see a pop -up as shown below.
step-2:
So Click on US East N.Virginia
step-3:
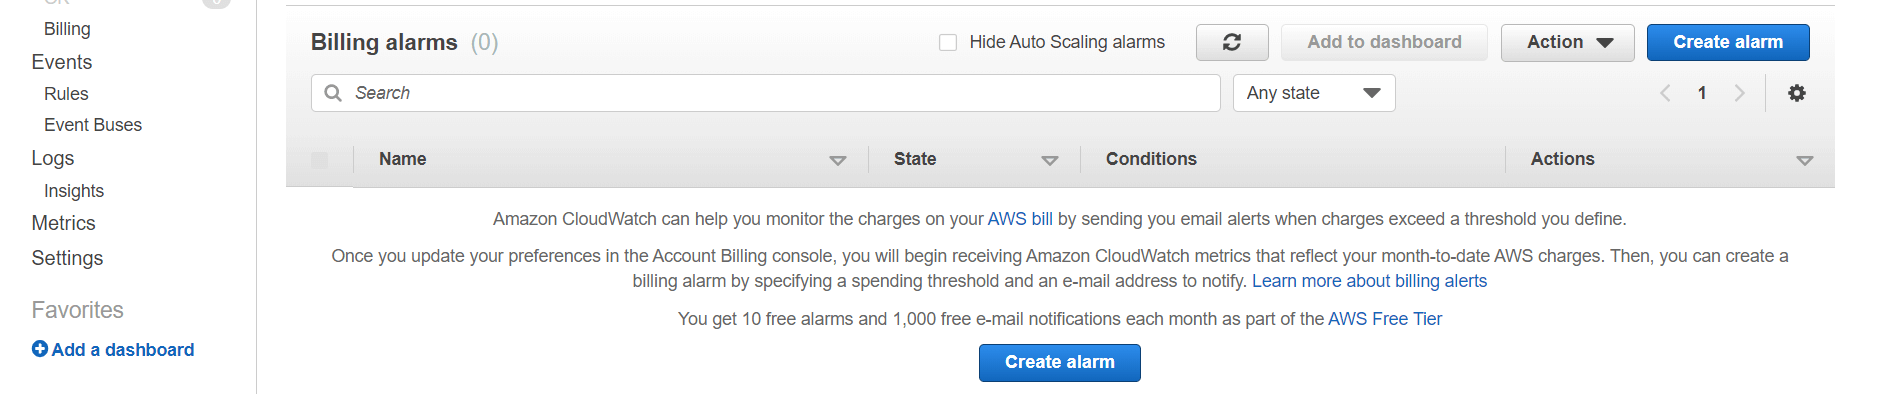
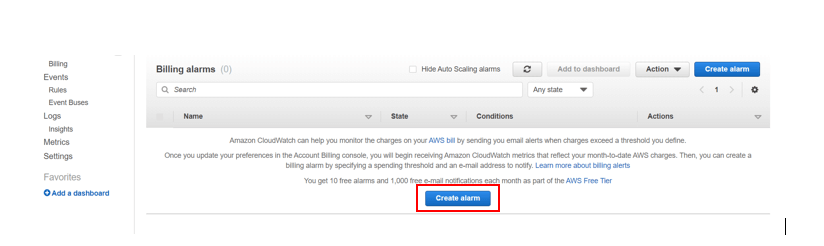
Now again Click on Billing. Then you can see the screen as shown below
step -4:
Click on Create Alarm
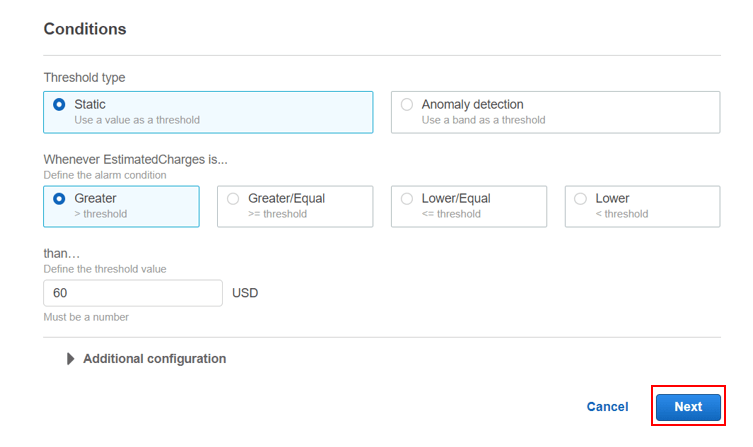
step -5:
Select the statistic and period
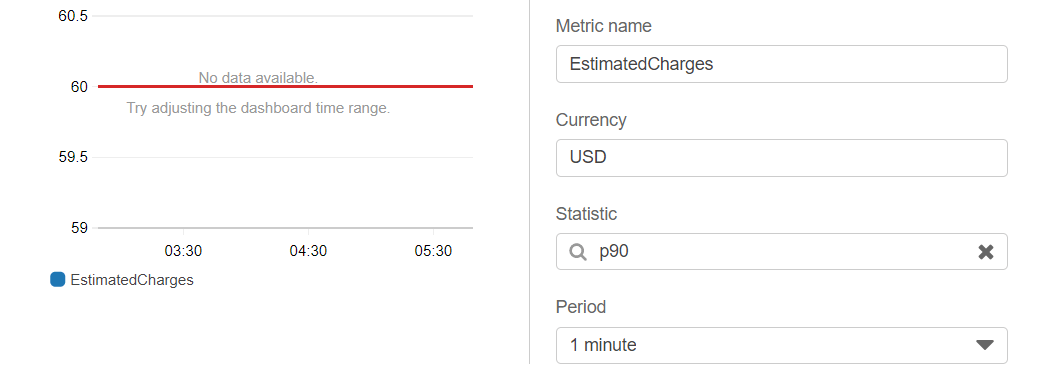
Provide the Threshold value and click on Next.
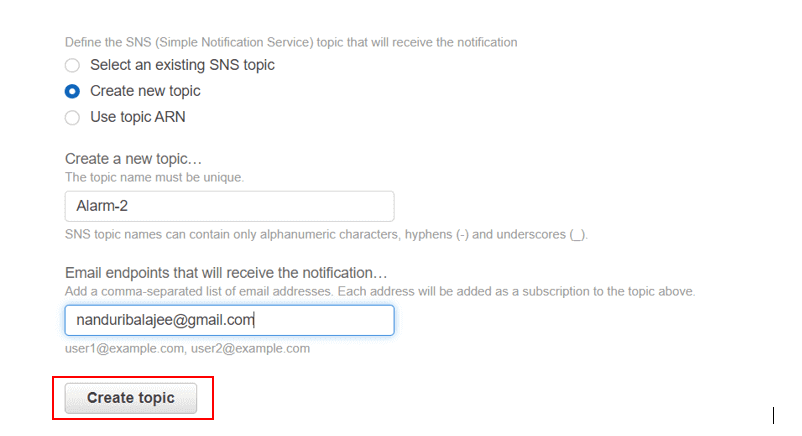
step - 6:
Select Create New topic and provide the name as well as email and Click on Create Topic.
step -7:
Click on View in SNS-Console
step - 8:
Verify and activate the link that you have received your email. Then you can see the confirmation as shown below
step - 9:
Navigate back to your Cloud Watch and click on Next.
step - 10:
Provide any name and click on Next
step - 10:
Finally, Click on Create Alarm
Then you will be entering into the screen as shown below
Likewise, we can create alarms. So now let's move to the rules
Rules:
This is a set a condition to create an alert (or) perform an action in a particular condition. So let us see how to create the Rule
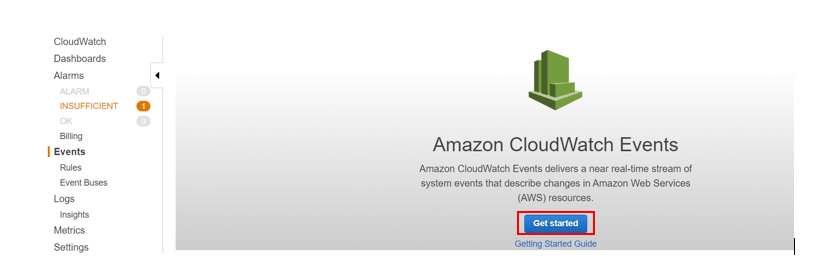
Step -1:
Navigate to Cloudwatch and click on Events
step- 2:
Click on Get started.
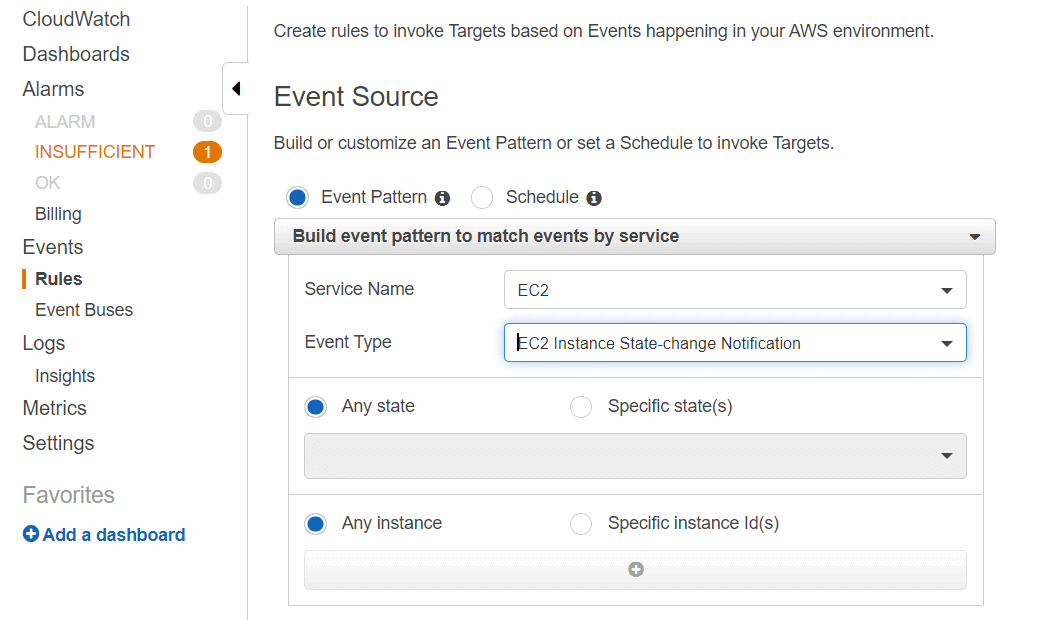
step - 3:
Provide the Service Name as well as the Type
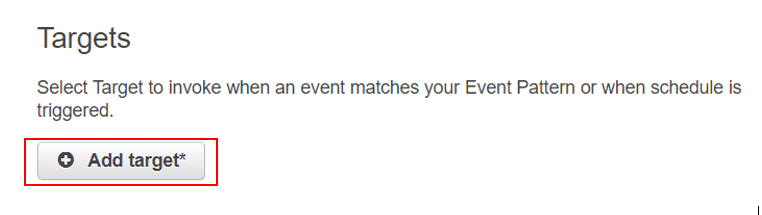
step - 4:
Click on Add target
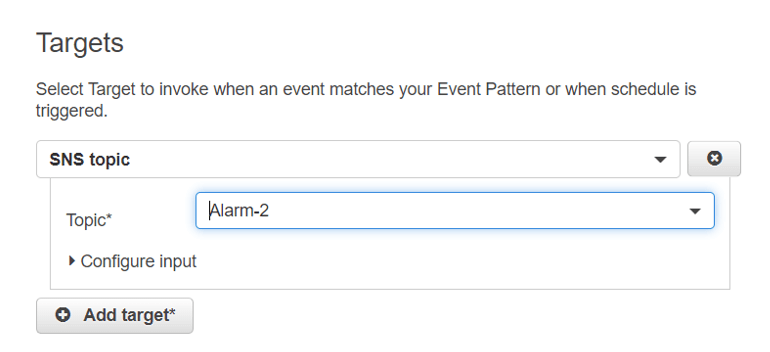
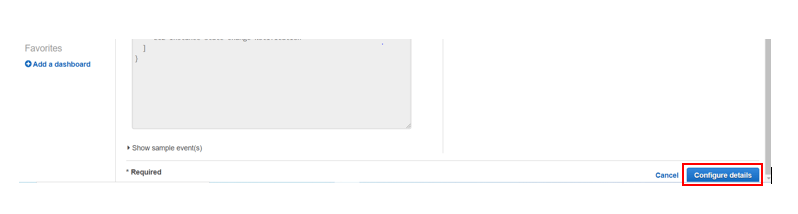
step -5:
Select the topic and Click on Configure details
step - 6:
Provide any name and click on Create Rule
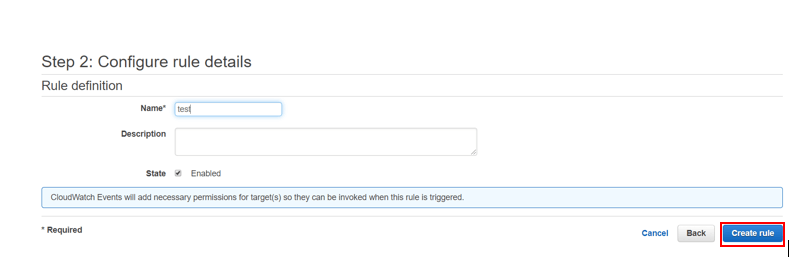
So likewise, we will be creating the rule.
Verification:
Perform any action on the instance like state changing, Instance creation. Then you must receive an email. If you have received, then you are INN
The next Feature in Cloud Watch is Logs
Logs:
These are nothing but analyzing the activity in our account. And we can check the logs happening in our account as shown below
step - 1:
Navigate to VPC and select the VPC that you have created before.
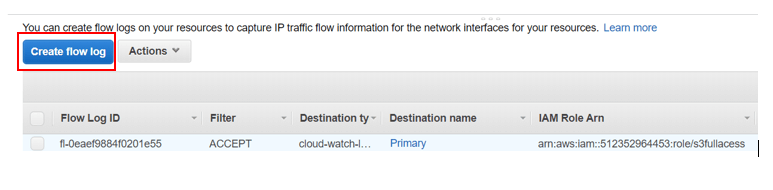
step- 2:
Navigate to the Flow Logs and Click on Create Flow Logs.
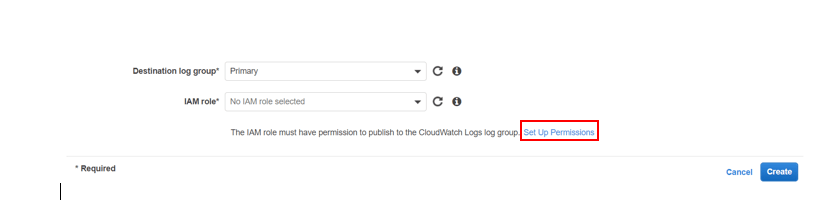
step - 3:
Select the log Group and click on Set up Permissions.
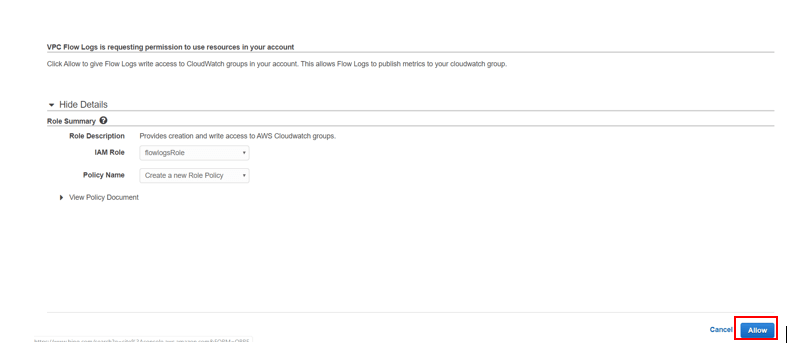
step - 4:
Click Allow
step - 5 :
Create an instance in this VPC and open the Cloud Watch then you can see the logs as shown below.
Cloud Watch Parameters:
Metrics:
- Metrics represent the time-ordered set of the data point, that is published to the CloudWatch
- You can relate the metric to a variable that is being monitored
- These metrics were uniquely defined by the name, namespace and Zero (or) more dimension
- Each data point has a timestamp.
Benefits of Cloud Watch:
- Amazon Cloud Watch allows accessing all your data in a single platform. It is integrated with more than 70 AWS services. Big companies like Vodafone uses amazon Cloud Watch with auto-scaling to monitor the CPU utilization and also to scale the EC2 Instances automatically.
- Provides real-time insight so that you can optimize your operational cost and AWS resources. Many companies use this cloud watch for monitoring. This further helps to make better decisions within the capacity. This further avoid wastage
- Provides complete visibility across your applications, Infrastructure stack, and AWS resources.