
When the product has been developed, salesforce analytics plays a major role. Moreover, app development is not a single /one-time task. The developer should update the application frequently to attract visitors to the applications. Besides adding a new feature to the application, may not always increase the traffic. In some case, the traffic may also gets decrease. So the developer should continuously monitor the analytics to proceed further with the advanced application. In analytics, while analyzing the traffic, reports, and dashboards play a major role. These were much helpful in analyzing the complete application traffic. So today in this block, let us discuss regarding the reports as well as dashboards.
since Salesforce community contains some default applications, it contains some default reports. So now let us discuss how to create/generate a report in a salesforce application.
Basically, in Salesforce the applications were categorized into 4 types
Tabular report:
This is the most basic report. It displays the row records in a table like a format with the grand total. But these reports are not capable to create the dashboards.
Summary report:
In salesforce environment, many people opt this report type. Besides this allows row data grouping. This supports sorting and displays the subtotals.
Matrix report:
This is the most complex report type. This report summarizes the information in a grid format. Moreover, this allows the records to be grouped by both columns as well as rows.
joined Report:
If two (or) more reports have a common key, then this report helps to see the information in a single report.
So now, let us differentiate Matrix as well as the joined Report.
| Matrix Report | Joined Report |
| Matrix Report is used to summarize the data of 2 different type side by side | Joined Report contains the data of 2 (or) more blocks with different data types |
| This is used for checking the data dimension on one another | From a single object, it has a relationship to various report types and can be combined to form a report. |
| It allows users to group data by rows as well as columns | The principal report is considered as the first report and added to the joined report |
| Here Chart, as well as the graph representation, is enabled | It allows the blocks of data which in turn enables multiple views |
| This report type is suggested in complex data summarization | Here, a user is allowed to create a 5 block in a report. |
Till now, in our banking application, we don't have a Report tab on the top bar (menu/ object bar). So now, let us add the Reports tab.
Follow the steps below to perform this,
step - 1 :
Select your application. From the menu bar click on +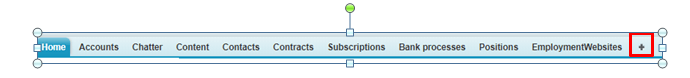
step - 2 :
When you visit the page, Click on customize my tabs.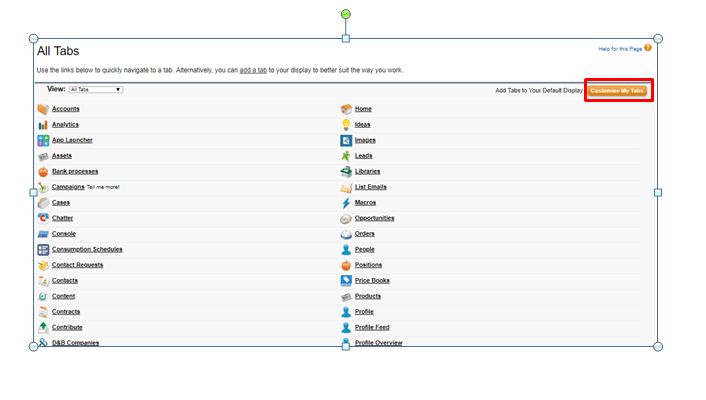
step - 3 :
Here from the available tabs, search for the reports and add to the selected tabs and click on SAVE.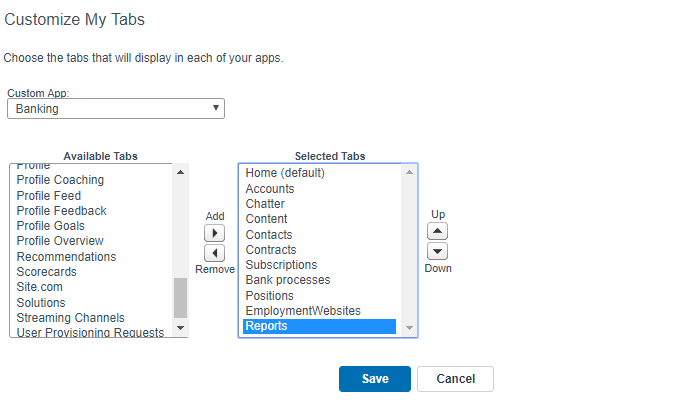
step -4 :
Then you will be finding the reports in the object bar as shown below![]()
So let's start customizing the report in this object.
Report Customization:
step -1 :
From the object menu, click on Reports. Once clicked you will be entering into the following screen. Click on New Report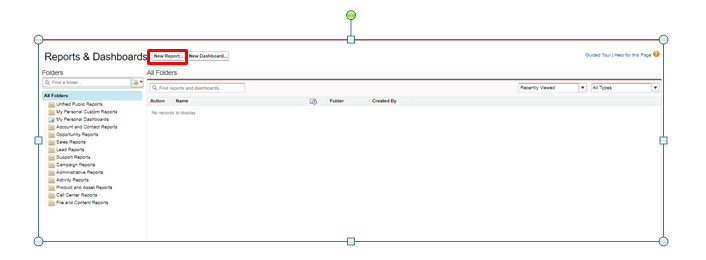
step - 2 :
So from the search bar Accounts, select it and click on Create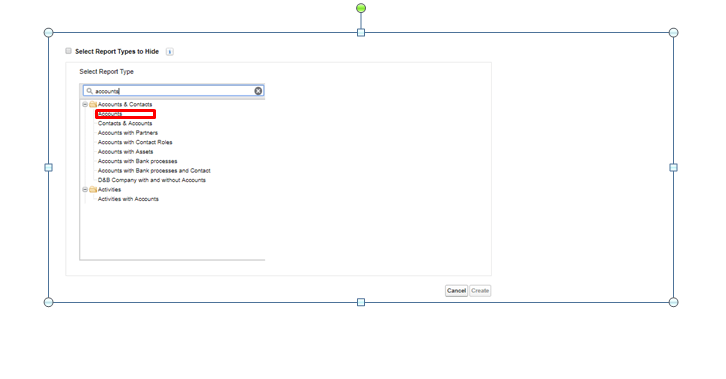
step - 3 :
Here, the Salesforce environment allows add filters. And by default, one filter is enabled. and you can add more if required. Initially, the screen would be as shown below.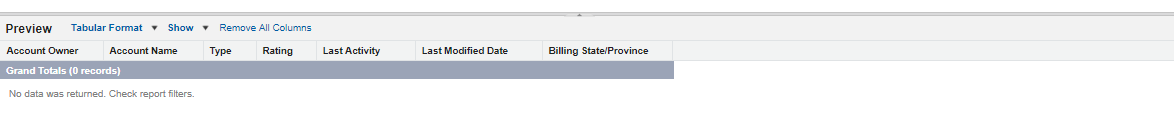
step - 4 :
From the above screenshot, click on Show, and check the details. And I would like to add filters as shown below
From show, column click on ALL accounts. And selected the data field as created field as ALL time. And you can see the records as shown below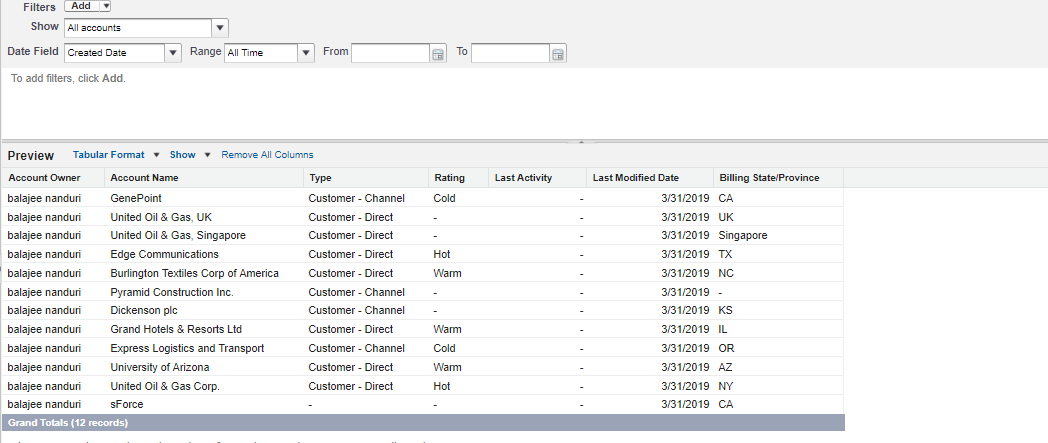
Besides from the left column you can drag and drop the fields. If you observe the above screenshot, it is just a preview and it displays only 20 records(maximum). Moreover, besides preview, you have a format type. Initially, it will be displayed as a tabular format and it allows the users to change into different formats like (Summary, the matrix as well as joined).
And finally, click on SAVE to run the report. So soon after clicking save in any folder( I would like to save in Untitled public reports).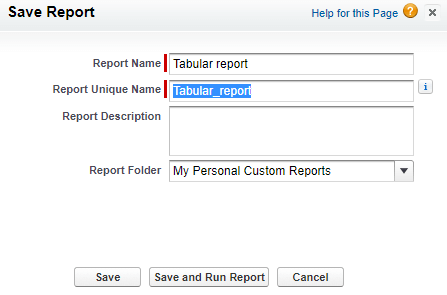
So now, we will move onto the
Summary Reports:
This kind of reports is similar to that of the tabular reports. Besides, this allows you to group the records by simply dragging the fields to the records. So as an example, we will create the summary report with the type opportunities and group it by stage. And you will be entering into the following screen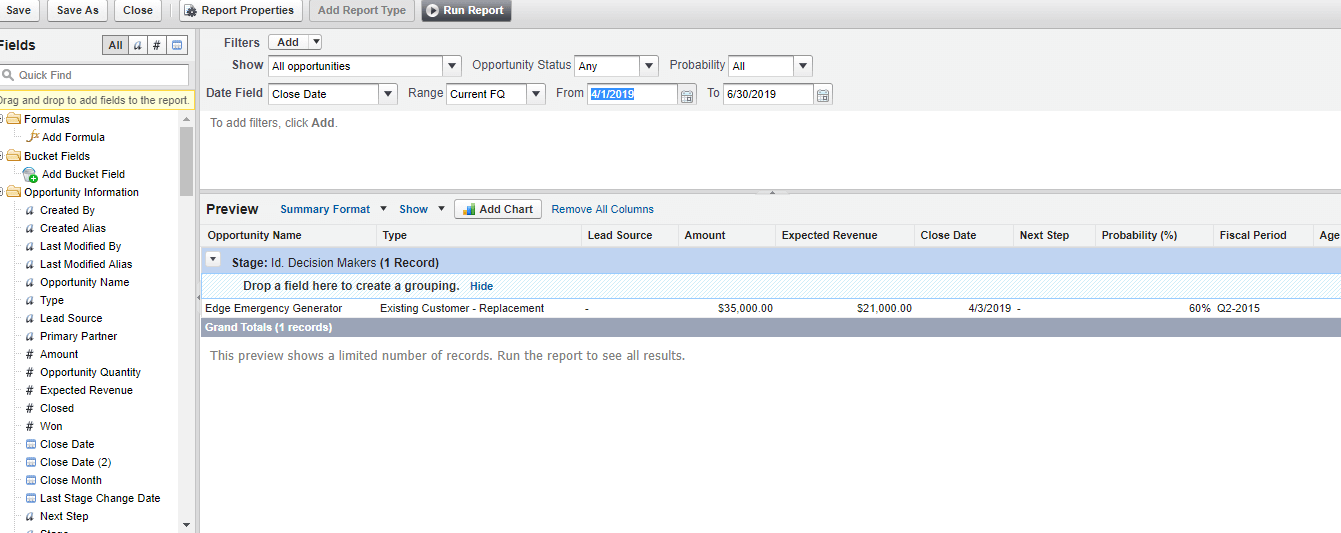
Besides, summary reports allow you to create the add charts to the reports. This report type usually supports different kinds of charts to analyze the data. This report supports 7 types of charts
- Horizontal bar chart
- Vertical bar chart
- pie chart
- Donuts chart
- Scatter chart
- Funnel chart
- Line chart
Matrix reports:
This kind of reporting is some kind of dissimilar to the above two. Since the matrix is a combination of rows as well as columns, it allows you to add columns in both rows fields as well as the columns filed. So for instance, I would like to add the industry filed to the rows (just drag it as well as drop it).
Joined Report type:
This allows you to merge two (or) more reports using the common filed. Unlike other reports, this report kinds facilitates with a special option of add report type. So you can add the report types and can merge the reports.
So as an example. I would like to group accounts as well as users.
Initially, when a accounts report is created, select the report type as joined and then select on add report type and now select the report type as Users.
Since two reports were added, now its time to add the fields. and I would like to add the Account Owner Field. And you can find this option at common fields-- > Account general -- > Account owner
And finally, click on save.
And finally, you will be entering into the following screen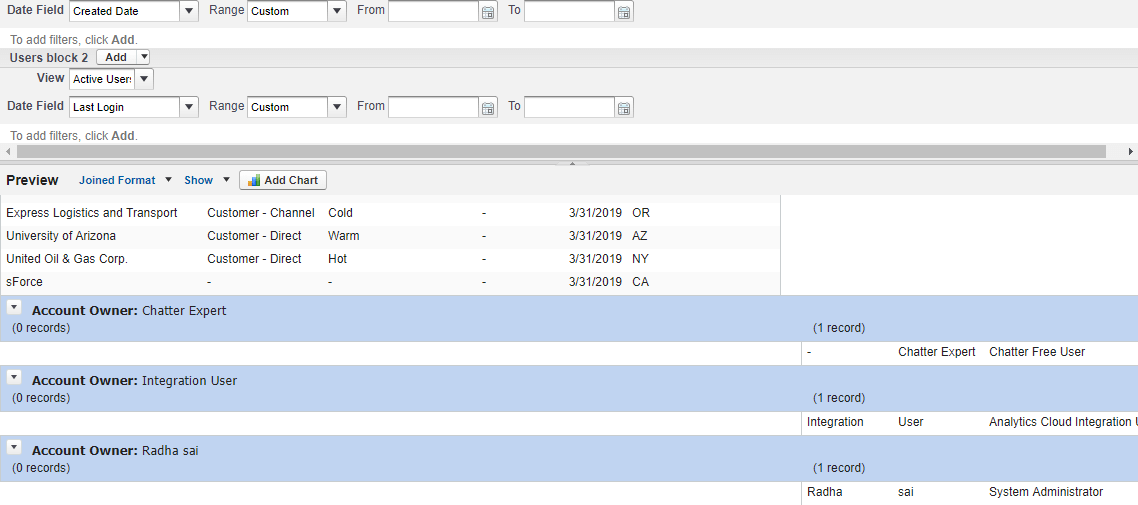
So if you have carefully observed the above screenshot clearly, with the username balajee, we have 12 records on Accounts object. And with the same user name, one record on the users object.
Also, click the link to know more on Salesforce Einstein analytics
So now, let's move on the Dashboard
What is a dashboard?
Dashboards are a quick way to view the summarized data at once. In a single dashboard, you can have up to 20 components. The profiles which have access to the specific reports can view dashboards. So whenever, you refresh the dashboard, it displays up to date data. It is the easiest way to share information among the colleagues and the management team. These dashboards were helpful to analyze and compare the reports each year. Besides dynamic dashboards, permits the user to access the data, according to the permission they are provided with. Dashboard access is not allocated to the user if he does not have the read-only access to the user.
So now, let us create the dashboard.
Like before, click on Reports. So once you entered into the Reports object, you will be finding, New dashboard option, click on it to create a dashboard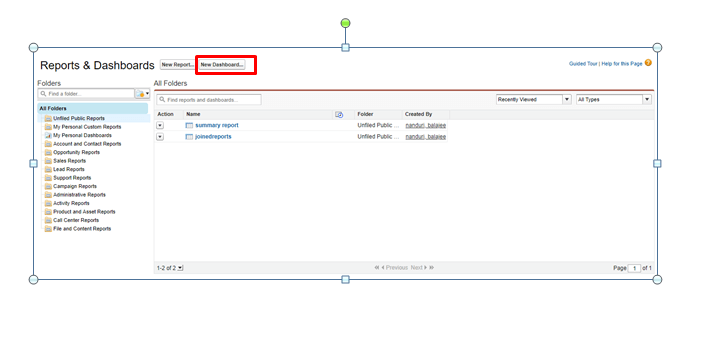
The dashboard usually consists of components as well as data sources. The Components tab usually consists of different types of charts. You can easily drag and drop those charts in the dashboard. And in a single dashboard, you can show a maximum of 3 components. Besides in the data sources, you have reports that you generated previously.
So as said you above first drop the components and then bring the data sources. And you will be entered into the following screen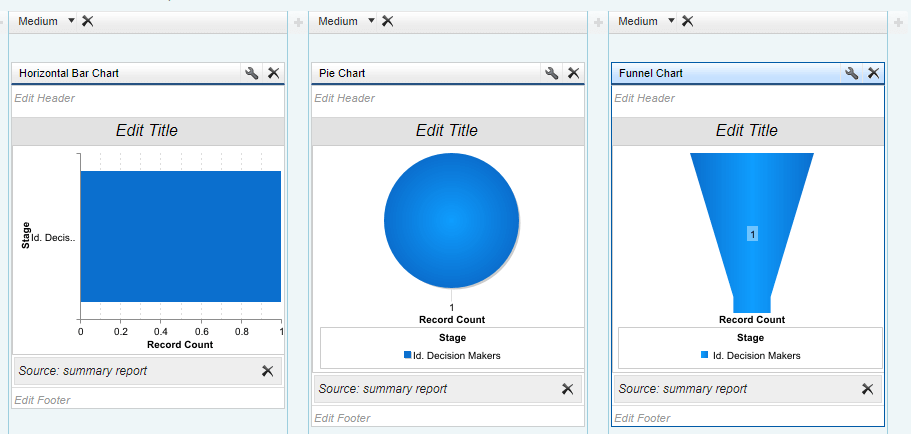
And click on SAVE.
Salesforce dashboard benefits:
Salesforce offers a number of advantages for business users in visualizing the sales as well as the marketing data. This includes
Easy to use:
As explained above, dashboard creation is easy. Besides, it takes very less time to create the dashboard and access the information related to the dashboard. Moreover, predefined templates are created for the business user conveyance and the craft dashboard creation is just in minutes
Live data analysis:
Salesforce dashboards provide business users with the data up to date and support them to maintain marketing trends and patterns. So in this ways, user can perform the live data analysis, real-time sales analysis and manipulate their day -to -day efforts.
Problem identification:
Marketing and sales professions go on checking for the ways to identify and resolve the potential problem before escalations. So Salesforce platform provides a quick analysis of marketing trends and solves the issues.