
In this year Tableau comes with many updates such as Hyper and Linux arrive in 10.5 by those updates Tableau will increase the performances of the dashboard and gives the result smooth and continuous it just like seamless. But what happens in 2017? it's time to know. Through back to 2017 there are some highlights take place in Tableau. This blog explains the What are the Tableau Highlights in 2017? Take an attention know what happens in 2017. Is really Tableau come with 10.4 beta to better collaborate? and Any tips from the dashboard experts?
In 2017 Tableau came with some great ideas. Elena Hristozova's posted about Dashboard Development and Designing Thinking every one like his post. The subject related to his post is very close to heart and provided with a clear-cut information and it's really very good to see people applying existing model to our field. For this case, Elena took a decision on Double Diamond model and reworked it for dashboards. If you want more about on tableau dashboard then wait for a second I give some tips regarding dashboard in below paragraph.
What are the Tableau Highlights in 2017?
Finally come to the topic Highlights in 2017. Through back to 2017 what happened in that year let 's take a look to in that year my dear readers don't go through your personal memories what happen in 2017(just kidding). I explain some highlights what I have in my mind. Tableau came with Tableau 10.4 beta to better collaborate on trusted data. And next one is a dashboard expert reveals tips and tricks for better your organization.
Tableau 10.4 is here!
After Tableau 10.4 was released, users getting the right data in front of right peoples across the company. Organizations took help of Data source certification to promote the best source for teams to use. They work continuously with your recommendations for the data source. Now your data experts can approve the data and then uploaded to Tableau Online and Tableau Server for border use. You will trust your analysis because it's all based on blessed. Magic does not stop there, recommendations for data source have added for the purpose of to take advantage of the collective expertise of your company. For your bright future join Tableau Online Training.
Unwanted work was deleted by using data that already been prepared: For finding the data to leverage machine learning-generated recommendations this is the right solution for your analysis. Don't worry about compatibility of Tableau Desktop and Tableau Server. Now you can downgrade and publish workbooks suppose, connected to Tableau 10.2 don't worry about your data visualizations those data available on Tableau Server, even it has been updated yet.
Tips and Tricks from the dashboard experts
They are several examples that succeed in data storytelling and delivering insights. Here I give some tips and tricks you can apply right now for the best result of your dashboard.
Avoid clutter:
This is the first attempt to people who are building a dashboard, it's tempting to throw the chart or graph onto them. Be careful in that don't fall into that trap. In this situation, the trick is to remove as much as you can while taking the end user right insight from your dashboard.
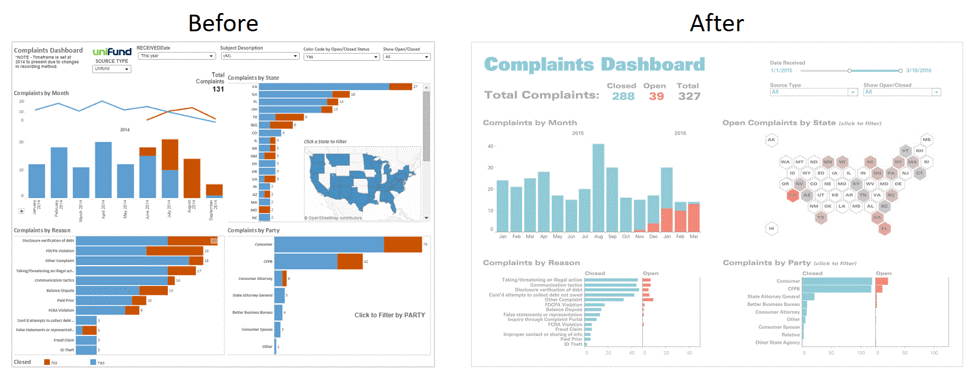
Use a grid layout:
We can place an object in the dashboard in a grid format. It helps to provide reading order to your dashboard, this process will help to the users guide themselves in a predictable and logical way.
Use the right fonts:
They are several fonts present those are tempting to use too, don't do that: define a clear hierarchy of your typography.
If you want to become an expert in tableau join in Tableau Training and get certificate from authorities then get a job.Simply your use of color:
Color is a most tempting thing while creating the dashboard. Frankly, saying that how many times dashboard looks like an accident in a paint shop. You only the responsibility to justify every single color on the dashboard. One thing will keep in mind 8% of males have CVD (color-vision deficiency).
That's all guys, I know this is not sufficient data, you want more information Get touch with OnlineITGuru for mastering the Tableau Tutorial
Recommended Audience :
Software developers
ETL developers
Project Managers
Team Lead’s
Prerequisites:
Anybody can learn Tableau if don't have a technical degree with basic coding knowledge. Trainers of OnlineITGuru will teach every topic they are real-time experts.